

International Journal of
Environmental Research
and Public Health
Article
The Role of Social Context in Physiological and Psychological
Restoration in a Forest: Case Study of a Guided Forest Therapy
Program in Taiwan
Chia-Pin Yu 1,2,3 , Heng-Ting Chen 1, Pei-Hua Chao 4,*, Jie Yin 3,5 and Ming-Jer Tsai 1,2
1 School of Forest and Resource Conservation, National Taiwan University, Taipei 10617, Taiwan;
simonyu@ntu.edu.tw (C.-P.Y.); r05625010@ntu.edu.tw (H.-T.C.); tmj@ntu.edu.tw (M.-J.T.)
2 The Experimental Forest, College of Bioresources and Agriculture, National Taiwan University,
Nantou 55704, Taiwan
3 Department of Environmental Health, Harvard T.H. Chan School of Public Health, Boston, MA 02138, USA;
jieyin@hsph.harvard.edu
4 Department of Bio-Industry Communication and Development, National Taiwan University,
Taipei 10617, Taiwan
5 College of Architecture and Urban Planning, Tongji University, Shanghai 200092, China
* Correspondence: d02630003@ntu.edu.tw; Tel.: +886-2-3366-4618
Citation: Yu, C.-P.; Chen, H.-T.; Chao,
P.-H.; Yin, J.; Tsai, M.-J. The Role of
Social Context in Physiological and
Psychological Restoration in a Forest:
Case Study of a Guided Forest
Therapy Program in Taiwan. Int. J.
Environ. Res. Public Health 2021, 18,
10076. https://doi.org/10.3390/
ijerph181910076
Academic Editors: Won Sop Shin and
Bum-Jin Park
Received: 31 July 2021
Accepted: 20 September 2021
Published: 25 September 2021
Abstract: Existing studies have demonstrated the restorative benefits of being in forests. However,
most studies have designed participants to engage individually in forest walking and viewing, which
neglects the social aspect of conversation. Researchers suggested that social context should be studied
in order to have a better understanding how forests foster human health. To this end, we examined
the role of social context using three types of forest therapy programs: a guided program, a self-
guided program, and a walk alone program. A between-subject, pretest–posttest field experimental
design was employed to evaluate restorative effects by measuring the physiological responses and
mood states incurred in different forest therapy programs. Our findings showed, that the walk
alone group exhibited a significant systolic blood pressure decrease and a significant increase in
sympathetic nervous activity; the self-guided group showed a significant increase in heart rate values
and significant decreases in systolic blood pressure and diastolic blood pressure; and the guided
group revealed a significant decrease in systolic blood pressure. Further, the three forest therapy
programs had positive effects on improving mood states, except a nonsignificant vigor–activity
increase in the walk alone group. The three programs did not exhibit significant differences in
changes of restorative benefits in physiological and psychological measures except for a significant
difference in changes in sympathetic nervous activity between the walk alone group and guided
group. The results showed the restorative benefits of forest therapy are apparent regardless of the
program type. The management team should continue promoting forest therapy for public health by
providing different types of forest therapy programs and experiences.
Publisher’s Note: MDPI stays neutral
with regard to jurisdictional claims in
published maps and institutional affil-
iations.
Keywords: forest therapy; restorative benefits; physiological and psychological responses; guided
program; field experimental design
Copyright: © 2021 by the authors.
Licensee MDPI, Basel, Switzerland.
This article is an open access article
distributed under the terms and
conditions of the Creative Commons
Attribution (CC BY) license (https://
creativecommons.org/licenses/by/
4.0/).
1. Introduction
Convergent evidence indicates connecting with natural environments, such as forests,
has proven to be an effective approach to reduce mental health symptoms and physiological
stress [1–8]. The amount of scientific evidence highlighting the health benefits of interacting
with nature is continually increasing. Miyazaki, Song, and Ikei [9] discussed nature
therapy as an intervention to prevent negative health outcomes via increasing physiological
relaxation and strengthening the immune system. More specifically, immersion in natural
environments helps to reduce stress levels and improve immune response, suggesting
nature therapy can improve an individual’s resistance to disease. Among all types of
Int. J. Environ. Res. Public Health 2021, 18, 10076. https://doi.org/10.3390/ijerph181910076
https://www.mdpi.com/journal/ijerph

Int. J. Environ. Res. Public Health 2021, 18, 10076
2 of 17
nature therapy, forest therapy has been discussed at length and there is substantial scientific
evidence supporting its positive effects on human health [9]. Being in a forest can reduce
an individual’s stress levels and improve their physical and mental health. The Ministry of
Agriculture, Forestry and Fisheries in Japan coined a word, shinrin-yoku (translates literally
as “forest bathing”), describing it as a process people use to restore balance and health
by immersing themselves in a forest environment and absorbing its atmosphere [10]. The
term “forest therapy,” derived from shinrin-yoku, describes the medically proven health
effects resulting from exposure to forests [11] (p. 2533). Additionally, Korean researchers
defined forest therapy as “immune-strengthening and health-promoting activities utilizing
various elements of the forest, such as fragrance and scenic view” [12] (p. 274). In Taiwan,
we consider forest therapy to be a therapeutic recreational activity using forest resources to
improve human health and well-being, as well as to promote a sustainable lifestyle that
contributes to the human–nature balance [13]. Because of the ample evidence supporting
its health effects, forest therapy has gained popularity and has become recognized globally
as an effective method for reducing stress levels and promoting population health [14,15].
Forest therapy research applies an evidence-based approach and field experiments
to evaluate the health outcomes of participants. Empirical studies have demonstrated
the beneficial health effects on mental health of being in forests [2,6,16–21]. Those studies
indicated that in forest environments the intensity of participants’ negative emotions
decreased while their positive emotions increased, as compared to the emotions of people
in urban settings. For instance, Park et al. [20] implemented a large-scale field study in
Japan, recruiting 168 participants from 14 forests and 14 urban areas and administering
the Profile of Mood States (POMS) questionnaire to evaluate the psychological effects of
forest therapy. They learned participants’ levels of vigor were significantly higher and their
negative emotions were lower in the forest, as compared to people in the urban settings.
Similar results were reported by Lee et al. [19] and Takayama et al. [21], who both reported
that immersion in forests increased feelings of vigor, subjective recovery, and vitality and
decreased levels of anxiety, as compared with immersion in urban settings. In addition,
studies have revealed positive relationships between forest therapy and physical health.
For instance, forest therapy reduces pulse rate and blood pressure [3,5,6,8,11,16,22–26],
increases parasympathetic nervous system (PSNS) activity, reduces sympathetic nervous
system (SNS) activity [10,18,19,22,23,27], and improves immune system response [28–30].
The findings have proven psychological and physiological restoration of being in a forest
and these indicators turn out a standard in forest therapy research.
Previous studies have illustrated the mental and physical health effects of forest
therapy. However, most studies have asked participants to engage individually in forest
walking and viewing in order to limit the effects of confounding factors (e.g., company or
social interaction), which neglects the social aspect of conversation in forest therapy. In
other words, rarely has recent forest therapy literature discussed social context or explored
the potential effects of interaction between participants or between participants and a guide
on psychological and physiological outcomes. Table 1 lists research with two experiential
types and the major studies using solo activities in their experimental design. In actual
forest therapy practice, a guide typically leads the way in order to ensure the safety of
participants and helps to immerse them in the forest through planned activities. Guided
forest therapy research (see Table 1) has demonstrated forest therapy programs can have
substantial physiological and psychological benefits for selected groups. For example, in
a one-group pretest–posttest field experimental design, a guided forest therapy program
resulted in a significant decrease in pulse rate and blood pressure, alleviated negative
emotions, and improved positive affect [31]. Although those results are promising, because
of the lack of a walk alone comparison in the study, it remains unclear whether a guide can
contribute to the benefits of forest therapy programs.

Int. J. Environ. Res. Public Health 2021, 18, 10076
3 of 17
Table 1. Reviewed literature on types of programs in forest therapy studies.
Programs
Alone (participants walking and/or watching in a forest
individually)
Guided (participants interacting with a guide)
References
Beil and Hanes [32]; Komori et al. [33]; Lee et al. [16]; Lee et al. [18];
Mao et al. [5]; Park et al. [20]; Park et al. [27]; Park et al. [10]; Park et al.
[22]; Song et al. [8]; Takayama et al. [21].
Chen, Yu and Lee [34]; Ochiai et al. [7]; Ochiai et al. [11]; Song et al.
[24]; Yu et al. [31].
Meyer and Bürger-Arndt [35] suggested that social context should be studied so as to
better understand how forests foster human health. To our knowledge, a limited amount of
research has been performed quantifying the health effects of human company (e.g., [36,37]).
Staats and Hartig [37] concluded that company creates a feeling of safety that can facilitate
restoration; however, after controlling for safety, they found that walking alone also can
enhance restoration. In other words, they explained two opposite effects of company
in a natural environment, that (a) company enables restoration through a pathway for
safety, and (b) solitude enhances restoration when safety is satisfied. Igawahara et al. [36]
investigated the physiological and psychological responses of participants in a guided
forest bathing program and compared those with a walk alone program. Their results
suggested that walking with a guide produces stronger therapeutic and relaxation effects
than does walking alone. Both of these studies illustrate the relationship between company
and a sense of safety, so it can be said from a social context aspect that those two factors
in combination enhance the restorative quality of a nature experience. Urban dwellers
may experience feelings of insecurity and discomfort when visiting forests because of their
unfamiliarity, but a guide could mitigate these feelings, possibly contributing to stress
relief and a mood state change [36] (p. 600). Therefore, a guided forest therapy program
may promote restoration by nurturing a feeling of safety [36–38]. Moreover, guides play a
role in providing enjoyable and immersive experiences in forests through interpretation
and leading of therapeutic activities. These social interaction and fun activities yield a
positive affective experience that contributes to restorative benefits [39]. Conversely, the
direct attention of participants may be occupied as focus is required to follow a guide’s
instructions, and that may degrade the quality of the restorative experience as compared to
walking alone [38,40]. Anecdotally, a participant having followed a guided forest therapy
activity in a previous study provided this feedback: “the guide was professional and
excellent, however sometimes I felt he was interrupting my connection with the forest.”
This intriguing feedback inspired the following question: “when promoting forest therapy,
should we encourage people to experience forests alone or with a guide?” In other words,
“does a guided program enhance the restorative benefits of forest therapy?” is an interesting
and practical question in the study of forest therapy that remains unanswered because of a
lack of evidence supporting or contradicting it.
To address this question, in this exploratory study we examined the role of social
context using three types of forest therapy programs: a guided program, a self-guided
program, and a walk alone program supported by the Experimental Forest of National
Taiwan University. We then investigated the restorative benefits using the selected forest
therapy programs as a between-subject, pretest–posttest field experimental design.
2. Materials and Methods
2.1. Study Site
This study was conducted in the Xitou Nature Education Area (XNEA), Taiwan which
is managed by the Experimental Forest of National Taiwan University. The Experimental
Forest was created in 1901 with four primary objectives, namely academic research, envi-
ronment education, natural resource conservation, and forest management demonstration.
XNEA is located in a concave valley surrounded on three sides by mountains, covers
approximately 2200 hectares, and ranges from 800 to 2000 m in elevation. The planted
forest mainly consists of Cryptomeria japonica and Phyllostachys pubescens, with stand ages

Int. J. Environ. Res. Public Health 2021, 18, 10076
4 of 17
ranging from 40 to 90 years. The local temperature ranges from 11.0 to 20.8 ◦C (with an
annual average temperature of 16.6 ◦C) and the relative humidity ranges from 88% to 93%.
XNEA is a popular forest recreation destination in Taiwan and receives approximately two
million visitors per year [41]. In addition, a well-established forest trail system has enabled
XNEA to become an ideal location for forest therapy [42]. Today, the Experimental Forest
plays a crucial role in promoting forest therapy in Taiwan, and forest therapy has become a
primary focus of XNEA in its attempts to improve public health. Visitors can experience
forest bathing alone or they can reserve a spot in a guided forest therapy program. The
guided programs aim to improve the mental and physical health of participants through
several therapeutic recreation activities, which entail stimulation of four senses: vision
(observing different landscapes), hearing (listening to the sounds of birdsongs and running
streams), olfaction (smelling wood and air), and touch (tangibly feeling cypress and the
surfaces of leaves and trees). However, due to the limited capacity of the guided forest
therapy programs, self-guided programs using designated maps to promote the sensory
experiences are offered as an alternative for unguided visitors.
2.2. Experimental Design
A between-subject, pretest–posttest field experimental design was employed to eval-
uate the physiological responses and mood states incurred in different forest therapy
programs. All participants were randomly assigned into the three study programs. Only
the investigators know which program the participant is receiving. The single-blind design
makes the results of study less likely to be biased. Three types of two hours forest therapy
programs were designed for this study: a walk alone program (Control (C) group), a
self-guided map program (Map (M) group), and a guided program (Guided (G) group).
The C group was asked to freely explore the forest and to leisurely walk alone. The M
group received a portable map to guide themselves alone, while the G group was led by
a tour guide. The map illustrated the route and provided instructions of the activities
that participants in the M group were solicited to follow. The participants of the M group
were asked to engage in multisensory (visual, auditory, olfactory, and tactile) activities in
the selected locations by following the instructions on the self-guided map; the following
activities were included to encourage immersion in nature: observing the forest landscapes,
listening to birdsongs and the river, inhaling and exhaling forest air, and embracing trees.
The route and activities for the M and G groups were identical and the primary difference
between these two groups was the presence of a guide.
The guided forest therapy program involved a three-kilometer journey at 1100–1200 m
above sea level with an average walking speed of 2 km per hour. The program included
multisensory experience activities, namely visual (observing the forest landscapes and
looking for various colors), auditory (listening to the birdsongs and river), olfactory (in-
haling and exhaling forest air), and tactile (embracing trees and touching bark) activities
that helped to immerse the participants and to connect them with nature. Each activity
was conducted at the same location to ensure participants in each group had a similar
experience. To avoid stylistic differences between guides, all the guided programs were
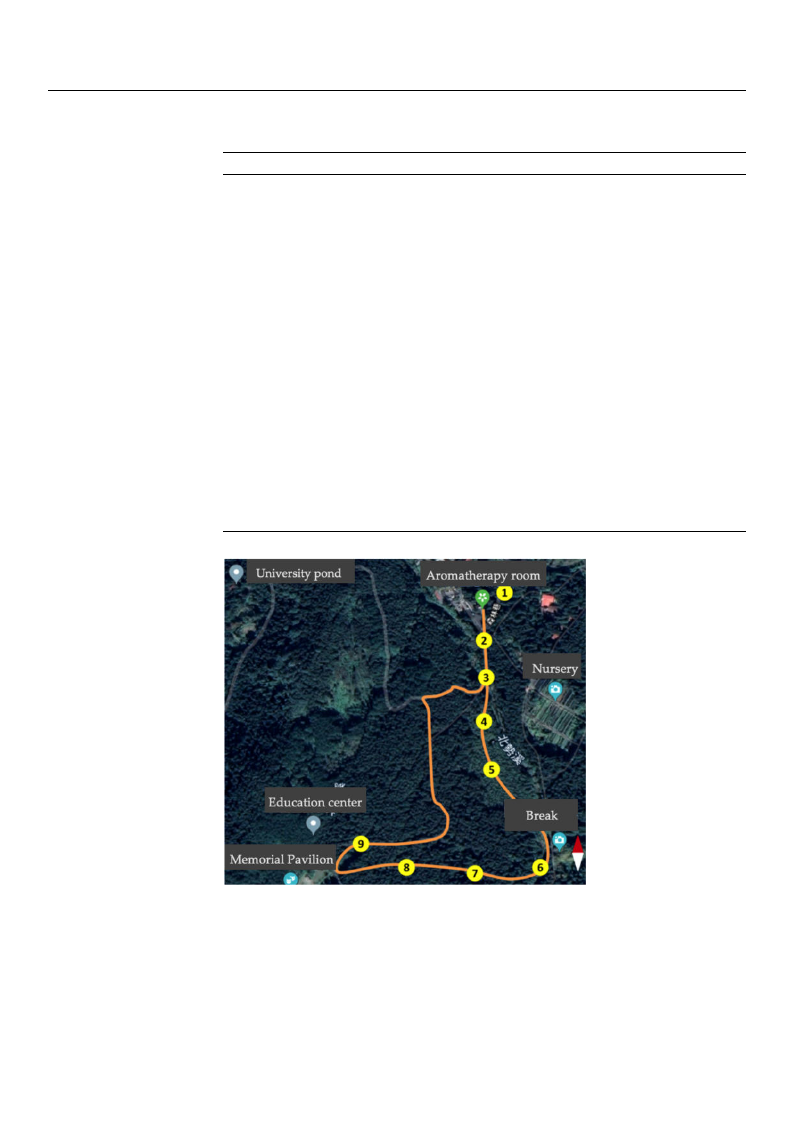
led by the same guide. The guided program’s time frame and locations are presented
in Table 2 and Figure 1. Further, we controlled participant number at approximately six
people to have a quality experience and to avoid a long waiting time of evaluation in the
guided group.
Int. J. Environ. Res. Public Health 2021, 18, 10076
5 of 17
Table 2. Timeframe and activities for the guided forest therapy program.
Locations
1
2
3
4
5
6
7
8
9
Activities
Warm-up and departing the
aromatherapy room for
Location 2
Starting point: explaining the
sensory activities in the forest
therapy program (visual,
auditory, olfactory, and tactile)
Strolling in a bamboo forest
Admiring forests, listening to a
river, and exploring sounds
from insects and birds
Cooling down with stream
water; breathing and stretching
exercises
Break
Walking on a Japanese cedar
path and experiencing the
forest’s density and serenity
Embracing trees and enjoying
the forest air
Listening to nature in the quiet
forest and sharing sounds with
other participants
Wrap-up
Senses
Visual and tactile
Visual and auditory
Tactile and olfactory
Visual and auditory
Tactile and olfactory
Auditory
Time (min)
5
5
10
10
15
10
10
10
10
5
Figure 1. Map of forest therapy activities with locations.
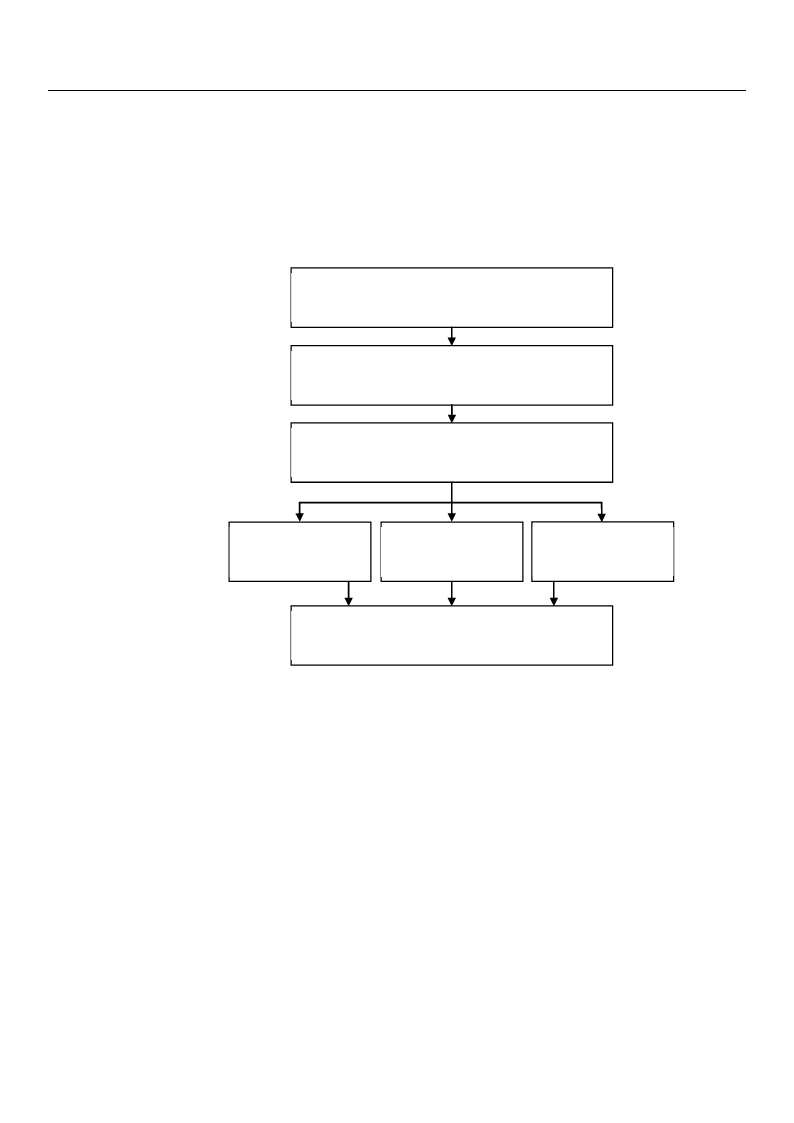
The experiment began with an orientation session in an indoor facility, during which
researchers briefly explained the experiment and then asked the participants to sign a con-
sent form to reflect that the participants understood and agreed to participate in the study.
In the pretest stage, the participants filled out a pretest questionnaire, which included
demographic information and questions regarding emotional status. Then, participants’
physiological measurements were recorded, after which participants were randomly as-
signed to one of the three programs: (1) the C group freely strolled through the forest and
Int. J. Environ. Res. Public Health 2021, 18, 10076
6 of 17
returned to the facility by an appointed time; (2) the M group was asked to follow the
designated route displayed in the map, visit marked locations on the forest therapy map
for specific activities, and return to the facility by an appointed time; and (3) the G group
was led through the forest therapy program by an instructor who guided participants in
experiencing nature. After finishing the program, all participants filled out the posttest
questionnaire and again had their physiological measurements recorded (Figure 2). The
programs for all three groups were restricted to approximately two hours.
Recruiting subjects
(online sign up and on-site registration)
Orientation
(debriefing and signing of consent form)
Pretest
(psychological and physiological measures)
Guided program
(2 hrs)
Self-guided
program (2 hrs)
Walk alone
program (2 hrs)
Posttest
(psychological and physiological measures)
Figure 2. Experimental procedure.
2.3. Participants
The experiment was promoted on-site at XNEA and through an online platform.
Participants could either sign up online or register at XNEA to participate in the forest
therapy experiment. The participants were required to be at least 20 years old and phys-
ically capable of completing the selected program. Consumption of tea, coffee, or other
caffeinated drinks was not allowed during the day of the experiment until after the pro-
gram was completed. In total, 99 participants were recruited and randomly assigned to
the three two-hour programs. The study period was from 26 July–12 August 2018. Due to
rain-related cancellations, the experiment was conducted over thirteen days. There were
two sessions per day, one of which was a morning session from 8:00 a.m. to 12:30 p.m. and
the other an afternoon session from 13:30 p.m. to 17:00 p.m. The study was approved by
the Research Ethics Office of National Taiwan University (NTU-REC No. 201607HS008).
2.4. Physiological Measures
Heart rate (HR), systolic blood pressure (SBP), diastolic blood pressure (DBP), sym-
pathetic nervous system (SNS) activity, parasympathetic nervous system (PSNS) activity,
and sympathovagal balance (balance between the SNS and PSNS) were measured using
the Quantitative Heart Rate Variability (QHRV; Medeia, Bulgaria) tool, which is validated
and approved by the U.S. Food and Drug Administration. The QHRV is portable and easy
to use and can evaluate and record these physiological measures in five minutes. These

Int. J. Environ. Res. Public Health 2021, 18, 10076
7 of 17
physiological measures are considered to be important indicators of human health and are
in wide use in forest therapy studies (e.g., 7, 11, 12, 18). The autonomic nervous system
consists of the SNS and PSNS activities. A higher level of SNS activity reflects that an
individual is in a stressed state. Conversely, when a stressor is removed PSNS activity is
triggered in order to return to an unstressed state, and PSNS is involved in regulating body
function while in a resting state [43]. In forest therapy studies, the activities of SNS and
PSNS have been evaluated using power spectral analysis of heart rate variability (HRV) and
quantification of low frequency (LF, 0.04–0.15 Hz, representing SNS) and high frequency
(HF, 0.15–0.40 Hz, representing PSNS) power. Nevertheless, concerning respiratory activity
influences evaluation of SNS and PSNS activities and suggests more accurate measures
by incorporating respiratory activity analysis with concurrent HRV analysis, yielded new
indicators, namely LFa and RFa, that provide more accurate results of the functioning
of SNS and PSNS, respectively [44–47]. Specifically, RFa is the average MIT-standard
respiratory frequency area (beats per minute2/Hz), which is a measure of PSNS tone,
and represents the frequency ranges associated with respiratory sinus arrhythmia (the
cardiovagal response) and measures PSNS activity from higher frequency areas of the HRV
spectrum. LFa is the average MIT-standard low frequency area (beats per minute2/Hz),
which is a measure of SNS tone as mediated by PSNS tone. LFa/RFa ratio represents
sympathovagal balance (SB) and is the average MIT-standard ratio (unitless), which is a
measure of ANS balance [44–46,48,49]. The normal ranges of RFa and LFa for adults are
from 1.0 to 10.0 bpm2, respectively. The normal range for SB (LFa/RFa) is 0.4 < SB < 3.0 [46],
(p. 125). A higher or lower score may associate with a health issue. For measuring au-
tonomic nervous system (ANS) activity in the current study, both indicators, LFa and
RFa, reported by QHRV, were used for representing sympathetic nervous activity and
parasympathetic nervous activity, respectively, and sympathovagal balance (LFa/RFa) was
calculated accordingly.
2.5. Psychological Measures
We employed the short form of the POMS (POMS-SF) scale [50] with satisfactory
validity and reliability, which has been widely used in forest therapy studies in order to
examine the psychological restorative effects resulting from mood state changes [19–21].
This scale is composed of six constructs with 37 adjectives and used to measure emotional
state in the dimensions of tension–anxiety (6 items), anger–hostility (7 items), fatigue–
inertia (5 items), depression–dejection (8 items), confusion–bewilderment (5 items), and
vigor–activity (6 items). The POMS-SF scale is scored on a 5-point Likert scale (0 = not at
all; 4 = extremely). The sum of points received for items in one dimension is the total score
for that dimension, so a high total score indicates a high level of the emotion represented
by that dimension.
2.6. Statistical Analyses
The data were compiled, coded, and crosschecked in order to minimize human error.
The statistical methods in this study include descriptive statistics, paired-sample t-test,
and one-way ANOVA. The descriptive analysis results of major study variables were
represented as mean ± standard deviation. Pretest–posttest comparisons of physiological
and psychological measures across the three groups were completed using paired-sample
t-tests. For comparing the restorative effects among the programs (G, M, and C groups), we
used one-way ANOVAs on gain (or loss) scores [51] and the changes in percentages were
reported. The significance level in this study was 0.05 and effect size was measured using
partial eta squared (ηp2). All analyses were executed with SPSS 20.0 (IBM Corporation,
NY, USA). Further, Levene’s homogeneity was checked for all pretest scores among three
groups and revealed the variance of these scores were equal across groups.

Int. J. Environ. Res. Public Health 2021, 18, 10076
8 of 17
3. Results
3.1. Demographic Information
The demographics of the 99 study participants are presented in Table 3. It is noted
that 37, 34, and 28 participants were randomly assigned to the C, M, and G groups,
respectively. Overall, 40 men (40.4%) and 59 women (59.6%) participated, with 38 people
aged 21–30 years (38.4%), 14 aged 31–50 years (14.1%), 41 aged 51–65 years (41.4%), and 6
aged 66 years and older (6.1%). The average age was 43.7 years, with a standard deviation
of 16.7 years. Nearly 76% of participants had a college degree. Most of the participants lived
in either urban or suburban areas and had visited natural spaces within the past month.
The pre-and-post physiological and psychological measurements of the three groups are
displayed in Table 4. Because of device failure and time constraints, physiological data
of 12 participants in the C group and one participant in the M group were incomplete, so
those participants were excluded from the analysis of physiological responses.
Table 3. Demographic characteristics of study participants (N = 99).
Demographics
Gender
Age
Education
Living area
Last time to visit nature
Female
Male
21–30
31–50
51–65
≥66
Graduate school
College
High school
Middle school and below
Urban
Suburban
Rural
Others
Within 1 week
Between 1 week and half
month
Between half month to 1
month
Over 1 month
N (%)
40 (40.4)
59 (59.6)
38 (38.4)
14 (14.1)
41 (41.4)
6 (6.1)
17 (17.2)
58 (58.6)
17 (17.2)
7 (7.1)
45 (45.5)
42 (42.4)
9 (9.1)
3 (3.0)
38 (38.4)
30 (13.5)
8 (8.1)
23 (23.3)
Table 4. Descriptive analysis among three groups.
Indicators
N
Walk Alone Group
(Control, C)
N
Self-Guided Group/Map
(M)
N
Guided Group (G)
Pre
Post
Pre
Post
Pre
Post
HR (bpm)
25 a 71.7 ± 10.3 73.0 ± 11.5 33 b 70.5 ± 8.1
74.1 ± 11.4 28 75.1 ± 10.8 76.8 ± 13.4
SBP (mmHg) 25 a 123.0 ± 14.7 118.2 ± 13.6 33 b 119.4 ± 18.6 115.8 ±16.4 28 116.3 ± 14.1 110.1 ± 12.3
Physiological
DBP (mmHg)
RFa (bpm2)
25 a
25 a
75.0 ± 7.9
1.4 ± 0.8
72.7 ± 6.9 33 b 74.5 ± 7.1
1.7 ± 0.8 33 b 1.6 ± 1.0
72.5 ± 7.5
1.4 ± 0.9
28
28
71.7 ± 7.5
1.5 ± 0.6
71.0 ± 7.8
1.4 ± 0.8
LFa (bpm2) 25 a 1.2 ± 0.7
1.4 ±0.6
33 b
1.3 ±0.7
1.2 ± 0.7
28
1.4 ± 0.5
1.2 ± 0.4
LFa/RFa
25 a 1.0 ± 0.5
0.9 ± 0.4 33 b 1.0 ± 0.5
1.0 ± 0.5
28
1.1 ± 0.5
1.0 ± 0.4
T–A
37
4.2 ± 5.2
1.4 ± 2.7
34
6.5 ± 5.9
3.2 ± 3.5
28
6.9 ± 6.1
1.9 ± 2.9
D–D
37
4.3 ± 6.9
1.3 ± 3.2
34
6.2 ± 6.4
2.1 ± 3.4
28
6.0 ± 6.4
1.9 ± 3.2
Psychological
A–H
C–B
37
3.6 ± 6.1
37
4.4 ± 4.0
1.7 ± 2.8
34
4.7 ± 5.4
1.8 ± 2.3
34
6.4 ± 4.5
2.4 ± 2.5
28
4.3 ± 5.0
2.6 ± 2.7
28
6.8 ± 4.6
2.0 ± 1.9
2.3 ± 2.6
F–I
37
5.9 ± 5.0
4.1 ± 4.3
34
6.6 ± 5.4
4.4 ± 3.0
28
7.5 ± 5.2
5.1 ± 3.9
V–A
37
15.4 ± 4.8
15.6 ± 4.8
34
13.3 ± 5.0
15.1 ± 4.6
28
12.8 ± 4.5
15.1 ± 4.2
Abbreviations: HR, heart rate; SBP, systolic blood pressure; DBP, diastolic blood pressure; RFa, respiratory frequency area (parasympathetic
nervous system activity measure); LFa, low frequency area (sympathetic nervous system activity measure); LFa/RFa (measure of
sympathovagal balance); T–A, tension–anxiety; D–D, depression–dejection; A–H, anger–hostility; C–B, confusion–bewilderment; F–I,
fatigue–inertia; V–A, vigor–activity. Note: (a) 12 participants did not have physiological measurements taken; (b) 1 participant did not have
physiological measurements taken.

Int. J. Environ. Res. Public Health 2021, 18, 10076
9 of 17
3.2. Influence of Programs on Physiological Responses
The results of paired-sample t-tests that were used to determine whether or not the
changes in physiological responses were significant are presented in Table 5. The results of
one-way ANOVAs on gain (or loss) scores for cross-group comparison and the amounts of
change are reported in Table 6.
Table 5. Paired-sample t-test results of physiological responses in the three programs.
Group C
Pre
Post
t
p
Change (%)
HR (bpm)
SBP (mmHg)
DBP (mmHg)
RFa (bpm2)
LFa (bpm2)
LFa/RFa
71.7 ± 10.3
122.8 ± 14.7
75.0 ± 7.9
1.4 ± 0.8
1.2 ± 0.7
1.0 ± 0.5
73.0 ± 11.5
118.2 ± 13.6
72.7 ± 6.9
1.7 ± 0.8
1.4 ±0.6
0.9 ± 0.4
0.872
−2.741
−1.945
2.021
2.184
−0.793
0.392
0.011 *
0.064
0.055
0.039 *
0.436
1.73
−3.78
−3.09
21.13
15.45
−6.93
Group M
Pre
Post
HR (bpm)
SBP (mmHg)
DBP (mmHg)
RFa (bpm2)
LFa (bpm2)
LFa/RFa
70.5 ± 8.1
119.4 ± 18.6
74.5 ± 7.1
1.6 ± 1.0
1.3 ±0.7
1.0 ± 0.5
74.1 ± 11.4
115.8 ±16.4
72.5 ± 7.5
1.4 ± 0.9
1.2 ± 0.7
1.0 ± 0.5
3.413
−2.832
−2.502
−1.332
−0.933
0.373
0.002 **
0.008 **
0.018*
0.192
0.358
0.711
5.12
−3.04
−2.70
−10.76
–6.87
4.12
Group G
Pre
Post
HR (bpm)
SBP (mmHg)
DBP (mmHg)
RFa (bpm2)
LFa (bpm2)
LFa/RFa
75.1 ± 10.8
116.3 ± 14.1
71.7 ± 7.5
1.5 ± 0.6
1.4 ± 0.5
1.1 ± 0.5
76.8 ± 13.4
110.1 ± 12.3
71.0 ± 7.8
1.4 ± 0.8
1.2 ± 0.4
1.0 ± 0.4
1.334
−4.360
−0.0733
−0.0556
−1.850
−1.039
0.193
0.000 ***
0.470
0.583
0.075
0.308
2.24
−5.31
−0.93
−5.41
−11.76
−6.60
Abbreviations: HR, heart rate; SBP, systolic blood pressure; DBP, diastolic blood pressure; RFa, respiratory frequency area (parasympathetic
nervous system activity measure); LFa, low frequency area (sympathetic nervous system activity measure); LFa/RFa (measure of
sympathovagal balance). Note: *p < 0.05, **p < 0.01, ***p < 0.001.
Table 6. Comparisons of physiological response changes among the three programs.
Physiological
Changes
Group
Mean ± SD
Change (%)
F
p
ηp2
Post-hoc
HR (bpm)
C
M
G
SBP (mmHg)
C
M
G
DBP (mmHg)
C
M
G
RFa (bpm2)
C
M
G
LFa (bpm2)
C
M
G
LFa/RFa
C
M
G
1.24 ± 7.11
4.12 ± 6.93
1.67 ± 6.66
−4.64 ± 8.47
−3.974 ± 8.05
−61.81 ± 7.50
−2.321 ± 5.96
−2.24 ± 5.15
−0.68 ± 4.90
0.29 ± 0.73
−0.16 ± 0.68
−0.08 ± 0.73
0.19 ± 0.44
−0.10 ± 0.60
−0.16 ± 0.46
−0.07 ± 0.45
0.04 ± 0.57
0.07 ± 0.47
1.73
5.12
2.24
−3.78
−3.04
−5.31
−3.09
−2.70
−0.93
21.13
−10.76
−5.41
15.45
−6.87
−11.76
−6.93
4.12
−6.60
1.527
0.594
0.852
3.102
3.552
0.527
0.223
0.555
0.430
0.050
0.033 *
0.592
0.035
0.014
0.020
0.070
0.079
0.013
C>G
Abbreviations: HR, heart rate; SBP, systolic blood pressure; DBP, diastolic blood pressure; RFa, respiratory frequency area (parasympathetic
nervous system activity measure); LFa, low frequency area (sympathetic nervous system activity measure); LFa / RFa (measure of
sympathovagal balance). Note: * p < 0.05.

Int. J. Environ. Res. Public Health 2021, 18, 10076
10 of 17
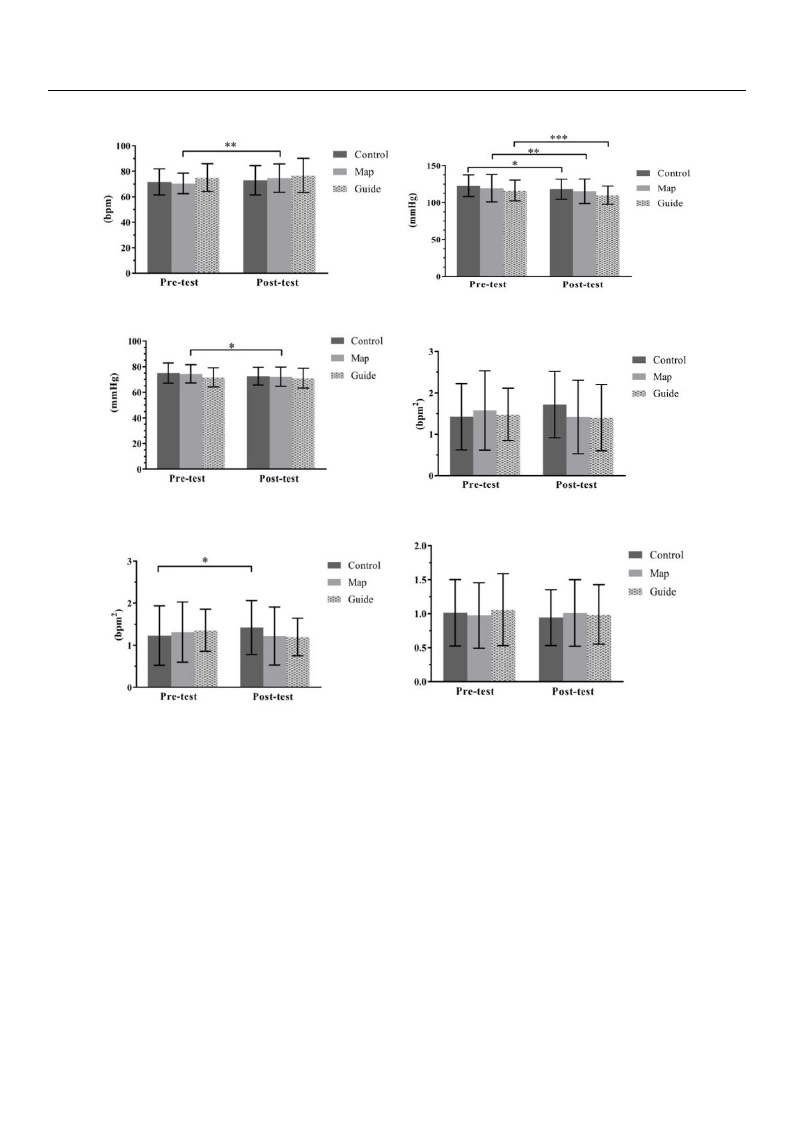
The pre-and-post measures of physiological responses are displayed in Figure 3. Re-
garding the heart rate (HR) of participants, the self-guided (M) group exhibited significantly
higher posttest HRs than pretest HRs (t = 3.413, p = 0.002). The changes observed in each
group were 1.73% in the walk (C) group, 5.12% in the self-guided (M) group, and 2.24%
in the guided (G) group. The differences in HR change were not significant among these
groups (F = 1.527, p = 0.223, ηp2 = 0.035). The posttest systolic blood pressure (SBP) scores
for all groups were significantly lower than the pretest SBP scores: t = −2.741 (p = 0.011),
t = −2.832 (p = 0.008), and t = −4.360 (p < 0.001) in the C, M, and G groups, respectively;
the changes were −3.78%, −3.04%, and −5.31% in the C, M, and G groups, respectively.
The changes in SBP among the three groups were not significant (F = 0.594, p = 0.555,
ηp2 = 0.014). For diastolic blood pressure (DBP), the M group exhibited a significant de-
crease (t = −2.502, p = 0.018). The changes in DBP value were −3.09%, −2.70%, and −0.93%
in the C, M, and G groups, respectively. The decreases were not statistically significant
among the three groups (F = 0.852, p = 0.430, ηp2 = 0.020). An increase in RFa value was
observed in the C group, while decreases were exhibited in both the M and G groups;
however, comparisons of pretest and posttest values in RFa were not significant in all of the
groups. The changes in RFa were 21.13%, −10.76%, and −5.41% in the C, M, and G groups,
respectively. There was no significant difference in the changes among the three groups
(F = 3.102, p = 0.05, ηp2 = 0.070). A significant increase was observed in the C group’s
posttest LFa (t = 2.184, p = 0.039). The changes in LFa were 15.45%, −6.87%, and −11.76%
in the C, M, and G groups, respectively. Significant differences of change in LFa were found
among the three groups (F = 3.552, p = 0.033, ηp2 = 0.079), and the post hoc results revealed
that the change in LFa of the C group was significantly higher than the difference in the G
group. No group exhibited any significant pretest–posttest difference in autonomic balance
(LFa/RFa), and the changes between groups were not significantly different (F = 0.527,
p = 0.592, ηp2 = 0.013).
3.3. Influence of Programs on Psychological Response
The paired-sample t-test results of emotional states are presented in Table 7. The
differences between pretest and posttest were significant in all psychological responses
except for a nonsignificant vigor–activity increase in the C group. The differences in mood
state change scores among the three programs using one-way ANOVA and the changes are
listed in Table 8. There were no observed differences among the three programs.
Int. J. Environ. Res. Public Health 2021, 18, 10076
η
−
−
η
11 of 17
(a) HR
(c) DBP
(b) SBP
(d) RFa
(e) LFa
(f) LFa/RFa
Figure 3. Pretest–posttest comparisons of physiological measures across the three groups. Abbreviations: (a) HR, heart rate;
(b) SBP, systolic blood pressure; (c) DBP, diastolic blood pressure; (d) RFa, respiratory frequency area (parasympathetic
nervous system activity measure); (e) LFa, low frequency area (sympathetic nervous system activity measure); (f) LFa/RFa
(measure of sympathovagal balance). Note: Error bars depict standard deviation. *p < 0.05, ** p < 0.01, *** p < 0.001.
−
−
−
−
−
−
−
−
−
−
−
−

Int. J. Environ. Res. Public Health 2021, 18, 10076
12 of 17
Table 7. Paired-sample t-test results of psychological responses in the three programs.
Group C
Pre
Post
t
p
Change (%)
T–A
D–D
A–H
C–B
F–I
V–A
Group M
T–A
D–D
A–H
C–B
F–I
V–A
Group G
T–A
D–D
A–H
C–B
F–I
V–A
4.2 ± 5.2
4.3 ± 6.9
3.6 ± 6.1
4.4 ± 4.0
5.9 ± 5.0
15.4 ± 4.8
Pre
6.5 ± 5.9
6.2 ± 6.4
4.7 ± 5.4
6.4 ± 4.5
6.6 ± 5.4
13.3 ± 5.0
Pre
6.9 ± 6.1
6.0 ± 6.4
4.3 ± 5.0
6.8 ± 4.6
7.5 ± 5.2
12.8 ± 4.5
1.38 ± 2.66
1.27 ± 3.21
1.68 ± 2.75
1.78 ± 2.25
4.14 ± 4.32
15.62 ± 4.76
Post
3.15 ± 3.46
2.06 ± 3.35
2.44 ± 2.45
2.62 ± 2.70
4.44 ± 3.03
15.09 ± 4.59
Post
1.9 ± 2.9
1.9 ± 3.2
2.0 ± 1.9
2.3 ± 2.6
5.1 ± 3.9
15.1 ± 4.2
−3.796
−3.277
−2.054
−4.401
−2.286
0.310
−4.307
−5.409
−3.088
−6.760
−2.421
2.180
−5.549
−5.079
−2.982
−6.576
−2.698
2.444
0.001 **
0.002 **
0.047 *
0.000 ***
0.028 *
0.758
0.000 ***
0.000 ***
0.004 **
0.000 ***
0.021 *
0.036 *
0.000 ***
0.000 ***
0.006 **
0.000 ***
0.012 *
0.021 *
−66.83
−70.26
−52.94
−59.64
−29.71
1.76
−51.76
−66.99
−45.41
−59.32
−32.63
13.80
−71.99
−68.29
−54.31
−65.63
−31.87
18.10
Abbreviations: T–A, tension–anxiety; D–D, depression–dejection; A–H, anger–hostility; C–B, confusion–
bewilderment; F–I, fatigue–inertia; V–A, vigor–activity. Note: * p < 0.05, ** p < 0.01, *** p < 0.001.
Table 8. Differences of mood state change scores among the three programs.
PChhyasnigoelosgicalGroup
Mean ± SD Change (%)
F
p
ηp2
Post
Hoc
∆T–A
C
−2.78 ± 4.46
−66.83
1.869 0.160 0.037
M
−3.38 ± 4.58
−51.76
G
−4.96 ± 4.73
−71.99
∆D–D
C
−3.00 ± 5.57
−70.26
0.628 0.536 0.013
M
−4.18 ± 4.50
−66.99
G
−4.07 ± 4.24
−68.29
∆A–H
C
−2.321 ± 5.96
−52.94
0.087 0.917 0.002
M
−2.24 ± 5.15
−45.41
G
−0.68 ± 4.90
−54.31
∆C–B
C
−2.62 ± 3.62
−59.64
2.290 0.107 0.046
M
−3.82 ± 3.30
−59.32
G
−4.43 ± 3.56
−65.63
∆F–I
C
−1.76 ± 4.67
−29.71
0.143 0.867 0.003
M
−2.15 ± 5.17
−32.63
G
−2.39 ± 4.69
−31.87
∆V–A
C
0.27 ± 5.31
1.76
1.491 0.230 0.030
M
1.82 ± 4.88
13.80
G
2.32 ± 5.03
18.10
Abbreviations: T–A, tension–anxiety; D–D, depression–dejection; A–H, anger–hostility; C–B, confusion–
bewilderment; F–I, fatigue–inertia; V–A, vigor–activity.
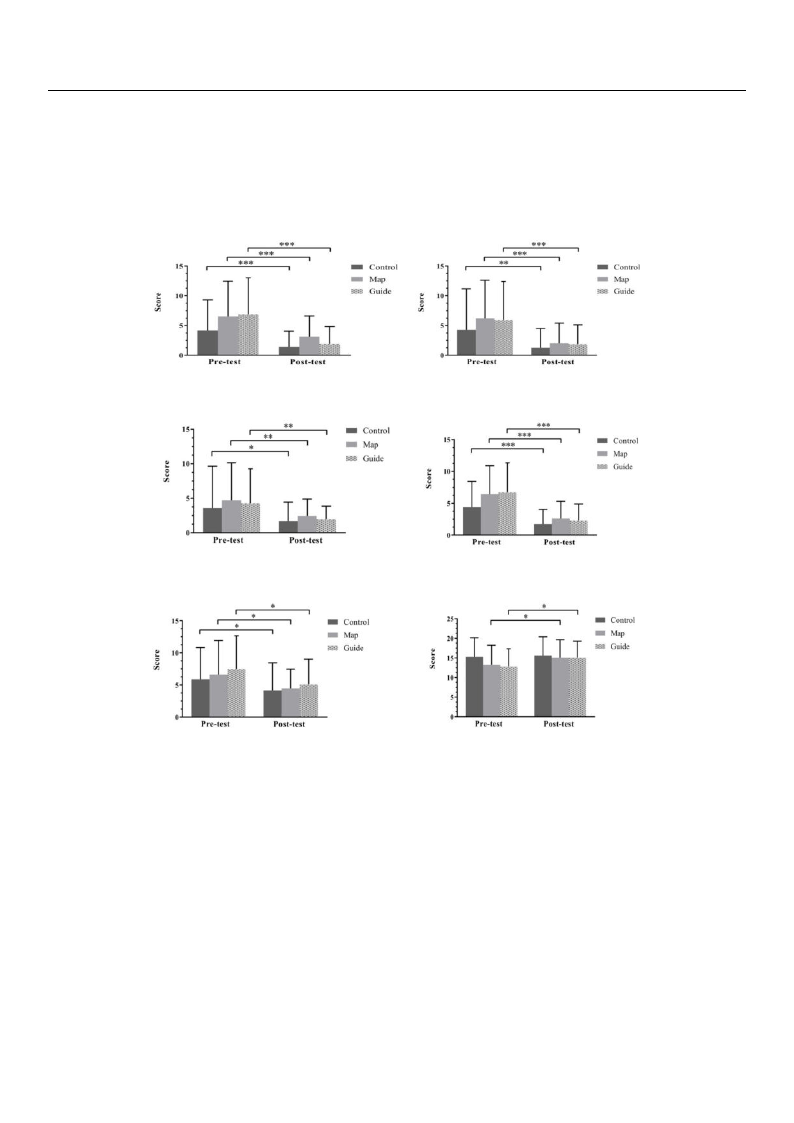
The pre-and-post measures for each domain of POMS are displayed in Figure 4. In
general, participants’ moods improved substantially and consistently across the different
domains. Specifically, the mean tension–anxiety scores after the forest therapy decreased
significantly by 66.83%, 51.76%, and 71.99% in the C, M, and G groups, respectively.
Similarly, the mean depression–dejection scores decreased by 70.26%, 69.99%, and 68.29%,
the mean anger–hostility scores decreased by 52.94%, 45.41%, and 54.31%, the mean
confusion–bewilderment scores decreased by 59.64%, 59.32%, and 65.63%, and the mean
fatigue–inertia scores decreased by 29.71%, 32.63%, and 31.87% in the C, M, and G groups,
respectively. In addition, the mean vigor–activity score increases were significant in the
Int. J. Environ. Res. Public Health 2021, 18, 10076
13 of 17
M and G groups (with 13.8% and 18.1% increases in the M and G groups, respectively),
but not significant in the C group (with 1.76% increase). The G group exhibited the largest
improvement in tension–anxiety (−71.99%), anger–hostility (−54.31%), and confusion–
bewilderment (−65.63%) for negative emotions and the largest enhancement in vigor–
activity (18.10%) for positive emotions.
(a) T–A
(b) D–D
(c) A–H
(d) C–B
(e) F–I
(f) V–A
Figure 4. Pretest–posttest comparisons of psychological measures across the three groups. Abbreviations: (a) T–A, tension–
anxiety; (b) D–D, depression–dejection; (c) A–H, anger–hostility; (d) C–B, confusion–bewilderment; (e) F–I, fatigue–inertia;
(f) V–A, vigor–activity. Note: * p < 0.05, ** p < 0.01, *** p < 0.001.
4. Discussion
4.1. Influences of the Three Forest Therapy Programs on Physiological Responses
Comparisons between pretest and posttest physiological measurements revealed
differences in the restorative outcomes of the three study groups. Physiologically, the C
group exhibited a significant SBP decrease and a significant increase in SNS activity, the M
group exhibited a significant increase in HR values and significant decreases in SBP and
DBP, and the G group exhibited a significant decrease in SBP. The significant SBP decrease in
all three groups is consistent with the findings of previous studies (e.g., [31]) that indicate
the benefit of these experiences to systolic blood pressure functions. Concerning the
significant increase in SNS activity in the C group and the significant increase in HR in the
M group, one possible explanation is that walking distance and speed influenced the results.
Specifically, the forest therapy program combines immersion in a forest environment and

Int. J. Environ. Res. Public Health 2021, 18, 10076
14 of 17
walking. Immersion is expected to result in relaxation, which will suppress sympathetic
nervous activity, activate parasympathetic nervous activity, and reduce HR. However,
physical exercise (i.e., walking and hiking) required energy expenditure of the participants
and may have boosted both sympathetic nervous activity and HR. The study did not
control participants’ walking speeds in the M group; thus we speculate the increase of
HR may be because they took a fast-paced walk during the experiment. In the C group,
participants walked as they desired in the forest; so, if they chose to walk a long distance or
to walk up a steep hill during the program, this would increase their sympathetic nervous
activity.
4.2. Influences of the Three Forest Therapy Programs on Psychological Responses
Aside from a nonsignificant vigor–activity increase in the C group, all groups exhibited
significant changes in each variable of the emotional aspect. In general, the three forest
therapy programs had positive effects on improving mood states. The improvement of
mood state changes across the three groups is consistent with the general view in prior
studies that immersion in a forest contributes to improved mental health [7,11,16–21].
Concerning the nonsignificant vigor–activity increase in the C group, we found a relatively
high pretest mean score in the C group (mean = 15.4) compared to the M and G groups
(13.3 and 12.8 in the M and G groups, respectively). However, Levene’s homogeneity
test revealed the variance for the pretest vigor–activity score was equal across groups
(p = 0.468).
4.3. Comparisons of Changes in Physiological Responses and Mood States among the
Three Programs
The three programs in the study—walk alone (the C group), self-guided (the M group),
and guided (the G group)—did not exhibit significant differences in changes of restorative
benefits in physiological and psychological measures except for a significant difference
in changes in sympathetic nervous activity (LFa) between the C group and G group.
From a theoretical perspective, a guided forest therapy program could potentially promote
restoration by nurturing a feeling of safety [36–38]. Staats and Hartig [37] indicated a feeling
of safety influences restorative effects. In our study, we found no significant differences for
most pre–post physiological changes (i.e., SBP, DBP, HR, RFa, and LFa/RFa) and changes of
emotional responses across the three programs. Based on the results, we postulate that this
may be because XNEA is a popular and well-organized forest recreation destination, which
promotes feelings of security and comfort to all visitors. Therefore, the guided program
simply may not be able to have a significant impact on feelings of security and safety,
explaining the lack of significant differences in restorative effects. If that was the case, the
variations in feelings of security and safety among the three programs would have been
similar, and that may have resulted in the nonsignificant results for the between-group
comparisons.
The changes in sympathetic nervous system (SNS) activity in the C group were
significantly higher than the differences in the G group. For the C group, we speculate this
increase in sympathetic nervous activity may be because participants engaged in more
strenuous walking, either by walking a longer distance, walking at a faster speed, or hiking
on a more highly graded route, each of which could potentially induce higher levels of
sympathetic nervous system activity. The guided forest therapy program set the walking
speed of participants at 2 km/h and provided an enjoyable and immersive experience in
the forest via instructions for multisensory experiences that helped participants to relax,
which reduced their level of sympathetic nervous activity.
Although the three programs in the study did not exhibit significant differences
in changes of restorative benefits in psychological measures, our analysis revealed that
the guided group exhibited the most improvement in tension–anxiety (−71.99%), anger–
hostility (−54.31%), and confusion–bewilderment (−65.63%), as well as the greatest in-
crease in vigor–activity (18.10%). Therefore, it showed the guided forest therapy program
performs better on mitigating negative emotions and improved positive moods.

Int. J. Environ. Res. Public Health 2021, 18, 10076
15 of 17
We compared three forest therapy program types and found the restorative benefits
of forest therapy in XNEA are apparent, regardless of the program type, particularly
concerning mental health; the management team should continue promoting forest therapy
for public health by providing different types of forest therapy programs and experiences.
4.4. Limitations of the Study and Future Research
Our study has a few limitations. First, we did not measure participants’ feelings of
safety in the study. Since feelings of safety can potentially serve an important factor in
explaining restorative effects, this variable should have been included to better understand
its moderating effect on the restorative effects of the three programs. We suggest future
forest therapy research add measures of feelings of safety or risk. Second, we did not
control for the intensity of the exercise, which is a factor that may have influenced the
physiological outcomes. Considering intensity of walk influences positive effects and
happiness [52]; future studies should consider intensity of exercise (i.e., walking speed and
degree of energy expenditure) in forest therapy program research. Moreover, the type of
physical activity may affect the restorative effects, and that should be further explored; for
example, forest yoga and Nordic walking are two activities that could be included in guided
forest therapy programs, but the physiological and psychological responses resulting
from the two activities may drastically differ. Third, environmental conditions such as
illumination, humidity, and temperature, together with forest landscapes, potentially
influence restorative effects. These and their associations are worth investigating in future
studies.
5. Conclusions
Our study revealed that the walk alone group exhibited a significant SBP decrease and
a significant increase in SNS activity, the self-guided group exhibited a significant increase
in HR values and significant decreases in SBP and DBP, and the guided group showed a
significant decrease in SBP. Further, the three forest therapy programs had positive effects
on improving mood states, except a nonsignificant vigor–activity increase in the walk alone
group. The three programs did not exhibit significant differences in changes of restorative
benefits in physiological and psychological measures except for a significant difference
in changes in sympathetic nervous activity between the walk alone group and guided
group, which showed the guided program performed better in mitigating the sympathetic
nervous system activity of participants.
Author Contributions: Conceptualization, C.-P.Y. and H.-T.C.; methodology, C.-P.Y. and H.-T.C.;
software, H.-T.C. and J.Y.; validation, P.-H.C. and J.Y.; formal analysis, H.-T.C. and J.Y.; investigation,
H.-T.C.; data curation, H.-T.C., P.-H.C. and J.Y.; writing—original draft preparation, C.-P.Y. and H.-
T.C.; writing—review and editing, P.-H.C., J.Y. and M.-J.T.; visualization, H.-T.C. and J.Y.; supervision,
C.-P.Y. and M.-J.T.; project administration, C.-P.Y., P.-H.C. and M.-J.T.; funding acquisition, C.-P.Y. and
M.-J.T. All authors have read and agreed to the published version of the manuscript.
Funding: This research was funded by the Ministry of Science and Technology of Taiwan (MOST
108-2410-H-002-185) and the Experiment Forest, National Taiwan University.
Institutional Review Board Statement: The study was approved by the Research Ethics Office of
National Taiwan University (NTU-REC No. 201607HS008).
Informed Consent Statement: Informed consent was obtained from all subjects involved in the
study.
Data Availability Statement: The data are available upon request from the corresponding author.
Acknowledgments: Authors express gratitude for all the help from the Xitou Nature Education Area
(XNEA) staff.
Conflicts of Interest: The authors declare no conflict of interest.

Int. J. Environ. Res. Public Health 2021, 18, 10076
16 of 17
References
1. Antonelli, M.; Barbieri, G.; Donelli, D. Effects of forest bathing (shinrin-yoku) on levels of cortisol as a stress biomarker: A
systematic review and meta-analysis. Int. J. Biometeorol. 2019, 63, 1117–1134. [CrossRef]
2. Kotera, Y.; Richardson, M.; Sheffield, D. Effects of Shinrin-Yoku (Forest Bathing) and Nature Therapy on Mental Health: A
Systematic Review and Meta-analysis. Int. J. Ment. Health Addict. 2020. [CrossRef]
3. Ideno, Y.; Hayashi, K.; Abe, Y.; Ueda, K.; Iso, H.; Noda, M.; Lee, J.-S.; Suzuki, S. Blood pressure-lowering effect of Shinrin-yoku
(Forest bathing): A systematic review and meta-analysis. BMC Complement. Altern. Med. 2017, 17, 409. [CrossRef]
4. Ewert, A.; Chang, Y. Levels of Nature and Stress Response. Behav. Sci. 2018, 8, 49. [CrossRef]
5. Mao, G.-X.; Cao, Y.-B.; Lan, X.-G.; He, Z.-H.; Chen, Z.-M.; Wang, Y.-Z.; Hu, X.-L.; Lv, Y.-D.; Wang, G.-F.; Yan, J. Therapeutic effect
of forest bathing on human hypertension in the elderly. J. Cardiol. 2012, 60, 495–502. [CrossRef] [PubMed]
6. Kondo, M.C.; Jacoby, S.F.; South, E.C. Does spending time outdoors reduce stress? A review of real-time stress response to
outdoor environments. Health Place 2018, 51, 136–150. [CrossRef] [PubMed]
7. Ochiai, H.; Ikei, H.; Song, C.; Kobayashi, M.; Miura, T.; Kagawa, T.; Li, Q.; Kumeda, S.; Imai, M.; Miyazaki, Y. Physiological
and Psychological Effects of a Forest Therapy Program on Middle-Aged Females. Int. J. Environ. Res. Public Health 2015, 12,
15222–15232. [CrossRef] [PubMed]
8. Song, C.; Ikei, H.; Kobayashi, M.; Miura, T.; Taue, M.; Kagawa, T.; Li, Q.; Kumeda, S.; Imai, M.; Miyazaki, Y. Effect of Forest
Walking on Autonomic Nervous System Activity in Middle-Aged Hypertensive Individuals: A Pilot Study. Int. J. Environ. Res.
Public Health 2015, 12, 2687–2699. [CrossRef] [PubMed]
9. Miyazaki, Y.; Song, C.; Ikei, H. Preventive medical effects of nature therapy and their individual differences. Jpn. J. Physiol.
Anthropol. 2015, 20, 19–32.
10. Park, B.J.; Tsunetsugu, Y.; Kasetani, T.; Hirano, H.; Kagawa, T.; Sato, M.; Miyazaki, Y. Physiological effects of Shinrin-yoku
(taking in the atmosphere of the forest)—Using salivary cortisol and cerebral activity as indicators. J. Physiol. Anthropol. 2007, 26.
[CrossRef]
11. Ochiai, H.; Ikei, H.; Song, C.; Kobayashi, M.; Takamatsu, A.; Miura, T.; Kagawa, T.; Li, Q.; Kumeda, S.; Imai, M.; et al. Physiological
and psychological effects of forest therapy on middle-aged males with high-normal blood pressure. Int. J. Environ. Res. Public
Health 2015, 12, 2532–2542. [CrossRef]
12. Jung, W.H.; Woo, J.M.; Ryu, J.S. Effect of a forest therapy program and the forest environment on female workers’ stress. Urban
For. Urban Green. 2015, 14, 274–281. [CrossRef]
13. Yu, C.-P.; Hsieh, H. Beyond restorative benefits: Evaluating the effect of forest therapy on creativity. Urban For. Urban Green. 2020,
51, 126670. [CrossRef]
14. Lee, J.; Li, Q.; Tyrvinen, L.; Tsunetsugu, Y.; Park, B.-J.; Kagawa, T.; Miyazaki, Y. Nature Therapy and Preventive Medicine. In
Public Health—Social and Behavioral Health; InTech Open Ltd.: London, UK, 2012.
15. Crnic, M.; Kondo, M.C. Nature RX: Reemergence of pediatric nature-based therapeutic programs from the late 19th and early
20th centuries. Am. J. Public Health 2019, 109, 1371–1378. [CrossRef]
16. Lee, J.; Park, B.-J.; Tsunetsugu, Y.; Kagawa, T.; Miyazaki, Y. Restorative effects of viewing real forest landscapes, based on a
comparison with urban landscapes. Scand. J. For. Res. 2009, 24, 227–234. [CrossRef]
17. Morita, E.; Fukuda, S.; Nagano, J.; Hamajima, N.; Yamamoto, H.; Iwai, Y.; Nakashima, T.; Ohira, H.; Shirakawa, T. Psychological
effects of forest environments on healthy adults: Shinrin-yoku (forest-air bathing, walking) as a possible method of stress
reduction. Public Health 2007, 121, 54–63. [CrossRef] [PubMed]
18. Lee, J.; Park, B.J.; Tsunetsugu, Y.; Ohira, T.; Kagawa, T.; Miyazaki, Y. Effect of forest bathing on physiological and psychological
responses in young Japanese male subjects. Public Health 2011, 125, 93–100. [CrossRef] [PubMed]
19. Lee, J.; Tsunetsugu, Y.; Takayama, N.; Park, B.J.; Li, Q.; Song, C.; Komatsu, M.; Ikei, H.; Tyrväinen, L.; Kagawa, T.; et al. Influence
of forest therapy on cardiovascular relaxation in young adults. Evid. Based Complement. Altern. Med. 2014, 2014, 7. [CrossRef]
[PubMed]
20. Park, B.-J.; Furuya, K.; Kasetani, T.; Takayama, N.; Kagawa, T.; Miyazaki, Y. Relationship between psychological responses and
physical environments in forest settings. Landsc. Urban Plan. 2011, 102, 24–32. [CrossRef]
21. Takayama, N.; Korpela, K.; Lee, J.; Morikawa, T.; Tsunetsugu, Y.; Park, B.-J.; Li, Q.; Tyrväinen, L.; Miyazaki, Y.; Kagawa, T.
Emotional, Restorative and Vitalizing Effects of Forest and Urban Environments at Four Sites in Japan. Int. J. Environ. Res. Public
Health 2014, 11, 7207–7230. [CrossRef] [PubMed]
22. Park, B.-J.; Tsunetsugu, Y.; Kasetani, T.; Morikawa, T.; Kagawa, T.; Miyazaki, Y. Physiological effects of forest recreation in a
young conifer forest in Hinokage Town, Japan. Silva Fenn. 2009, 43, 291–301. [CrossRef]
23. Park, B.-J.; Tsunetsugu, Y.; Kasetani, T.; Kagawa, T.; Miyazaki, Y. The physiological effects of Shinrin-yoku (taking in the forest
atmosphere or forest bathing): Evidence from field experiments in 24 forests across Japan. Environ. Health Prev. Med. 2010, 15,
18–26. [CrossRef] [PubMed]
24. Song, C.; Ikei, H.; Miyazaki, Y. Sustained effects of a forest therapy program on the blood pressure of office workers. Urban For.
Urban Green. 2017, 27, 246–252. [CrossRef]
25. Tsunetsugu, Y.; Park, B.-J.; Ishii, H.; Hirano, H.; Kagawa, T.; Miyazaki, Y. Physiological Effects of Shinrin-yoku (Taking in the
Atmosphere of the Forest) in an Old-Growth Broadleaf Forest in Yamagata Prefecture, Japan. J. Physiol. Anthropol. 2007, 26,
135–142. [CrossRef] [PubMed]

Int. J. Environ. Res. Public Health 2021, 18, 10076
17 of 17
26. Tsunetsugu, Y.; Lee, J.; Park, B.J.; Tyrväinen, L.; Kagawa, T.; Miyazaki, Y. Physiological and psychological effects of viewing urban
forest landscapes assessed by multiple measurements. Landsc. Urban Plan. 2013, 113, 90–93. [CrossRef]
27. Park, B.-J.; Tsunetsugu, Y.; Ishii, H.; Furuhashi, S.; Hirano, H.; Kagawa, T.; Miyazaki, Y. Physiological effects of Shinrin-yoku
(taking in the atmosphere of the forest) in a mixed forest in Shinano Town, Japan. Scand. J. For. Res. 2008, 23, 278–283. [CrossRef]
28. Li, Q.; Morimoto, K.; Nakadai, A.; Inagaki, H.; Katsumata, M.; Shimizu, T.; Hirata, Y.; Hirata, K.; Suzuki, H.; Miyazaki, Y.; et al.
Forest bathing enhances human natural killer activity and expression of anti-cancer proteins. Int. J. Immunopathol. Pharmacol.
2007, 20, 3–8. [CrossRef] [PubMed]
29. Li, Q.; Morimoto, K.; Kobayashi, M.; Inagaki, H.; Katsumata, M.; Hirata, Y.; Hirata, K.; Suzuki, H.; Li, Y.J.; Wakayama, Y.; et al.
Visiting a forest, but not a city, increases human natural killer activity and expression of anti-cancer proteins. Int. J. Immunopathol.
Pharmacol. 2008, 21, 117–127. [CrossRef] [PubMed]
30. Li, Q.; Morimoto, K.; Kobayashi, M.; Inagaki, H.; Katsumata, M.; Hirata, Y.; Hirata, K.; Shimizu, T.; Li, Y.J.; Wakayama, Y.; et al. A
forest bathing trip increases human natural killer activity and expression of anti-cancer proteins in female subjects. J. Biol. Regul.
Homeost. Agents 2008, 22, 45–55. [PubMed]
31. Yu, C.-P.; Lin, C.-M.; Tsai, M.-J.; Tsai, Y.-C.; Chen, C.-Y. Effects of Short Forest Bathing Program on Autonomic Nervous System
Activity and Mood States in Middle-Aged and Elderly Individuals. Int. J. Environ. Res. Public Health 2017, 14, 897. [CrossRef]
32. Beil, K.; Hanes, D. The Influence of Urban Natural and Built Environments on Physiological and Psychological Measures of
Stress—A Pilot Study. Int. J. Environ. Res. Public Health 2013, 10, 1250–1267. [CrossRef]
33. Komori, T.; Mitsui, M.; Togashi, K.; Matsui, J.; Kato, T.; Uei, D.; Shibayama, A.; Yamato, K.; Okumura, H.; Kinoshita, F. Relaxation
Effect of a 2-Hour Walk in Kumano-Kodo Forest. J. Neurol. Neurosci. 2017, 8, 1. [CrossRef]
34. Chen, H.-T.; Yu, C.-P.; Lee, H.-Y. The Effects of Forest Bathing on Stress Recovery: Evidence from Middle-Aged Females of Taiwan.
Forests 2018, 9, 403. [CrossRef]
35. Meyer, K.; Bürger-Arndt, R. How Forests Foster Human Health—Present State of Research-Based Knowledge (in the Field of
Forests and Human Health). Int. For. Rev. 2014, 16, 421–446. [CrossRef]
36. Igawahara, K.; Kagawa, T.; Takayama, N.; Park, B. Research on the Effect which a Guide Brings about in a Forest Walk. J. Jpn. Inst.
Landsc. Archit. 2007, 70, 597–600. [CrossRef]
37. Staats, H.; Hartig, T. Alone or with a friend: A social context for psychological restoration and environmental preferences. J.
Environ. Psychol. 2004, 24, 199–211. [CrossRef]
38. Kaplan, S.; Kaplan, R. Cognition and Environment: Functioning in an Uncertain World; Kaplan, R., Ed.; Praeger: New York, NY, USA,
1982.
39. Reis, H.T.; O’Keefe, S.D.; Lane, R.D. Fun Is More Fun When Others Are Involved. J. Posit. Psychol. 2017, 12, 547–557. [CrossRef]
40. Kaplan, S. The restorative benefits of nature: Toward an integrative framework. J. Environ. Psychol. 1995, 15, 169–182. [CrossRef]
41. College of Bio-Resources and Agriculture, National Taiwan University. The Experimental Forest; Lee, C.J., Wei Chiang, Y.-J.J., Eds.;
College of Bio-Resources and Agriculture, National Taiwan University: Taipei, Taiwan, 2018.
42. Tsai, M.J.; Yang, C.K.; Wu, T.Y.; Chen, W.L.; Lin, L.C. The healing forest—The new mission of the NTU Experimental Forest. For.
Res. Newsl. 2016, 23, 16–19.
43. Malliani, A.; Pagani, M.; Montano, N.; Mela, G.S. Sympathovagal balance: A reappraisal. Circulation 1998, 98, 2640–2643.
[CrossRef]
44. Akselrod, S.; Gordon, D.; Ubel, F.A.; Shannon, D.C.; Barger, A.C.; Cohen, R.J. Power spectrum analysis of heart rate fluctuation: A
quantitative probe of beat-to-beat cardiovascular control. Science 1981, 213, 220–222. [CrossRef]
45. Aysin, B.; Aysin, E. Effect of respiration in heart rate variability (HRV) analysis. In Proceedings of the 28th Annual International
Conference of the IEEE Engineering in Medicine and Biology, New York, NY, USA, 30 August–3 September 2006; pp. 1776–1779.
46. Colombo, J.; Arora, R.; DePace, N.L.; Vinik, A.I. Clinical Autonomic Dysfunction: Measurement, Indications, Therapies, and Outcomes;
Springer International Publishing: New York, NY, USA, 2014; ISBN 9783319073712.
47. Goldstein, D.S.; Bentho, O.; Park, M.-Y.; Sharabi, Y. Low-frequency power of heart rate variability is not a measure of cardiac
sympathetic tone but may be a measure of modulation of cardiac autonomic outflows by baroreflexes. Exp. Physiol. 2011, 96,
1255–1261. [CrossRef]
48. Appelhans, B.M.; Luecken, L.J. Heart rate variability and pain: Associations of two interrelated homeostatic processes. Biol.
Psychol. 2008, 77, 174–182. [CrossRef] [PubMed]
49. Colombo, J.; Shoemaker, W.C.; Belzberg, H.; Hatzakis, G.; Fathizadeh, P.; Demetriades, D. Noninvasive Monitoring of the
Autonomic Nervous System and Hemodynamics of Patients With Blunt and Penetrating Trauma. J. Trauma Inj. Infect. Crit. Care
2008, 65, 1364–1373. [CrossRef] [PubMed]
50. Shacham, S. A Shortened Version of the Profile of Mood States. J. Pers. Assess. 1983, 47, 305–306. [CrossRef] [PubMed]
51. Dimitrov, D.M.; Rumrill, P.D. Pretest-Posttest Designs and Measurement of Change; IOS Press: Amsterdam, The Netherlands, 2003;
Volume 20.
52. Marselle, M.R.; Irvine, K.N.; Lorenzo-Arribas, A.; Warber, S.L. Does perceived restorativeness mediate the effects of perceived
biodiversity and perceived naturalness on emotional well-being following group walks in nature? J. Environ. Psychol. 2016, 46,
217–232. [CrossRef]