

Journal of Business Ethics (2022) 178:571–595
https://doi.org/10.1007/s10551-021-04800-9
ORIGINAL PAPER
Corporate Accountability Towards Species Extinction Protection:
Insights from Ecologically Forward‑Thinking Companies
Lee Roberts1 · Monomita Nandy1 · Abeer Hassan2 · Suman Lodh3 · Ahmed A. Elamer1
Received: 8 September 2020 / Accepted: 18 March 2021 / Published online: 10 April 2021
© The Author(s) 2021
Abstract
This paper contributes to biodiversity and species extinction literature by examining the relationship between corporate
accountability in terms of species protection and factors affecting such accountability from forward-thinking companies.
We use triangulation of theories, namely deep ecology, legitimacy, and we introduce a new perspective to the stakeholder
theory that considers species as a ‘stakeholder’. Using Poisson pseudo-maximum likelihood (PPML) regression, we examine a
sample of 200 Fortune Global companies over 3 years. Our results indicate significant positive relations between ecologically
conscious companies that are accountable for the protection of biodiversity and species extinction and external assurance,
environmental performance, partnerships with socially responsible organizations and awards for sustainable activities. Our
empirical results appear to be robust in controlling for possible endogeneities. Our findings contribute to the discussion on
the concern of species loss and habitat destruction in the context of corporate accountability, especially in responding to
the sixth mass extinction event and COVID-19 crisis. Our results can also guide the policymakers and stakeholders of the
financial market in better decision making.
Keywords Biodiversity · Species extinction · Deep ecology · Legitimacy · Poisson pseudo-maximum likelihood ·
Stakeholders
Introduction
In recent years, policymakers, NGOs, academics, and com-
panies have devoted greater attention to the strategic impli-
cations of biodiversity loss and species extinction (hereafter
* Monomita Nandy
monomita.nandy@brunel.ac.uk
Lee Roberts
Lee.Roberts@brunel.ac.uk
Abeer Hassan
abeer.hassan@uws.ac.uk
Suman Lodh
s.lodh@mdx.ac.uk
Ahmed A. Elamer
ahmed.elamer@brunel.ac.uk
1 Brunel University London, Uxbridge UB8 3PH, UK
2 University of the West of Scotland, G226, Gardner Building,
Paisley PA1 2BE, UK
3 Middlesex University, The Burroughs, Hendon,
London NW4 4BT, UK
B/E). Yet, the relationship between corporate accountability1
in terms of species2 protection and factors affecting such
accountability (assurance, environmental performance,
country, partnerships, etc.) remains underexplored in
accounting and business literature (Atkins & Atkins, 2018;
Gaia & Jones, 2019; Reade et al., 2015). Biodiversity and
species extinction are part of wider global environmental
challenges facing humanity (Sobkowiak et al., 2020), with
the United Nations Sustainable Development Goals (SDGs),
specifically SDGs 14 and 153 the most recent call to action
1 In this paper, we refer to accountability as companies’ disclosure
on how to protect species to eliminate biodiversity loss in the future.
2 We identify species as the variety of plants (flora) and animals
(fauna) that provide balanced ecosystems essential for human survival
and welfare (Sandifer et al., 2015).
3 We refer to the United Nations Sustainable Development Goals
(SDGs) 14 ‘Life below water—Conserve and sustainably use the
oceans, seas and marine resources for sustainable development’ and
SDG 15 ‘Life on Land—Protect, restore and promote sustainable use
of terrestrial ecosystems, sustainably manage forests, combat desertifi-
cation and halt and reverse land degradation and halt biodiversity loss’.
1 3 Vol.:(0123456789)

572
L. Roberts et al.
to develop solutions and protect the planet from further bio-
diversity loss4 (UN, 2020a).
It is acknowledged that business activities are recognized
as one of the main drivers of biodiversity loss and species
extinction (Hassan et al., 2020a; Maroun & Atkins, 2018;
Roberts et al., 2020a). Thus, we contribute to the extant lit-
erature and examine how the accountability of ecologically
conscious/forward-thinking5 (hereafter EC/FT) companies
can prevent further species and biodiversity loss in the future
and align with SDGs 14 and 15. Our motivation for this
paper is to respond to the recent calls to contribute to devel-
oping solutions for the B/E crisis (Gibassier et al., 2020).
This research is significantly timely, as experts suggest that
pandemics such as COVID-19 are a result of habitat loss,
wildlife trafficking, and humanity’s destruction of biodiver-
sity (Ceballos et al., 2020; Johnson et al., 2020). Potentially,
COVID-19 may not be an isolated pandemic; therefore, there
must be a seismic shift from companies in valuing and pro-
tecting nature. In addition, biodiversity loss is now recog-
nized as one of the top five global risks (WEF, 2020)6 with
severe implications for society if transformational changes
are not made (WHO, 2020).
The above discussion motivates us to examine how EC/
FT companies that initiated efforts in conserving and pro-
tecting species before the current pandemic can influence
companies’ reporting in the post-COVID-19 era. Therefore,
we would expect corporates to consciously make tremen-
dous efforts in conserving biodiversity and protecting spe-
cies from extinction as companies realize their dependence
on nature. Thus, our findings can guide and encourage com-
panies to improve future reporting to achieve SDGs 14 and
15 targets by 2030, as “accounting academics can and should
play a substantial role helping embed policy and action at
an organizatinal level in a way that contributes towards the
4 We define biodiversity loss as the decline of the infrastructure of
ecosystems caused by the abuse from human and business overex-
ploitation (Hassan et al., 2020a; Roberts et al., 2020a).
5 We define ecologically conscious or forward-thinking companies as
those companies that realize the importance of biodiversity and spe-
cies extinction and have provided disclosure on how to protect both
biodiversity and species before the COVID-19 crisis. Therefore, we
use ecologically conscious and forward-thinking companies inter-
changeably.
6 The recent Intergovernmental Science-Policy Platform and Ecosys-
tem Services Global Assessment Report (IPBES, 2019) outlines one
million species which are under threat from extinction within dec-
ades if transformational changes are not made. Such species decline
challenges organizational viability as they are dependent on healthy
ecosystems providing natural assets for sustainable economic activity
(European Business and Biodiversity Campaign, 2020). Although no
monetary value can be placed on natural assets (Jones & Solomon,
2013), the value ecosystems provide in resources is estimated to be
between $125 to $145 trillion per year (Costanza et al., 2014), high-
lighting the intrinsic worth of natural resources to businesses.
achievement of the SDGs” (Bebbington & Unerman, 2018,
p. 2). The findings of this study will extend the existing
academic findings on emerging issues about B/E account-
ing (e.g., Adler et al., 2018; Atkins & Maroun, 2018; Has-
san et al., 2020a, b). The combination of the theoretical
framework along with robust empirical findings will assist
academics in advancing this stream of emerging literature,
and help companies to understand how to consider various
factors to be sustainable in the future. Additionally, this
will give a clear indication to regulators about the changes
required to motivate companies for preventing further B/E
loss.
Furthermore, extant B/E literature is limited. Specifically,
most studies employed one theoretical construct to explain
the companies’ accountability towards the extinction of spe-
cies, which contains several caveats. We respond to the pre-
vious call (Gaia & Jones, 2019) that a single theory is not
adequate in explaining B/E disclosure, by adopting a trian-
gulation of deep ecology, legitimacy, and stakeholder theo-
ries. By applying deep ecology and stakeholder concepts, we
support the argument of Roberts et al. (2020b), who suggest
that species are of fundamental value to business survival
and are main stakeholders in society; therefore, companies
should consider species as an important stakeholder of their
business. Legitimacy theory can explain how a company’s
legitimacy can be achieved by considering species as impor-
tant as other stakeholders in company operations. The com-
prehensive theoretical model allows us to contribute to the
limitation of the extant literature theoretically. To date, semi-
nal contributions in literature stimulate the development of
species protection by providing extinction accounting frame-
works (Atkins & Maroun, 2018; Hassan et al., 2020b) and
examination of organizational accountability for biodiversity
(Adler et al., 2018; Maroun et al., 2018). Emerging studies
(e.g., Raar et al., 2020) open a debate on how the incorpora-
tion of biodiversity accountability can assist in the preven-
tion of further species loss. Flowing from extant literature,
this paper builds on these bodies of work to empirically
examine company disclosure on species and what factors
motivate relationships for such disclosure. This research
responds to Roberts et al. (2020b) who identify the urgency
in B/E literature for the examination of species protection
disclosure to extend knowledge in the field and contribute
to advancing solutions.
Based on the above discussion, the objective of this paper
is to investigate factors affecting the relationship between cor-
porate accountability and species protection of EC/FT compa-
nies. We believe that providing disclosure on species protec-
tion enhances stakeholders’ trust and accountability (Hassan
et al., 2020b). To empirically test our idea, this study uses a
sample of the top 200 companies from Fortune Global in 2012,
2014, and 2016, to highlight how EC/FT companies reported
on the protection of species before the recent pandemic and
13

Corporate Accountability Towards Species Extinction Protection: Insights from Ecologically…
573
provide a springboard to develop solutions after the pandemic.
These companies directly or indirectly make significant use
of ecosystems, and therefore gain the most public attention
(Adler et al., 2018; Hassan et al., 2020b). Our justification is to
present how EC/FT companies report on conserving and pro-
tecting biodiversity and species, which could influence report-
ing in the recent and coming years. By applying advanced
empirical analysis, we find that companies that are disclosing
responsibly about species and are actively protecting against
extinction, for which these companies are recognized by
awards, have extended partnerships with species protection
organizations and are also getting favorable assurance for their
business.
The study makes several contributions to the extant B/E
literature. First, to the best of our knowledge, no studies have
examined the relationship between species disclosed by organ-
izations and its determinant factors. Therefore, this paper aims
to close this gap by contributing to the extant B/E literature
and demonstrate how EC/FT companies are displaying signifi-
cant efforts on species protection and restoring habitats. Sec-
ond, theoretically, we adopt a triangulation of theories; deep
ecology, legitimacy and stakeholder theories. We also suggest
that species should be considered as one of the main stake-
holders’ categories in addition to customers, employees, etc.,
as businesses have a two-way relationship with biodiversity
and species, including both the impact of companies on bio-
diversity and the impact of biodiversity on companies (Adler
et al., 2018). Third, our paper has an empirical contribution.
Instead of adopting OLS regression that is commonly used by
previous studies (Adler et al., 2018; Hassan et al., 2020b), we
test and create Poisson pseudo-maximum likelihood (PPML)
regression with a multi-way fixed effects model. We believe
the PPML model is more relevant to explore the relationship
between the species disclosed by companies and determinant
factors because our disclosure index includes positive count
values only. Fourth, our study has a number of implications for
policymakers. The proposed empirical model and theoretical
framework in this study will allow policymakers to process a
post-2020 framework to reshape the global relation with nature
(UN, 2020b) and support the United initiatives and achieve the
SDGs 14 and 15 objectives. The study will guide decision-
makers to understand how disclosure of species protection by
companies can assist society to mitigate further B/E loss in
the future. Finally, our paper responds to recent calls (Gaia
& Jones, 2019; Lambooy et al., 2018) to develop solutions by
showing how the potential for reporting for B/E can mitigate
the further risk of ecological collapse.
The rest of the paper is structured as follows: the next sec-
tion covers the literature review. Section three discusses the
theoretical literature. Section four discusses empirical litera-
ture and hypothesis development. Section five illustrates the
research design. Section six presents the empirical analysis.
Finally, a discussion of findings and limitations is exhibited
in the last section.
Corporate Accountability, Ecology,
and Species Extinction Protection Around
the World
Research on corporate accountability for B/E is in its
infancy (Addison et al., 2019; Adler et al., 2017) and is
an emerging strand of literature (Haque & Jones, 2020).
To date, academics have been relatively silent on examin-
ing the role of companies in conserving biodiversity and
species protection (Adler et al., 2018) and thus, there is
a huge call for company awareness from stakeholders of
businesses (Hassan et al., 2020b). To provide context,
B/E accounting emerges from biodiversity reporting and
this extends to include the ‘extinction’ element due to the
severity of the decline of nature (Atkins & Maroun, 2018).
The early seeds of biodiversity reporting were set by Jones
(1996) who suggested that organizations are stewards of
natural capital and have a moral duty to protect and to
publicly disclose their efforts (Atkins et al., 2014). Early
empirical studies began to explore reporting of compa-
nies on biodiversity issues at country level (Boiral, 2016;
Rimmel & Jonäll, 2013; van Liempd & Busch, 2013)
and industry level (Adler et al., 2017; Boiral & Heras-
Saizarbitoria, 2017). Prior studies are consistent in finding
that most companies provide poor disclosure, vague state-
ments, and are generally unimpressive with their efforts to
manage and protect biodiversity. Literature suggests that
companies fail to recognize the risk of biodiversity loss,
leaving them unconvinced that conservation warrants their
efforts (Skouloudis et al., 2019). It seems to be only when
endeavors provide rewards of stakeholder impressions or
reputational advantage that companies will pay attention
(Bhattacharya & Managi, 2013; Hassan et al., 2020b).
It is argued that biodiversity reporting on its own is
insufficient (Atkins & Maroun, 2018; King & Atkins,
2016). The widely adopted Global Reporting Initiative
(GRI) standards only make some reference to biodiversity
(Jones & Solomon, 2013), and therefore company account-
ability is limited. Companies following the GRI frame-
work are found to be indulging in impression management
(Gray & Milne, 2018; Solomon et al., 2013), with a lack of
consistent, transparent reporting. Atkins and Atkins (2018)
suggest that continuing to report in this method will lead
to a fossil record of species. Haque and Jones (2020) sup-
port the previous arguments and mention that companies
are using GRI standards as a mechanism to refer to bio-
diversity, providing symbolic statements and failing to
provide clarity on operational impact to natural capital.
13

574
L. Roberts et al.
In response to the limitation mentioned above, extinc-
tion accounting evolves from biodiversity reporting by
critically recognizing the need to address the current
extinction crisis (Atkins & Maroun, 2018). Incorporating
GRI biodiversity principles, extinction accounting aims
to promote change by companies and reverse species loss
(Atkins & Atkins, 2018; King & Atkins, 2016), providing
companies opportunity to disclose how they are acting to
prevent further extinctions (Hassan et al., 2020b).
The framework provides the opportunity to include nar-
rative detail and self-reflection, and to further articulate
extinction prevention measures with the hope that this
will lead to changes in company behavior (Hassan et al.,
2020b). Furthermore, companies should seek to consolidate
numerical data and narrative and pictorial evidence to com-
prehensively communicate conservation efforts (Atkins &
Maroun, 2020). Atkins (2020) argues that companies should
be integrating extinction accounting into annual reports to
trigger change and would have to “assess the populations
of threatened species living near their operations; work
out whether their business puts them at risk; come up with
plans to protect them; and explain them to investors”. Stud-
ies from extinction accounting give evidence of a genuine
concern for nature and represent the need for compassion
for species (Atkins et al., 2018; Buchling & Maroun, 2018);
they support the idea that companies begin to acknowledge
their dependence on natural capital. Motivated by extinction
concern, evidence of species names emerges in corporate
reports (Adler et al., 2018; Atkins et al., 2014). However,
an argument builds that certain alluring or desirable species
may attract more attention from companies than others, as
Weir (2018) observed that mammals and birds warranted
greater conservation efforts than insects and invertebrates.
Atkins et al. (2014) reinforce this theory, reporting that
favoritism may be shown towards certain species, especially
species which are beneficial to humans.
Smith et al. (2019) found that the corporate motiva-
tion to engage in conservation efforts is unclear. However,
the existing studies assist companies to recognize that the
threat of extinction is a material risk (Addison et al., 2019).
Global policymakers are also taking the initiative to encour-
age companies to be accountable towards the extinction of
species. For example, The Natural Capital Coalition (2020)
urges companies to realize that their success is driven by
ecosystems; the loss of any species to extinction is devas-
tating, but species which provide such intrinsic worth to
industries is frightening.7 Indeed, the global Aichi targets
7 For example, crop production which has an estimated annual
valuation of $577 billion, is under threat from pollination loss and
bee decline (The World Bank, 2020), threatening the food industry.
Approximately 70% of cancer drugs are derived from plant spe-
cies, consequently threatening the pharmaceutical industry (PWC &
WWF, 2020).
of the ‘Strategic Plan for Biodiversity 2011–2020’ have been
considered a failure as biodiversity decline is accelerating at
an unprecedented rate, with humanity’s legacy of biodiver-
sity at a crossroads for future generations (CBD, 2020). The
most recent call to action is the United Nations SDG targets
‘The 2030 Agenda for Sustainable Development’. Global
governments have agreed on a vision of ‘Living in harmony
with nature’ by 2050, and it is imperative lessons are learned
from the past decade if the SDGs are to be met. The UN
Biodiversity Conference in September 2020 emphasizes the
need for “Urgent action on biodiversity across all sectors
and from all actors” to meet the SDG target of 2030 (CBD,
2020). Furthermore, the post-2020 biodiversity initiatives
must be achieved, or humanity could potentially face future
pandemics.
The current COVID-19 crisis provides forewarning to
further encroachment between natural capital and humans
that can have detrimental impacts (Carrington, 2020). Cor-
porates must make transformational changes to restore their
relationship with nature and engage in sincere stewardship
of natural capital, as it is their moral duty to protect future
generations (Gaia & Jones, 2019). Turning a blind eye to
warning signs could be catastrophic for business prosper-
ity and survival. There is no extensive literature to explain
the accountability of companies towards species extinction.
Therefore, in this study, we discuss how the disclosure of
species by global companies can assist them in achieving
environmental awards, gain assurance from Big 4,8 and
allow companies to expand biodiversity partnerships lead-
ing to a financially sustainable company. The findings of
this study will be an example for stakeholders of companies
and will encourage academics to extend the studies on B/E
to assist companies to be more accountable towards B/E.
Furthermore, to meet SDGs 14 and 15, we offer a solution
that can assist in preventing further decline by advocating
that companies transform their reporting practice to include
information on their efforts to protect biodiversity and
species.
Theoretical Literature Review
Prior B/E research applies various theories to explain com-
pany viewpoints including impression management (Boiral,
2016), greenwashing (Hassan et al., 2020b), and legitimacy
(Adler et al., 2017; Bhattacharyya & Yang, 2019). However,
we observe that companies have not done enough to protect
species from extinction, and, as experts explain, it may be
that this is one of the reasons for zoonotic disease spillover
8 Big4—one of the big four accounting firms: Deloitte, Ernst &
Young, KPMG, PwC.
13

Corporate Accountability Towards Species Extinction Protection: Insights from Ecologically…
575
such as COVID-19 (Ceballos et al., 2020). Lack of a com-
prehensive theoretical model cannot motivate companies
to identify a strategy for species protection. Therefore, we
introduce a triangulation of theories, namely deep ecology,
legitimacy, and stakeholder theories. Deep ecologists are of
the view that nature has intrinsic value, and all nonhuman
life should be preserved (Naess, 1989, 2008), thus rejecting
anthropocentric shallow ecology, which places humans of
most importance, believing nature has value because of what
it contributes to human satisfaction (Callicot, 1990, 1994;
Thompson & Barton, 1994). Deep-ecologists debate whether
environmental and extinction crises are human-induced
(Samkin et al., 2014) and support the suggestion that the
crisis is the result of dominating anthropocentric bias in cor-
porate behavior (Atkins et al., 2014). Absolute deep ecol-
ogy would reject business use of natural assets as a com-
modity. However, to mitigate corporate financial risk and
prevent societal collapse, a middle ground must be reached.
Companies must consider embedding an ecological culture
and stewardship (Jones, 1996) by protecting and investing
in nature. For example, Gaia and Jones (2019) found that
elements of deep ecology must be ethically rooted to enable
a sustainable society. Similarly, Samkin et al. (2014) found
deep ecology embedded in biodiversity disclosures and men-
tion that the approach requires a long-term commitment.
Embracing deep ecology is not to put a financial value on
species as this would be refuted by deep-ecologists; rather,
companies must evaluate their behavior and engage in a
balanced perspective to mitigate the risk of financial loss,
together with responsibly protecting species and habitats.
The relationship with nature must be realigned and eliminate
the arrogant profit-seeking objectives, which have driven us
to a planetary emergency (Gray & Milne, 2018).
Empirical evidence considers corporates to be rife in
legitimizing activities (Boiral & Heras-Saizarbitoria, 2017;
Cho & Patten, 2007; Milne & Gray, 2013; Patten, 2002).
Extant literature considers B/E accounting as a continua-
tion of corporate social responsibility (CSR) research into
corporate disclosure practices (Bebbington & Larrinaga,
2014; Hassan et al., 2020b). Legitimacy theory is one of the
most applied theories to explain the increasing CSR report-
ing over the past two decades (Hassan & Guo, 2017) and it
“involves the selective disclosure of positive actions result-
ing in misleading and biased reporting” (Mahoney et al.,
2013, p. 352). Extant literature uses legitimacy theory to
explain that dishonest companies misreport their CSR efforts
to capitalize on their face value to influence stakeholders’
perceptions and gain legitimacy (Lyon & Maxwell, 2011;
Zijl et al., 2017).
Adler et al. (2018) argue that biodiversity and threat-
ened species information is provided in order to fulfil the
desires and expectations of stakeholders. Bhattacharyya
and Yang (2019) specifically note that considering the
current planetary emergency, for businesses to gain soci-
etal legitimacy, they must increase biodiversity disclosure.
Lewis (2016) explains that legitimacy is a practice that is
deceivingly used to endorse that organizations’ policies
or practices are environmentally friendly, when arguably
they are not. Patten (2015), for example, explains that an
organization with specific environmental adversity intensi-
fies the extent of CSR reporting to signal to stakeholders
that the organization is addressing the concern. This con-
tinues a tradition of impression management-oriented lit-
erature in environmental accounting (Hassan et al., 2020a,
b). This research argues that companies provide disclosure
to legitimize companies’ concerns for B/E issues (Adler
et al., 2018; Cho et al., 2015a; Lyon & Maxwell, 2011).
As the species extinction crisis intensifies, it can be
expected that companies must meet external pressures
(Rimmel & Jonäll, 2013) and enhance reputation to main-
tain their “licence to operate” (Adler et al., 2017, p. 1714).
Research highlights that stakeholder and legitimacy theo-
ries overlap in social and environmental studies (Deegan,
2002; Gaia & Jones, 2017, 2019). Stakeholder theory has
been used to explain the needs and expectations of human
groups and individuals affected by the company (Boiral
& Heras-Saizarbitoria, 2017; Gaia & Jones, 2019). The-
oretically, we recognize a limitation within stakeholder
literature that prior studies have failed to recognize or
explain for the prevention of further species loss. Roberts
et al. (2020b) argue that species should be included as a
main stakeholder with the established groups of employ-
ees, NGOs, government agencies, environmental groups,
and customers (Jones, 1995; Schaltegger et al., 2017). We
believe that for deep ecology to be embedded in corporate
strategy, species of flora and fauna should be considered
as one of the main stakeholders’ categories, discarding
human hierarchy, for companies to protect and restore
species and their habitats. In this vein, we focus on a tri-
angulation of deep ecology, legitimacy, and stakeholder
theories, which can explain the relationship between spe-
cies numbers and determinant factors. We recognize that
corporates may be disclosing species-specific informa-
tion for legitimizing purposes, but we are also hopeful
that those companies who are disclosing species numbers
have started to realize the intrinsic worth of natural capital
and are consequently embedding ecological culture and
displaying a genuine concern for the extinction crisis by
identifying species as stakeholders. We hope that provid-
ing disclosure on species protection will be the new norm
for other companies to follow. Societal health is under-
pinned by nature (Roberts et al., 2020a); we expect that by
application of the triangulation of theories, we can assist
companies to explain the underlying motivation to reform
B/E impact, which will reduce potential future pandemics
(Ceballos et al., 2020).
13

576
L. Roberts et al.
Empirical Literature Review and Hypotheses
Development
B/E accounting is considered as an extension of CSR (Beb-
bington & Larrinaga, 2014; Bhattacharyya & Yang, 2019;
Hassan et al., 2020b). From the existing literature, we
identified that the assurance by leading assurance provid-
ers, presence of partnerships, environmental performance,
and environmental award are some important factors that
will assist the stakeholders to assess the accountability of
the companies towards nature. In the following section, we
discuss these factors in detail to develop the hypotheses
related to the research question, which is supported by the
comprehensive theoretical model explained previously.
Species and Assurance
Sustainability reporting is established in mainstream
practice to meet the needs of societal expectations (Junior
et al., 2014; Kolk & Perego, 2010). However, it is argued
in the literature that the reliability and quality of informa-
tion falls short (Cho et al., 2015a). Boiral et al. (2018)
imply that information can be biased and reporting by
companies is used as a window-dressing activity (Boiral,
2016), and thus, the credibility of information is ques-
tioned (Gray, 2010). To enhance the quality and credibility
of sustainable reporting in literature, we find that compa-
nies prefer to use third-party assurance from accounting
firms (Maroun, 2018). Involvement of third parties can
increase the confidence of the stakeholders in disclosure
(Simnettt et al., 2009). Human stakeholders perceive the
professionally audited reports from the external assurance
provider as a confident and legitimate report of the com-
pany performance (Cho et al., 2015a).
Because of the immense presence of independence in
the report prepared by the external assurance provider,
companies who are under public pressure due to poor per-
formance may prefer to seek external independent assur-
ance to indicate a better performance to the stakeholders
(Boiral et al., 2018; Maroun, 2018). But external assurance
is also required to identify which companies are better
in addressing the B/E risk, which is prominent (IPBES,
2019) and related to human behavior. The external assur-
ance report can help the stakeholders to understand how
the companies are following deep ecology principles by
engaging in the stewardship of natural capital (Bhattacha-
ryya & Yang, 2019). Legitimacy theory has been domi-
nant in the social and environmental accounting litera-
ture (Belal & Owen, 2015; Giordano-Spring et al., 2015).
Many studies (e.g., Ball & Craig, 2010; Cho, 2009; Cho &
Patten, 2007; Hassan & Guo, 2017; Patten, 2015; Tilling
& Tilt, 2010) empirically examine legitimacy theory and
support the argument that companies voluntarily provide
environmental information to gain legitimacy. The theory
also predicts that organizations who are more likely to
be subject to public pressure and legitimacy threats due
to negative CSR performance may hire third parties to
provide assurance to indicate favorable performance
(Boiral, 2016; Cho et al., 2014; Maroun, 2018). Conse-
quently, independent third-party assurance can help to
deflect attention from negative B/E performance, lessen
legitimacy risks, and install improved confidence among
stakeholders (Gürtürk & Hahn, 2016; Perego & Kolk,
2012). More specifically, these firms actively hire third
parties that provide limited assurance to portray that the
B/E information released in CSR reports is credible, in
order to improve stakeholders’ confidence and enhance
corporate reputation and perceived legitimacy (Cho et al.,
2014; Odriozola & Baraibar-Diez, 2017). Nevertheless,
as companies must comply with reporting standards, they
may prefer the ‘low-quality assurance’ with less scrutiny,
and thus they have opportunity to dissociate their revealed
from their actual performance.
However, it is also evident in the literature that assur-
ance providers deliver cautious rhetoric, failing to explic-
itly address issues around the report on biodiversity (Boiral
et al., 2019). Companies may prefer to buy less scrutinized
‘low-quality’ assurance options to deflect from their poor
performance (Hassan et al., 2020b), and are expected to
select limited assurance (Braam & Peeters, 2018) outside
of the accounting profession to focus on selected sec-
tions of the performance. In post-pandemic reporting, we
expect companies to engage in stewardship of protecting
species and habitats, embedding a deep-ecological culture
by regarding species as a main stakeholder. In the future,
assurance providers will scrutinize the company impact
on biodiversity. Our motivation for this hypothesis is to
extend existing literature which finds a positive relation
between B/E disclosure and external assurance (Hassan
et al., 2020b). Therefore, we examine whether external
assurance is an influencing factor in protecting species.
By applying deep ecology and stakeholder theory, compa-
nies are expected to commit to protecting species (Samkin
et al., 2014) and valuing them as stakeholders. The contra-
dictory findings of the importance of external assurance
motivated us to examine the influence of external assur-
ance on companies’ accountability towards the extinction
of species. Thus, we propose the following hypothesis:
Hypothesis 1 There is a positive relationship between the
number of species and buying assurance from an external
assurance provider.
13

Corporate Accountability Towards Species Extinction Protection: Insights from Ecologically…
577
Species and Environmental Performance
Legitimacy theory helps to explain why companies with
poor environmental performance have higher environmental
scores (Mahoney et al., 2013). In the literature, we find that
the more extensive disclosure companies provide, the more
the firm’s reputation is enhanced (Cho & Patten, 2007; Cho
et al., 2012). Poor performers are anticipated to disclose in
order to gain legitimacy and enhance societal perception
(Clarkson et al., 2008). Hassan et al. (2020b) classify com-
panies into poor and better performers and find companies
with poor environmental performance disclose more and
offer justification to defend legitimacy. Based on this argu-
ment, we expect that poor performers will disclose more
species information to maintain legitimacy, and as a result,
the companies can be more accountable in mitigating the
extinction of species. If species are accepted as one of the
main stakeholders, we expect EC/FT companies to propose
long-term value creation and suppress demand on natural
capital, committing to achieving SDGs 14 and 15. Our moti-
vation is to extend B/E literature (Hassan et al., 2020b) and
contribute to it by empirically examining, in support with
legitimacy theory, the relationship between species and poor
environmental performers. Thus, we propose the following
hypothesis:
Hypothesis 2 There is a positive relationship between the
number of species and poor performers.
Species and Environmental Award
Gaining an environmental award is an excellent way of dis-
playing positive practices to stakeholders (Cho et al., 2015b;
Deegan, 2002), and motivates other companies to disclose
CSR practices (Hassan & Ibrahim, 2012). Acquiring awards
can show the true commitment of the company to natural
capital and confirm their deep ecological perspective (Clark-
son et al., 2008). Such awards influence investors to make a
positive decision about the company, which leads to favora-
ble future financial performance (Clarkson et al., 2011).
Prior B/E literature suggests that companies should report
on prizes and awards relating to conservation efforts (van
Liempd & Busch, 2013). Awards provide an opportunity to
signal genuine concern for nature (Adler et al., 2018; Atkins
et al., 2014) and showcase efforts. Hassan et al. (2020b)
exclusively find a positive association between B/E disclo-
sure and companies gaining environmental awards. Based on
this discussion, our motivation is to extend extant literature
and expect companies who disclose species to gain environ-
mental awards, and by doing so, deep ecology supports that
they have considered species as stakeholders (Roberts et al.,
2020b) in their reporting in order to address the extinction
crisis responsibly.
Hypothesis 3 There is a positive relationship between the
number of species and getting an environmental award.
Species and Partnerships
Prior literature finds a positive relationship between B/E
disclosure and partnership engagement (Adler et al., 2018;
Boiral & Heras-Saizarbitoria, 2017; Hassan et al., 2020b).
Here, partnership refers to when a company discloses a rela-
tionship with at least one conservation or wildlife organi-
zation. This can be viewed as a display of good corporate
practice (Adler et al., 2018) and a means of seeking pub-
lic trust (Deegan, 2002). Collaborating with organizations
such as WWF (World Wildlife Fund) or IUCN (International
Union for Conservation of Nature) can help companies to
engage in conservation efforts, and companies are therefore
more likely to minimize the extinction crisis (Adler et al.,
2018). Partnership engagement will motivate companies to
consider species as stakeholders (Atkins et al., 2018; Buch-
ling & Maroun, 2018; Zhao & Atkins, 2018). By supporting
this concept, EC/FT companies can commit to achieving
SDGs 14 and 15 and can align with long-term value crea-
tion. Thus, our motivation is to enhance B/E literature (Adler
et al., 2018; Boiral & Heras-Saizarbitoria, 2017) by empiri-
cally examining the relationship with species and partner-
ship engagement. Theoretically, deep ecology perspective
and regarding species as stakeholders, demonstrates that
companies are preserving nature (Atkins et al., 2018) and
showing genuine concern for the B/E crises. Thus, we expect
that companies which engage in partnerships will disclose
more species.
Hypothesis 4 There is a positive relationship between
the number of species and companies who engage in
partnerships.
Research Design
Sample Selection
The sample for this research consists of the top 200 compa-
nies from the Fortune Global list of 2016. Purposefully, we
considered these companies as they are typically leaders in
CSR (KPMG, 2017), make significant use of ecosystems,
and therefore gain the most public attention (Adler et al.,
2018; Hassan et al., 2020b). These companies represent a
variety of industries exposed to different levels of biodi-
versity risk (Addison et al., 2019; Bhattacharya & Managi,
2013) from diverse geographic locations (Hassan et al.,
2020b). The top 200 companies are selected from the For-
tune Global 500 list as literature supports that the remaining
companies rarely disclose biodiversity information (Adler
13

578
L. Roberts et al.
et al., 2018; Hassan et al., 2020b). The investigation period
is 3 years: namely, 2012, 2014, and 2016, as one of the vari-
ables, environmental performance, is calculated every 2
years. Corporate annual and sustainability reports are down-
loaded from company websites. Sustainability reports can
be referred to as environmental, corporate social responsi-
bility, citizenship, or such reports. Where these reports are
missing, we manually collected relevant information from
the annual reports. Following prior studies (Addison et al.,
2019; Adler et al., 2017), websites were not included in the
search. In total, 600 annual and sustainability reports were
downloaded (which are accessible on their corporate web
pages). After controlling for an outlier, our final sample
comprised of 599 companies. Following prior studies (Adler
et al., 2018), we used content analysis, and by searching key-
words,9 we counted for species information. Keyword search
and manual collection are followed in this paper to identify
companies from 22 countries10 and 19 sectors.11
Research Variables
Dependent Variable: Number of Species
The number of species count was comprised of species
numbers presented in quantitative terms or by naming in
qualitative terms. A manual count of all species disclosed on
reports were collected and recorded. The number of species
counted was protected or conserved or noted as threatened
with extinction by the company. Where companies disclosed
a group of species, for example, 10 birds, we counted these
as 10 species and so on. In the counting of species, duplicate
references were eliminated; in other words, species referred
to on more than one occasion were counted once.
9 The 28 keywords are "Extinct", "Extinction", "EN11", "EN12",
‘EN13", "EN14", "Wildlife", "Habitat", "Species", "Biodiversity",
"Biodiversity offset", "Forest", "Ecosystem", "Flora", "Fauna",
"Endangered", "Threatened", "Vulnerable", "Accident" (relating to
B/E), "Conservation", "Biological diversity", "Protected", "Floral/
Faunal wealth", "Rehabilitation", "Groundwater", "Marine", "Vegeta-
tion", "Wetlands" (Adler et al., 2018).
10 Countries are Australia (9), Brazil (12), China (120), France (45),
Germany (48), India (3), Italy (12), Japan (57), Luxembourg (3),
Malaysia (3), Mexico (6), Netherlands (12), Norway (3), Russia (12),
Singapore (3), South Korea (15), Spain (6), Switzerland (15), Taiwan
(3), Thailand (3), United Kingdom (24), and USA (186).
11 The 19 sectors are Aerospace (21), Apparel (3), Chemicals (6),
Energy (99), Construction (18), Financial (144), Food & Beverage
and Tobacco (15), Food & Drugs (33), Health care (30), Household
products (6), Industrial (18), Materials (12), Media (3), Motor Vehi-
cles and parts (48), Retails (21), Technology (42), Telecommunica-
tion (33), Transportation (15), and Wholesalers (33).
Independent Variables
We used assurance, environmental award, presence of part-
nerships, and environmental score as independent variables
(see Table 1). The environmental score was measured by the
environmental well-being score from the Sustainable Soci-
ety Foundations website (Adler et al., 2018; Hassan et al.,
2020b). The scores are available per country every 2 years
and following Hassan et al. (2020b), we classified the sample
into poor performers (score 0–2.9) and better performers
(score 3–5). The sample consisted of 290 poor performers
and 309 better performers.
Control Variables
For this research, we considered leverage, firm size, and rev-
enue as control variables. In addition, we used country-level
variables. Following Hassan et al. (2020b), we classified the
sample into developing and developed countries, according
to the United Nations classification. There are 177 develop-
ing and 422 developed firm-year observations in our sample.
The industry was controlled in the study and was classified
by risk exposure according to the three categories of the F
& C Asset Report (2004) risk level (red is high risk; amber
is medium risk and green is low risk).12 In accordance with
Hassan et al. (2020b), we grouped red and amber to “high
risk” classification, and green remained “low-risk” classifi-
cation. The total sample consisted of 219 high-risk firm-year
observations and 380 low-risk firm-year observations. Gov-
ernance indicators are widely used in multi-country studies
(Nguyen et al., 2015; Waldron et al., 2017) with empirical
evidence finding a positive correlation of company perfor-
mance with country-level governance (Luo et al., 2012).
Therefore, we added seven regularity governance level indi-
cators (see Table 1) developed by Kaufmann et al. (2011)
collected from the World Governance Indicator dataset. In
addition, we added World Development Indicators, like GDP
growth, inflation, the log of forest area, and C 02 emissions
(Spaiser et al., 2017; Stephan et al., 2015).
12 High-risk sectors (red zone) are Construction & Building Mate-
rials, Electricity, Food & Drug Retailers, Food Producers & Proces-
sors, Forestry & Paper, Leisure & Hotels, Mining, Oil & Gas, and
Utilities. Medium risk sectors (amber zone) are Beverages, Chemi-
cals, Financial Services, General Retailers, Household Goods &
Textiles, Personal Care & Household Products, Pharmaceuticals &
Biotech, Support Services, Tobacco, and Transport. Low risk sectors
(green zone) are Aerospace & Defence, Automobiles & Parts, Diver-
sified Industrials, Electronic & Electrical Equipment, Engineering
& Machinery, Health, Information Technology Hardware, Media &
Entertainment, Software & Computer Services, Steel & Other Metals,
and Telecom Services.
13

Corporate Accountability Towards Species Extinction Protection: Insights from Ecologically…
579
Table 1 Research variables
Definition and coding
Dependent variable Number of species—Total count of number of species collected from published annual reports
Independent variable Assurance—has a value of “1” if the company has assurance and a value of “0” if not. Data collected from published
annual reports
Assurance by Big4—Company has a value of “1” if assured by one of the big four accounting firms (KPMG, E&Y, PwC,
or Deloitte), and a value of “0” if not. Data collected from published annual reports
Environmental Award—value of “1” if award is given, value of “0” if not. Data collected from published annual reports
Environmental Score—Company is given a value of “1” if classified a ‘poor performer’ and a value of “0” if classified
a better performer. Data collected from Sustainable Society Foundation (SSF). Score is calculated every 2 years and is
used in prior studies (Adler et al., 2018; Hassan et al., 2020a, b)
Presence of Partnerships—Presence of biodiversity/wildlife partnerships, value of “1” given if one or more present, value
of “0” if none. Data collected from published annual reports
Control variables
Country—Value of “1” given if the country is classified as developed and a value of “0” if developing. Data retrieved
from United Nations website
Industry—Company has a value of “1” if classified as red/amber-risk zone, and a value of “0” if classified as a green risk-
zone. Classification recommended by F & C Asset Report (2004)
Governance—Is the average score of voice & accountability, political stability, government effectiveness, regularity qual-
ity, rule of law, control of corruption and corruption index taken from Worldbank.org
GDP growth—(annual%)—World Development Indicator. Data collected from Worldbank.org
Inflation—GDP deflator (annual%) World Development Indicator. Data collected from Worldbank.org
Log (Forest area)—Forest areas (sq. km)—World development indicator. Data collected from Worldbank.org
CO2 emission—(metric tonnes per capita)—World Development Indicator. Data collected from Worldbank.org
Log (Revenue)—Data collected from published annual reports
Leverage—Total debt/total assets. Data collected from published annual reports
Firm size—Natural logarithm of total assets. Data collected from published annual reports
Empirical Results and Discussion
Summary Statistics
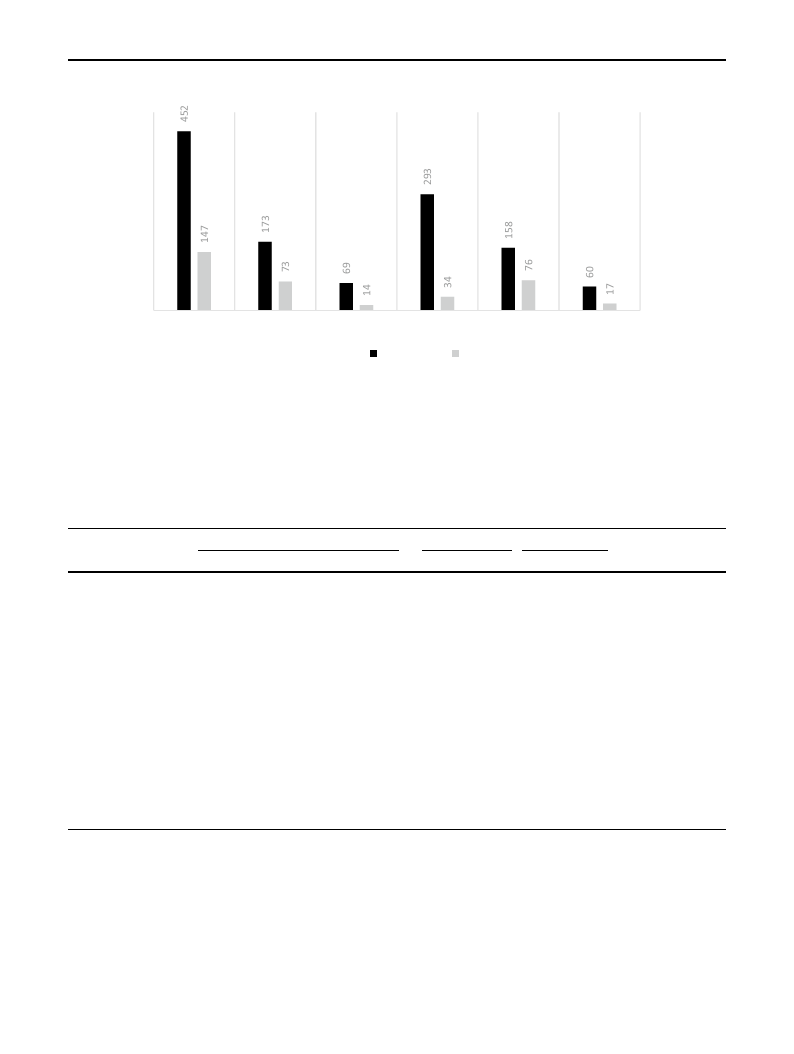
Our results show that 452 out of 599 reports (75%) failed
to disclose any species numbers (refer to Fig. 1). These
findings support prior literature (Adler et al., 2018; Bhat-
tacharya & Managi, 2013) and suggest a call for awareness
among companies (Rimmel & Jonäll, 2013; Hassan et al.,
2020b). However, the remaining EC/FT companies, 147
out of 599 (representing 25%), provided species numbers,
demonstrating ecological awareness by engaging in con-
servation efforts to protect and restore species and habi-
tats, valuing species as stakeholders. We found a slight
increase in species numbers over years which optimis-
tically displays a deep-ecological view with companies
being self-aware of the fundamental value of the planet
(Hassan et al., 2020b). The declaration of the SDGs in
2015 may also explain the increase. We acknowledge that
this is a small proportion of the sample. However, these
EC/FT companies provide seminal knowledge in establish-
ing relationships between species and developing solu-
tions to meet SDGs 14 and 15. These disclosures may be
a reporting exercise to manage impressions. However, we
expect post COVID-19 that there will be a seismic shift in
company reporting and committing to protecting nature,
and therefore justify the significance of our results.
Table 2 presents the descriptive statistics for all vari-
ables used in the study. The average number of species
disclosed by companies is about 3 species with a standard
deviation of 21. This implies that there is a significant
difference in the reported species among the companies.
We further nalysed by country and found developing coun-
tries have a higher mean score for the number of species
(i.e., 3.458) than developed countries (i.e., 2.614). This
supports the recent arguments, where experts believe that
developing countries are to blame for the COVID-19 pan-
demic due to illegal wildlife trade and wet markets and
call for enforcing the banning of such trades to prevent
further pandemics and extinctions and forcing companies
to become socially responsible (Ceballos et al., 2020; Ma
et al., 2020). Legitimacy theory explains that develop-
ing countries provide more species to maintain societal
legitimacy and reputation (Adler et al., 2018; Bhattacha-
ryya & Yang, 2019). We found developed countries have
a higher mean score for assurance, environmental award,
partnerships, Big4, leverage, governance, industry, and
CO2 emissions, which is similar to prior studies on CSR
(Bouten et al., 2011; Tagesson et al., 2009). Furthermore,
the developing countries had a higher mean score for
environmental score, firm size, GDP, and inflation which
13
580
DistribuƟon of Key InformaƟon
L. Roberts et al.
REPORTS
FIRMS
AWARD ASSURANCE
BIG4
POP
Series1
Series2
Fig. 1 This figures shows a distribution of key information of our
data from 599 annual reports of 200 firms. Series 1 represents the
reports where firms did not report any species and Series 2 docu-
ments the reports in which firms included the names of species (we
counted the number of species as explained in the data description).
REPORTS is the number of reports in our data. FIRMS is the num-
ber of firms (during 2012–2016) in each set of Series. AWARD is the
number of reports indicating the firms received environment award.
ASSURANCE is the number of reports which mention whether the
firms receive assurance. BIG 4 is a subset of ASSURANCE indicat-
ing whether the assurance received from BIG 4. POP represents the
number of reports which mentions the presence of biodiversity/wild-
life partnerships
Table 2 Summary statistics of the variables used in our models
Full sample
Obs Mean
Median St.Dev
Number of species
599
Buying assurance
599
Environment score
599
Green
599
Environment award
599
Presence of partnership 599
Big 4
599
Firm size
590
Log (revenue)
593
Leverage
596
Governance
599
CO2 emission
400
Log (forest area)
596
GDP growth
596
Inflation
596
2.863
0.679
0.065
0.658
0.199
0.237
0.391
12.494
11.346
6840.108
0.839
10.426
13.322
2.820
1.552
0.000
1.000
0.000
1.000
0.000
0.000
0.000
11.809
11.234
0.383
1.232
9.200
14.527
2.200
1.400
21.552
0.467
0.250
0.475
0.399
0.425
0.488
2.512
0.545
167,000
0.785
4.645
2.014
2.528
1.504
Developing country Developed country
Obs Mean
Obs Mean
177
3.458 422
2.614
177
0.599 422
0.714
177
0.170 422
0.021
177
0.588 422
0.687
177
0.186 422
0.204
177
0.147 422
0.275
177
0.367 422
0.401
171 13.276 419
12.175
174 11.276 419
11.375
174 16.66
422 9653.568
177 − 0.246 422
1.294
116
7.545 284
11.602
174 14.100 422
13.002
174
5.681 422
1.641
174
2.344 422
1.226
Difference in means
t-test
0.844
− 0.115**
0.148***
− 0.100**
− 0.018
− 0.128***
− 0.033
1.101***
− 0.099**
− 9636.907
− 1.540***
− 4.058***
1.098***
4.040***
1.118***
supports the literature that finds a positive relation with
CSR disclosure (Chiu & Wang, 2014; Huang & Kung,
2010).
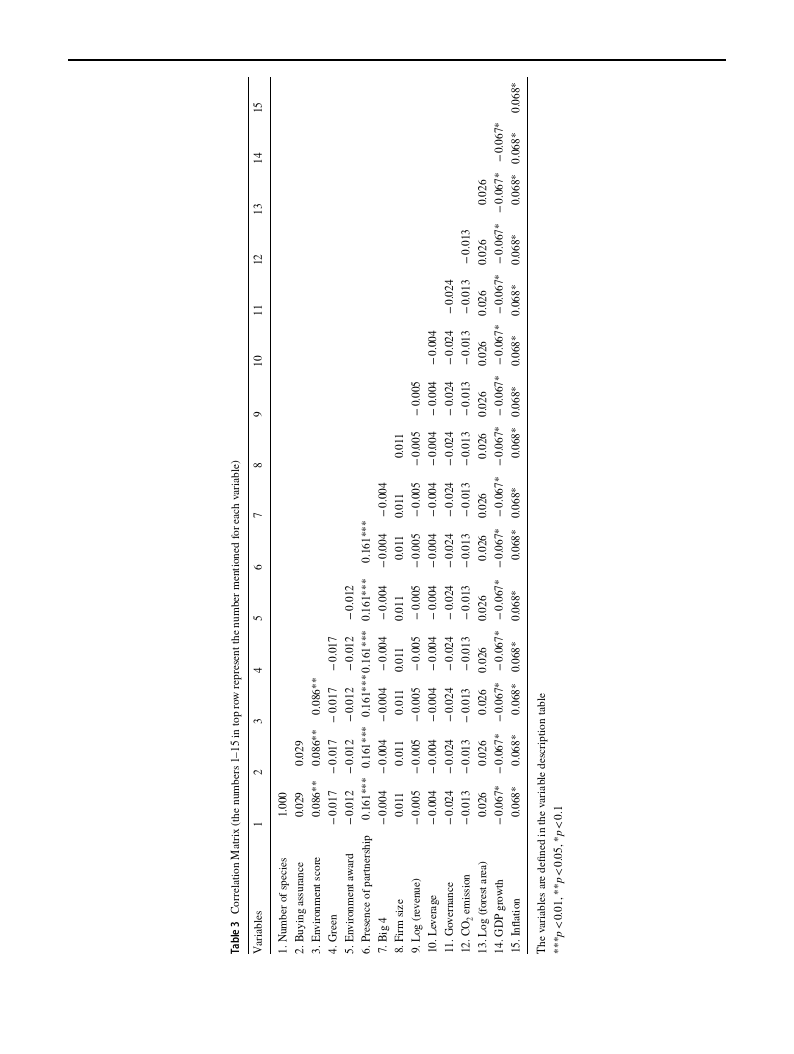
Table 3 provides the correlation matrix of all variables
included in the study. To identify any multicollinearity prob-
lems, we followed prior studies (Bhattacharyya & Yang,
2019; Haniffa & Cooke, 2005) and found a maximum of
0.161 as a correlation coefficient.
We tested the presence of multicollinearity by calculating
the variance inflation factor (VIF) and tolerance values for
each of the explanatory and control variables, as presented in
Appendix A. The VIF indicates how much the variance of a
13
Corporate Accountability Towards Species Extinction Protection: Insights from Ecologically…
13
581

582
L. Roberts et al.
coefficient is inflated because of the linear dependence with
other variables, and the tolerance is the extent of variability
of selected regressors not explained by the other regressors.
The threshold values for VIF and tolerance are less than 10
and more than 0.1, respectively (see Gujarati, 2003; Hair
et al., 2013). Appendix A shows that the VIFs are below 5
(except the Governance variable, which is 5.88). So, multi-
collinearity is not a problem for our estimations of models.
Empirical Models
To test our hypotheses, we started with OLS regression by
using the natural logarithm of the number of species as our
dependent variable. However, the coefficients of the regres-
sion led to inconsistent estimators of the parameters of our
model. Following Gourieroux et al. (1984), therefore, we
used the Poisson pseudo-maximum likelihood (PPML)
regression with multi-way fixed effects model, since our
dependent variable—the number of species—is a non-neg-
ative count variable. In other words, the number of species,
a Poisson random variable, has a discrete probability distri-
bution that indicates the probability of a given number of
species reported in a fixed interval of time. In related simu-
lation results by Santos Silva and Tenreyro (2011), it shows
that the PPML model provides better results even when the
dependent variable contains a large number of zeros. So, we
believe that the Poisson distribution model is appropriate for
our data. This is because 75% of our sample did not provide
disclosure on species protection. In general, we write our
empirical model as
unlikely to follow a negative binomial distribution. So, in
accordance with Cameron and Trivedi (1990), we tested for
over-dispersion. We failed to reject the null hypothesis of
mean–variance equality in all the estimations. This justifies
the use of Poisson for our sample.
Empirical Results
In Table 4, we report the results of the Poisson regression,
to explain the results for the likelihood of the number of
species disclosed by the companies. In addition to the coef-
ficients, we also show White’s heteroscedasticity robust
standard errors in parenthesis.13 In Model 1 of Table 4, the
model is estimated by traditional Poisson regression with
year and country fixed effects. In Model 2, we report the
Poisson pseudo-maximum likelihood (PPML) regression
with multi-way fixed effects.
Based on the deep ecology concept, in this paper, we
consider species as a stakeholder (Samkin et al., 2014), and
therefore, in Hypothesis 1, we propose that there is a posi-
tive relationship between the number of species and buy-
ing assurance. The proposition in Hypothesis 1 is proven
in Models 1 and 2, which show positive and statistically
significant coefficients (Model 1: β = 1.129, p < 0.05; Model
2: β = 1.131, p < 0.10, respectively) of buying assurance.
It implies that firms with assurance are likely to report a
greater number of species than those firms without assur-
ance. Hypothesis 1 reinforces empirical studies which have
found that assured information is viewed as more cred-
ible and reliable, narrowing the legitimacy gap (Cho et al.,
Yit = f (Buying Assurance, Environment Score, Environment Award, Green, Presence of Partnership,
(1)
Big 4, Firm- and Country-level control variables)
where, Y is the number of all species disclosed on financial
reports of sample firm i in year t.
In particular, for our Poisson model, the conditional mean
of Y in Eq. (1) is written as E(Y|X) = exp(X )
where X is the vector independent variable (shown in
Eq. 1) and a constant. The maximum likelihood estima-
tor of , the coefficients of relevant independent variables,
is calculated by maximizing the following log-likelihood
function:
∑
L( ) = Ytlog t − t − log(Yt)
(2)
where t = exp(xt� ) shows a model for the conditional
mean of the number of species. However, there may exist
a problem with the model as it imposes an assumption of
mean–variance equality in its empirical application. Thus, an
alternative model could be a negative binomial model. But
our outcome variable, i.e., the number of species, seemed
2015a; Maroun, 2018). Theoretically, our results support
deep ecology, legitimacy, and stakeholder theories as the
overall increase in disclosure optimistically displays a deep-
ecological view with companies being aware of the funda-
mental value of the planet. Our results support Hassan et al.
(2020b), which found a positive relationship between assur-
ance and biodiversity disclosures. Theoretically, our results
align with deep ecology, evidencing that companies are
committed to protecting species (Samkin et al., 2014), and
valuing them as stakeholders. Additionally, these findings
have implications for policymakers in developing solutions
with companies providing assurance on species information.
13 To adjust for the differences between variance and mean score,
we use a bootstrapping method in the Poisson regression using 500
replications (not reported). The resampling procedure with replace-
ment creates simulated datasets for the estimation. Our results remain
qualitatively similar.
13

Corporate Accountability Towards Species Extinction Protection: Insights from Ecologically…
583
Table 4 Poisson regression results for the likelihood of number of
species disclosed
Dependent variable: number of species
Poisson regression with
year and country FE
PPML with
multi-way
FE
(1)
(2)
Buying assurance
Presence of partnership
Environment Score
Environment award
Big 4
Green industry
Firm size
Log (revenue)
Leverage
Governance
CO2 emission
Log (forest area)
GDP growth
Inflation
Constant
Observations
Pseudo R2
Country fixed effects
Year fixed effects
1.129**
(0.498)
4.093***
(0.446)
1.533*
(0.800)
− 1.948***
(0.455)
− 1.675***
(0.552)
0.226
(0.454)
0.059
(0.069)
− 0.283
(0.366)
− 0.000***
(0.000)
3.991*
(2.193)
− 1.033*
(0.625)
0.727*
(0.384)
− 0.559*
(0.315)
0.546*
(0.285)
− 15.481
(9.832)
394
0.776
Yes
Yes
1.131*
(0.601)
4.111***
(0.477)
1.530**
(0.701)
− 1.937***
(0.454)
− 1.663***
(0.543)
0.233
(1.093)
0.062
(0.085)
− 0.313
(0.418)
0.020
(0.025)
3.912**
(1.865)
− 1.055
(0.822)
0.726**
(0.283)
− 0.561**
(0.274)
0.546*
(0.308)
1.021
(13.564)
373
0.773
Yes
Yes
The table reports the effects of assurance, environment award, pres-
ence of partnership and red Industry on the number of reported spe-
cies in firm’s annual report in each year. The data consists 599 firm-
year observations of top 200 firms listed in Global 500 firms for the
year 2012, 2014 and 2016. Green industry is a dummy equal to 1 if
the industry belongs to green industry and 1 if it is in red or amber
industry. Natural logarithm of total assets as a proxy for firm size is
used. Model 2 reports Poisson pseudo-maximum likelihood (PPL)
regression with multi-way fixed effects. Robust standard errors are
clustered at the industry level and reported in parenthesis
***Denotes 1%, **denotes 5% and *denotes 10% significance level
We expect that assurance will become an integral part of
companies committing to SDGs 14 and 15. This result is
in line with prior studies’ stream of literature that empiri-
cally examines the assurance of a company’s CSR report.
These studies note that stakeholders place more confidence
in CSR reports where the level of assurance provided is rea-
sonably high (Casey & Grenier, 2015; Kolk & Perego, 2010;
Mahoney et al., 2013; Peters & Romi, 2015; Pflugrath et al.,
2011; Simnett et al., 2009).
In addition, we consider the assurance provider as Big4.
Big4 is a binary variable equal to 1 if the sample company
has an auditor from one of the Big4 audit firms. The coef-
ficients in Models 1 and 2 show a negative and statistically
significant coefficient (Model 1: β = 1.675, p < 0.001; Model
2: β = 1.663, p < 0.001, respectively). This implies the num-
ber of species in reporting increases if the company is not
audited by one of the big four accounting firms. This addi-
tional result confirms that auditors from the Big4 account-
ing firms may be failing to address the B/E crisis or can-
not generate awareness in the company. A deep-ecological
concern would expect Big4 providers to relate to the need
for uniformed reporting guidelines on species and habitat
protection (Atkins & Atkins, 2018). Auditors from the Big4
must regard species as a main stakeholder post-pandemic.
To achieve SDGs 14 and 15, assurance providers like Big4
must encourage companies to develop long-term sustain-
ability and their consultancy must include advocating the
protection of species environmental recovery.
The coefficients of environment score in Models 1 and 2
are positive and statistically significant (Model 1: β = 1.533,
p < 0.10; Model 2: β = 1.530, p < 0.05, respectively). This
supports our Hypothesis 2, which states that poor environ-
mental performers are likely to report a greater number of
species compared to better environment performers. This
result is consistent with prior literature that these compa-
nies disclose more to defend legitimacy (Cho et al., 2012;
Clarkson et al., 2008). Our results support empirical studies
that have found a positive relationship between poor envi-
ronmental performers and biodiversity disclosure (Hassan
et al., 2020b). Theoretically, our results support legitimacy
theory, which explains that these poor performers may dis-
close more species as they negatively impact biodiversity
through illegal wildlife trade and lack robust regulations, and
therefore, our results may benefit regulators with assisting
in preventing further species loss. Deep ecology explains
that to achieve SDGs 14 and 15, these poor performers must
begin to consider species as a stakeholder to prevent further
extinctions. This implies that poor environmental perform-
ers are more likely to seek environmental legitimacy and
more stakeholders’ satisfaction by reporting useful B/E
information.
In Hypothesis 3, we predict that to get an award to nar-
row the legitimacy gap and prove a deep concern for nature,
13

584
L. Roberts et al.
firms report a higher number of species. But, in Table 4,
our empirical result shows an opposite sign in coefficients
(Model 1: β = − 1.948, p < 0.001; Model 2: β = − 1.937,
p < 0.001, respectively). These results are surprising as
empirical B/E studies have found a positive relationship
with companies gaining an award (Hassan et al., 2020b).
Our results do not support prior literature (Adler et al., 2018;
Atkins et al., 2014) that companies should showcase con-
servation efforts in protecting species and calls for further
academic examination. Theoretically, this evidence suggests
companies are disregarding species as stakeholders and
neglecting deep ecology. Such a lack of sensitivity towards
B/E will make it difficult in achieving the policymakers’
target of B/E prevention. Our justification for such results is
due to lack of awareness and so far, there is no mandatory
requirement to disclose on the number of species. This high-
lights that there is a huge call for awareness for species to
be regarded as stakeholders by companies. Furthermore, our
results suggest a shift in corporate governance consciousness
to embed deep-ecological concern by protecting species and
their habitats and to prevent future pandemics like COVID-
19. By viewing species as stakeholders post-pandemic, they
are responsibly committing to achieving SDGs 14 and 15.
Thus, if companies become ecologically conscious of the
biodiversity crisis, environmental awards will demonstrate
their commitment to sustainable development.
Further, we test the association between the presence
of wildlife conservation partnership and number of spe-
cies. Models 1 and 2 show positive and statistically signifi-
cant coefficients (Model 1: β = 4.093, p < 0.001; Model 2:
β = 4.111, p < 0.001, respectively). This implies that firms
which have a wildlife conservation partnership are likely
to disclose a greater number of species. This gives evi-
dence in favor of Hypothesis 4. Our results support prior
studies (Adler et al., 2018; Boiral & Heras-Saizarbitoria,
2017; Hassan et al., 2020b) and highlight that wildlife
partnerships are a key driver of companies protecting spe-
cies. This also implies additional empirical support for our
multi-theoretical perspective that integrates insights from
legitimacy, stakeholder, and deep ecology theories. Specifi-
cally, deep ecology explains how companies engaging in
partnerships are preserving nature (Atkins et al., 2018), and
confirms that companies view species as stakeholders by
protecting their habitats and realizing their intrinsic worth.
Our finding implies that companies respond to increased
stakeholder expectation by proactively engaging in compre-
hensive wildlife conservation partnerships, which leads to
better B/E-related activism and B/E reporting. Companies
may indeed be showcasing conservation efforts to protect
species and habitats to gain legitimacy (Adler et al., 2018).
However, partnership engagement increases knowledge and
can address the extinction crisis and prevent future pan-
demics. To meet SDGs 14 and 15, collaboration and shared
knowledge are encouraged (Jones & Solomon, 2013). Our
results imply that partnership association can help develop
solutions (Bebbington & Unerman, 2018; Gibassier et al.,
2020) and achieve a sustainable future. This evidence is also
in line with our multi-theoretical framework that implies
that companies use these mechanisms as public relationships
instruments to legitimize their existence (e.g., Adler et al.,
2018; Hassan et al., 2020b) and oversee the perceptions of
the pertinent stakeholders (Bhattacharyya & Yang, 2019).
Finally, regarding control variables, we find Governance,
Forest area, and Inflation are statistically significant and
positively related to the number of species, suggesting that
country-level variables are key determinants of disclosure on
the number of species. Overall, our hypotheses are mostly
supported by our empirical findings.
Robustness Tests
In the previous section, we use Poisson regression to inves-
tigate the relationship between company-level variables
(such as assurance, presence of partnerships, firm size) to
the number of species. In this section, we analyze our data
in three phases: (1) dividing the data into two sub-samples,
based on the firms headquarter, in developed and develop-
ing countries; (2) analyzing the full sample by taking care
of over-dispersion of the data by reclassifying the sample
into four groups based on the number of species disclosed,
and (3) dividing the sample into financial and non-financial
companies.
In our first test, we report the results of the variables that
influence companies to commit to a greater number of spe-
cies disclosure and how those variables work among firms
operating in developed and developing countries. The results
of Poisson regression at the firm-level data for developed
and developing countries are reported in Table 5.
Our findings in Table 5 mostly support our hypotheses.
Table 5 reveals that Environment Score and Environment
Award have a significant impact on disclosure of the number
of species protected in companies that operate in developing
environments compared with their counterparts that oper-
ate in developed countries. These findings are supported
by the legitimacy theory expectation that companies from
13

Corporate Accountability Towards Species Extinction Protection: Insights from Ecologically…
585
Table 5 Robustness tests:
Poisson regression
Dependent variables
Developed country
Poisson regression
Number of species
(1)
Developing country
(2)
Full sample (ZIP)
Zero-inflated
Poisson regres-
sion
nSpecies
(3)
Buying assurance
Presence of partnership
Environment score
Environment award
Big 4
Green industry
Firm size
Log (revenue)
Leverage
Governance
CO2 emission
Log (forest area)
GDP growth
Inflation
Constant
Observations
Pseudo R2
Country fixed effects
Year fixed effects
0.427
(0.541)
4.029***
(0.466)
− 0.486
(2.572)
− 2.110***
(0.685)
− 1.867***
(0.549)
n.a.
0.156**
(0.075)
− 0.871*
(0.489)
− 0.000***
(0.000)
− 6.800
(6.130)
− 0.588
(0.671)
0.399
(0.463)
− 0.193
(0.541)
1.268**
(0.565)
9.234
(11.970)
282
0.807
Yes
Yes
2.314***
(0.560)
2.765***
(0.431)
2914.660***
(630.495)
1.854***
(0.469)
− 1.951**
(0.821)
n.a.
− 0.743***
(0.169)
1.481***
(0.246)
− 0.057***
(0.015)
9.205***
(2.300)
2.534*
(1.317)
− 266.271***
(58.215)
− 1.078***
(0.334)
− 1.196***
(0.310)
3191.847***
(696.727)
112
0.924
Yes
Yes
0.100*
(0.059)
0.070**
(0.030)
− 0.109**
(0.046)
0.139**
(0.062)
− 0.066
(0.102)
0.054
(0.039)
− 0.004
(0.013)
− 0.029
(0.049)
− 0.001
(0.001)
0.001
(0.246)
n.a.
0.027
(0.030)
− 0.037**
(0.018)
− 0.019
(0.043)
0.005
(0.420)
587
n.a.
Yes
Yes
The table reports the effects of assurance, environment award, presence of partnership and green Industry
on the number of reported species in firm’s annual report in each year. The data consists 599 firm-year
observations of top 200 firms listed in Global 500 firms for the year 2012, 2014 and 2016. nSpecies-coded
from 0 to 4–0 if the number of species is 0, and 1–4 if the number of species is in the range of 1–99, 100–
199, 200–299, 300 and more respectively. Green industry is a dummy equal to 1 if the industry belongs to
green industry and 1 if it is in red or amber industry. Natural logarithm of total assets as a proxy for firm
size is used. Column 3 reports Zero-inflated Poisson (ZIP) regression. Robust standard errors are reported
in parenthesis
***Denotes 1%, **denotes 5% and *denotes 10% significance level
13

586
L. Roberts et al.
developing countries want to portray a positive corporate
image and influence stakeholder perception (Hassan et al.,
2020b; Tagesson et al., 2009). Similarly, we find that assur-
ance has a significant positive effect on disclosure of the
number of species protected in companies that operate in
developing environments, compared to their counterparts
operating in developed countries. Overall, the results support
our claim that institutional context has a moderating effect
on the relationship between Environment Score, Environ-
ment Award, Assurance, and disclosure of the number of
species.
In the second test, we reclassified our dependent variable
scores into a number of classifications. The first classifica-
tion includes all companies which scored zero; the second
classification contains companies which scored between 1
and 99. The third classification contains companies which
scored between 100 and 199, and the fourth classification
those which scored between 200 and 299 and more.
Let us consider Yi an observable variable having discrete
numbers 0, 1, 2, 3, and 4 based on the reported number of
species. Let yi∗ represent an unobservable variable that cap-
tures the level of concerns for biodiversity—proxied by the
number of species of ith firm. The outcome of diversity can
be represented as a function of a vector of explanatory vari-
ables (xi) and relevant control variables using the following
linear relationship:
yi∗ =
�
xi
+
∑
controls + ui, whereui ∼ N(0, 1)
(3)
where is a vector of unknown parameters. Let us consider
mi and yi∗ are related to the observable variable Yi . Consider
mi as four levels of the reported number of species represent-
ing the extent of biodiversity by ith firm. mi determines five
observed values as below:
Yi = 0(‘unable to report any species’) if yi* = 0;
Table 6 Robustness tests: Poisson regression results
Non-financial firms
Model 1
Financial firms
Model 2
Dependent variable: num-
ber of species
Buying assurance
Presence of partnership
Environment score
Environment award
Big 4
Green industry
All control variables
Constant
Observations
Pseudo R2
Country fixed effects
Year fixed effects
2.312***
(0.851)
0.196
(1.052)
1.761**
(0.782)
− 1.628**
(0.774)
− 2.448**
(1.140)
4.216***
(1.609)
Included
7.091
(8.962)
394
0.568
Yes
Yes
0.660
(1.081)
− 1.542*
(0.838)
− 18.715***
(2.575)
− 0.987
(0.816)
− 0.371
(0.833)
n.a
Included
− 8.222
(9.830)
96
0.342
Yes
Yes
The table reports the effects of assurance, environment award, pres-
ence of partnership and red Industry on the number of reported spe-
cies in firm’s annual report in each year. The data consists 599 firm-
year observations of top 200 firms listed in Global 500 firms for the
year 2012, 2014 and 2016. Green industry is a dummy equal to 1 if
the industry belongs to green industry and 1 if it is in red or amber
industry. Natural logarithm of total assets as a proxy for firm size is
used. All control variables are included in both Models 1 and 2 but
not shown and Poisson regression is used. Robust standard errors are
clustered at the industry level and reported in parenthesis
***Denotes 1%, **denotes 5% and *denotes 10% significance level
Yi = 1(‘less than satisfactory level of reported species’) if 0 < yi∗ ≤ m1;
The probability of observed Y can be estimated by the
Yi = 2(}reasonably satisfactory level of reported species’) if m1 < y∗i ≤ m2;
Yi = 3(‘satisfactory level of reported species’) if m2 < y∗i ≤ m3;
Yi = 4(‘more than satisfactory level of reported species’) if y∗i ≥ m3
Let x denote the vector of explanatory variables that
influence the number of reported species y* and which are
denoted by the following model:
y∗
=
�
x
+
(4)
ordered Probit model. However, following Lambert (1992)
we use a zero-inflated Poisson (ZIP) model to measure the
relationship between disclosure on the number of species
protected and the rest of the research variables denoted as
y*, by each sample firm in the years 2012, 2014, and 2016.
The results show that buying assurance, presence of partner-
ship, environment score, and award are in line with the pre-
vious findings reported in Table 4. However, the coefficient
of Big4 is negative but not statistically significant. Overall,
13

Corporate Accountability Towards Species Extinction Protection: Insights from Ecologically…
587
we show that our results are robust with different specifica-
tions of estimations.
Further, we present the third test of robustness and divide
the sample into financial and non-financial companies (see
Table 6). The results show that buying assurance, environ-
mental score, and award from non-financial firms are in line
with previous findings.
Addressing Endogeneity
a negative binomial regression. The results are reported in
Columns 1–3 of Table 7.14 The likelihood ratio of Chi2 test
for the joint significance of independent variables is statis-
tically significant and therefore indicates a good model fit.
Overall, both the procedures qualitatively support our main
results and hypotheses.
Developing solutions and providing examples
from EC/FT companies
Our study uses a Poisson regression model to support the
hypotheses (see Table 4). However, the model is likely to
suffer from endogeneity. For instance, our sample firms
with stronger corporate governance tend to disproportion-
ally report the name of the species (source of selection bias).
In addition, the presence of stronger governance may lead
to a higher number of reported species. On the other hand,
it is also possible that firms with better awareness of B/E
tend to attract and hire more expert directors to the board
and improve their corporate governance (source of reverse
causality). The same argument is true for the environment
award variable. To deal with these issues, we use two dif-
ferent methods. Firstly, we follow Geraci et al. (2018) to
estimate our model by two-stage residual inclusion (2SRI).
Following Lin et al. (2017), we use an instrumental vari-
able, sindustry—a dummy variable equal to 1 if our sample
firms belong to environmentally sensitive industries, such
as energy, chemical, and materials, and 0 otherwise. We use
the endogenous variable environment award as a dependent
variable and sindustry and other exogenous variables (used
in Table 4) as independent variables of a logistic model (first
stage). We calculate the residual from this first stage and
include this residual in the second stage of the same Pois-
son model (as in Tables 4 and 5). The results are reported in
Column 4 of Table 7.
In the second approach, in accordance with Quigley et al.
(2019), we employ a propensity score matching (PSM) pro-
cedure to form matched sets of treated and control firms
which share a similar value on the propensity score (see
Heckman & Todd, 2009). This is also a two-step procedure.
We construct a dummy variable lgovernance equal to 1 if
a firm has a governance score less than the industry aver-
age governance score, and 0 otherwise. We run a logistic
model to estimate the probability that a firm would buy
an external assurance with weaker governance score. This
regression generates a propensity score. We follow Dehejia
and Wahba (2002) to match each treatment firm to a control
firm using the nearest neighbor algorithm with replacement
and setting the caliper to 0.25*standard error of the propen-
sity score. Appendix B shows each covariate (control vari-
ables reported) after the PSM procedure across treatment
and control firms. We re-estimate the matched sample with
From the empirical findings, we suggest how companies
can help to achieve SDGs 14 and 15 and lead future report-
ing in sustainable development. B/E accounting aligns with
wider disciplines in CSR research, such as global warming
and climate concerns. High on the economic agenda from
the COVID-19 recovery is the movement from a vulner-
able ‘business as usual’ to a sustainable ‘green recovery’,
rebalancing the human relationship with nature (Por-
ritt, 2020). Failure to provide sustainable solutions, and
if efforts to achieve the wider UN goals, including SDGs
14 and 15 are not met, the planet could be heading for an
apocalyptic crisis. We believe that due to the urgency of
the wider global environmental challenges facing humanity
(Sobkowiak et al., 2020), developing solutions is a matter
of urgency. We anticipate post COVID-19, biodiversity and
species accountability will be a core element of corporate
reporting. Companies must be responsible for committing to
achieving SDGs 14 and 15, as a failure to protect and con-
serve nature will have a catastrophic financial impact (WEF,
2020). Our results indicate that pre-COVID-19, only 25% of
companies embedded an in-depth ecological perspective and
valued species as stakeholders, which can explain positive
relations with species numbers and companies gaining assur-
ance and partnership engagement. Furthermore, our results
indicate there must be a seismic shift from poor environ-
mental performers and companies who wish to gain awards,
to consider species as stakeholders, and align with global
sustainability. Inspired by SDGs 14 and 15, we explain that
if companies collectively implement B/E reporting, this may
offer solutions for a sustainable society. As such, rethink-
ing accounting frameworks and guidelines is needed (SER,
2016), and accounting professionals need to know how they
can incorporate the B/E into their activities. For instance,
Royal Dutch Shell displays responsible disclosure:
“When we operate in critical habitats—those that are
rich in biodiversity and important to conservation—we
14 We use Pearson Chi2 test for observed and expected count frequen-
cies over time and we find that our results are statistically significant
at 5% level. This means, for instance, there is a significant relation-
ship between number of species and presence of partnership (or
environment award) Chi2 (20) = 165.014, obs-599, p < 0.00 (or C hi2
(20) = 61.72, obs-599, p < 0.00).
13

588
Table 7 Robustness tests:
addressing endogeneity
L. Roberts et al.
Dependent variable
Negative binomial regression
Number of species
(1)
(2)
(3)
2SRI
(4)
Buying assurance
Presence of partnership
Environment score
Environment award
Big 4
Green industry
Firm size
Log (revenue)
Leverage
Governance
CO2 emission
Log (forest area)
GDP growth
Inflation
Residual from 1st stage
Constant
LR C hi2
Observations
Pseudo R 2
Country fixed effects
Year fixed effects
1.694**
(0.855)
− 0.881
(0.757)
− 0.044
(0.642)
− 0.276***
(0.100)
0.945**
(0.457)
0.060
(0.047)
n.a.
− 0.155*
(0.084)
0.638***
(0.246)
− 0.575***
(0.162)
− 0.285
(0.234)
− 13.994**
(5.758)
44.90**
(0.016)
114
0.072
Yes
Yes
3.354***
(0.603)
1.056**
(0.522)
− 0.445
(0.424)
− 0.615***
(0.152)
0.757
(0.491)
− 0.043
(0.057)
n.a.
− 0.120*
(0.072)
0.182
(0.303)
− 0.168
(0.164)
− 0.420**
(0.200)
− 6.036
(6.391)
59.38***
(0.000)
114
0.151
Yes
Yes
1.488***
(0.526)
− 14.229**
(5.544)
0.277
(0.510)
− 0.398
(0.720)
− 0.309**
(0.131)
0.970*
(0.543)
0.610*
(0.360)
n.a.
− 0.310
(3.036)
3.436
(4.688)
0.081
(0.626)
0.115
(0.376)
− 45.575
(67.998)
46.38**
(0.017)
114
0.194
Yes
Yes
1.456***
(0.537)
5.004***
(0.533)
4.213***
(0.936)
− 8.838***
(1.654)
− 1.744***
(0.513)
− 0.037
(0.413)
− 0.114*
(0.064)
− 0.563*
(0.310)
− 0.001
(0.004)
7.028***
(1.723)
− 1.516***
(0.236)
1.796***
(0.342)
− 1.220***
(0.216)
0.736**
(0.305)
3.128***
(0.661)
− 28.562***
(7.855)
369
0.799
Yes
Yes
The table reports the effects of assurance, environment award, presence of partnership and green Industry
on the number of reported species in firm’s annual report in each year. The data consists 599 firm-year
observations of top 200 firms listed in Global 500 firms for the year 2012, 2014 and 2016. Green industry
is a dummy equal to 1 if the industry belongs to green industry and 1 if it is in red or amber industry. Natu-
ral logarithm of total assets as a proxy for firm size is used. Columns (1)–(3) reports Negative Binomial
regressions after using propensity score matching. Column (4) represents the 2-Stage Residual Inclusion
(2SRI) regression. Robust standard errors are reported in parenthesis
***Denotes 1%, **denotes 5% and *denotes 10% significance level
13

Corporate Accountability Towards Species Extinction Protection: Insights from Ecologically…
589
apply stringent mitigation standards. We were also the
first in the energy industry to introduce a biodiversity
standard.” (Royal Dutch Shell, company website).
This demonstrates how companies can regard species as
stakeholders by transparently disclosing their efforts for
nature to flourish. For example, Volkswagen has stated its
efforts in protecting and restoring biodiversity and species
as follows:
“In the grounds of the Volkswagen factory in Emden,
a colony of bees on the verge of extinction (Apis mil-
lifica) has been successfully established, growing from
5000 to 40,000 bees in just a short space of time. Plans
are underway to plant a further 1000 fruit trees to
ensure a plentiful supply of food for the bees.” (Volk-
swagen, CSR report, 2014).
Summary and Conclusion
The main aim of this paper is to explore the disclo-
sure of the number of species from the top 200 Fortune
Global companies to understand how EC/FT companies
are answering the collapse of biodiversity and threat of
further species extinction. We create and test with Pois-
son pseudo-maximum likelihood (PPML) regression, the
relationship between the number of species protected and
its determinant factors. Using a comprehensive sample
of Fortune Global companies from before the COVID-19
pandemic, from 2012, 2014, and 2016, our results reveal
that 75% of reports omit any species numbers, showing
that most companies are failing to address the B/E crisis.
However, the remaining 25% present how EC/FT compa-
nies have initiated efforts before the current pandemic,
which can influence companies’ reporting in the post
COVID-19 era. We contribute to developing solutions
with this empirical study by extending B/E literature and
encouraging companies to provide responsible reporting
and disclose B/E accountability to align with SDGs 14
and 15.
The empirical model is based on a comprehensive theo-
retical framework. These findings support prior B/E dis-
closure studies that have found that few companies provide
B/E information (Adler et al., 2018; Hassan et al., 2020b).
This evidences a huge call for companies to make trans-
formational changes from anthropocentrism, given the
urgency of the extinction crisis and existential threat to
civilization (Ceballos et al., 2020). The link to COVID-19
and human infringement with nature through illegal wild-
life markets and trade is inextricably linked to business
survival. Corporates are dependent on natural resources
and must cease to be disrespectful to nature and engage in
stewardship of natural assets (Jones, 1996). However, we
focus on the remaining EC/FT companies (25%) that are
responding to the extinction crisis and showing efforts to
conserve and protect habitats. Supporting deep ecology
theory and recognizing species as stakeholders, these com-
panies are displaying responsible corporate governance
by embedding deep ecological culture. Specifically, our
regression presents significant relationships between the
number of species disclosed and assurance, poor environ-
mental performers, presence of partnerships, and gaining
environmental awards (refer to Fig. 2). Our results imply
that there is a huge call for corporate consciousness and
opportunity for companies to display their responsible
efforts.
These findings make an important contribution to B/E
literature in at least four ways. First, our results suggest
assurance for B/E reporting as one important channel
through which corporate governance may influence B/E
outcomes, ascertaining a clear mechanism through which
external corporate governance may influence the firm’s
B/E reporting. Second, to our knowledge, this study is
the first to directly measure the number of species using a
comprehensive dataset. Thus, we can demonstrate a clear
positive relationship between environmental performance
(incentives for species protection) and species reporting,
contributing to the nascent but growing research investi-
gating how environmental performance and species report-
ing activities might be associated. Third, we contribute
more broadly to the literature by improving the under-
standing of the antecedents of species reporting of firms
using a cross-country sample. Fourth, this study extends
the extant B/E literature by taking species reporting into
consideration in a country-level institutional context. It has
been argued in the accounting literature that developing
economies suggest an interesting setting that explores both
regular questions in addition to a unique phenomenon (Lau
et al., 2016). Last, we suggest a reporting strategy for com-
panies to achieve wider global efforts of achieving SDGs
14 and 15 by advocating B/E accountability. Our evidence
shows that institutional context has a moderating effect on
the relationship between environment score, environment
award, assurance, and disclosure of the number of species.
These results have several implications. Our evidence
implies that businesses should begin to realize the intrin-
sic worth of natural capital and their reliance on balanced
ecosystems to survive. Embedding ecological culture and
aligning with societal and government expectation to prevent
further pandemics will be crucial for future organizational
survival. Additionally, our findings suggest that companies
13
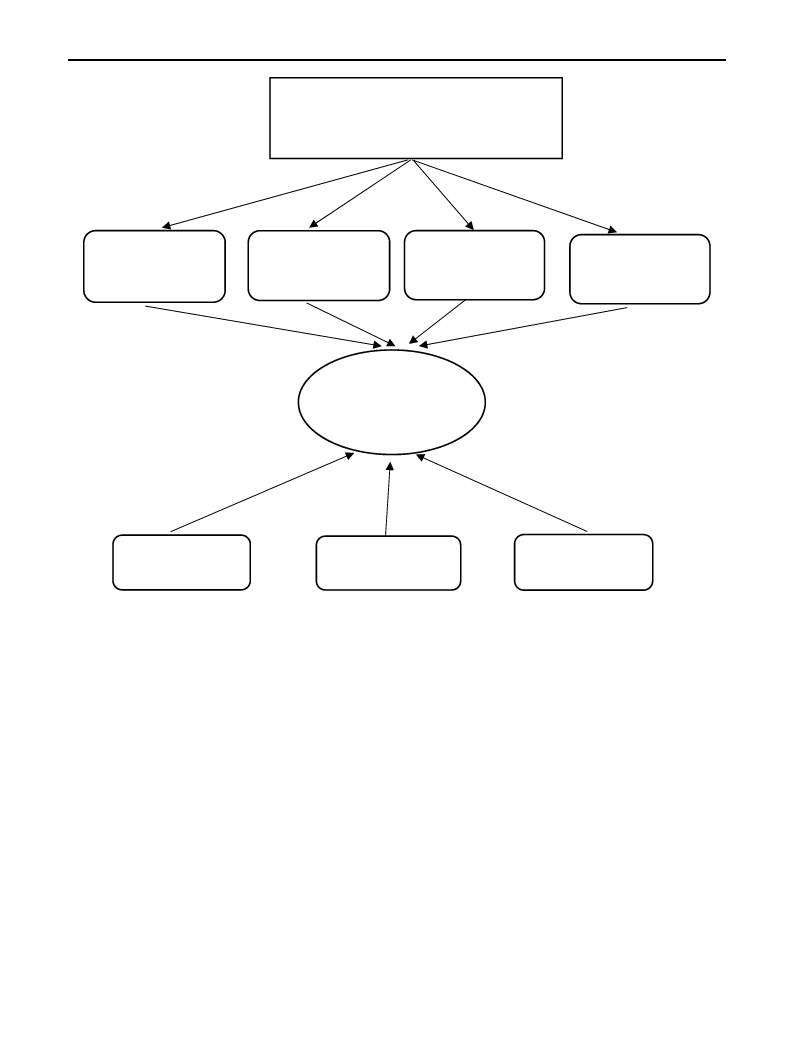
590
L. Roberts et al.
Factors influencing B/E reporting
Assurance
Environmental
Award
Environmental
Score
Presence of
Partnerships
B/E reporting
Deep -Ecology
pressures
Fig. 2 Factors influencing B/E reporting
Legitimacy
pressures
Stakeholders
pressures
who engage with wildlife partnerships are leading in the
protection of species. These results imply that partnerships
are a key driver in preventing further species extinctions and
preventing pandemics. The collaboration between wildlife
and biodiversity experts and companies can achieve long-
term sustainability and contribute to developing solutions.
Our work can also guide policymakers in developed and
developing nations to the need to improve the surveillance
and capacity of the regulatory frameworks in the context
of B/E reporting, and to improve stakeholders’ pressures to
enhance B/E reporting adoption. Specifically, policymakers
and regulators need to make a generally agreed set of B/E
reporting guidelines and assurance standards. Collectively,
the visionary SDGs can be met by the targeted 2030, as fail-
ure to meet these targets will have severe consequences to
societal health and economic systems. This research aligns
with the United Nations initiatives and post 2020 biodiver-
sity frameworks and will guide decision-makers to under-
stand how disclosure of species protection by companies can
assist society to mitigate such risks in the future.
One of the caveats of this study is that our sample is a
qualitatively small representation of a larger population
to which it could apply. Our sample selection is limited to
the top 200 companies from the Fortune Global. There-
fore, future studies could extend the number of companies
or countries. Second, counting species numerically on its
13

Corporate Accountability Towards Species Extinction Protection: Insights from Ecologically…
591
own is not enough to advance solutions. Although this
research provides a seminal understanding of the relation-
ship between species and key determinants, additional
future research might qualitatively examine corporate
motivations and emotions for such disclosure, in order
to support our findings. Third, future studies might con-
sider case-studies and interviews with executives, boards,
shareholders, and stakeholders to investigate their views
on corporate initiatives to protect species and biodiversity,
and to align with the SDGs. There is a distinct lack of
primary data analysis in B/E literature; this would provide
invaluable insights into company motivations to protect
species. Also, there are undoubtedly other factors affecting
the number of species disclosed, such as ethnic identity,
religion, country-level or industry-specific factors, which
requires an expanded dataset to consider these additional
indicators. Research on why and how companies’ engage-
ment in biodiversity loss and species extinction report-
ing differs across nations is a promising avenue for future
work. In addition, exploring the influence of ethical deci-
sion making on biodiversity loss and species extinction
reporting across cultures would be a fruitful avenue for
further work. Furthermore, a potential avenue for future
research is to investigate the alignment of B/E, circular
economy model, and integrated reporting to enhance the
development of solutions for a sustainable society.
Appendix A
Variance inflation factor (VIF)
Variable
Number of species
Buying assurance
Environment score
Green
Environment award
Presence of partnership
Big 4
Firm size
Log (revenue)
Leverage
Governance
CO2 emission
Log (forest area)
GDP growth
Inflation
VIF Tolerance
1.04 0.9593
1.56 0.6396
1.29 0.7755
1.19 0.8397
1.14 0.8799
1.27 0.7853
1.51 0.6639
1.19 0.8402
1.20 0.8306
1.03 0.9668
5.88 0.1701
2.91 0.3442
2.96 0.3381
3.24 0.3083
1.79 0.5586
Appendix B
Covariate balance of control variables
Variables Unmatched (U)/ Treated
Matched (M)
Big 4 U
M
Green U
indus-
try
M
Firm size U
M
Log (rev- U
enue)
M
Leverage U
M
CO2
U
emis-
sion
M
Log
U
(forest
area)
M
GDP
U
growth
M
Inflation U
M
0.379
0.404
0.310
0.632
12.304
12.494
11.516
11.294
2.089
1.570
9.501
11.182
13.450
13.478
3.662
3.366
1.7603
1.3614
Control
0.395
0.421
0.800
0.596
12.569
12.728
11.277
11.376
9591.4
1.429
10.808
10.663
13.269
13.393
2.473
2.794
1.466
1.603
t-test
− 0.36
− 0.19
− 12.96***
0.38
− 1.16
− 0.51
4.95***
− 0.89
− 0.63
0.09
− 2.58**
0.58
0.99
0.21
5.33***
1.18
2.18
− 1.08
Firms with low governance and high governance score for unmatched
and matched samples.
***Denotes 1%, **denotes 5% and *denotes 10% significance level.
Open Access This article is licensed under a Creative Commons Attri-
bution 4.0 International License, which permits use, sharing, adapta-
tion, distribution and reproduction in any medium or format, as long
as you give appropriate credit to the original author(s) and the source,
provide a link to the Creative Commons licence, and indicate if changes
were made. The images or other third party material in this article are
included in the article’s Creative Commons licence, unless indicated
otherwise in a credit line to the material. If material is not included in
the article’s Creative Commons licence and your intended use is not
permitted by statutory regulation or exceeds the permitted use, you will
need to obtain permission directly from the copyright holder. To view a
copy of this licence, visit http://creativecommons.org/licenses/by/4.0/.
13

592
L. Roberts et al.
References
Addison, P. F. E., Bull, J. W., & Milner-Gulland, E. J. (2019).
Using conservation science to advance corporate biodiversity
accountability. Conservation Biology, 33(2), 307–318.
Adler, R., Mansi, M., & Pandey, R. (2018). Biodiversity and threat-
ened species reporting by the top Fortune Global companies.
Accounting, Auditing and Accountability Journal, 31(3),
787–825.
Adler, R., Mansi, M., Pandey, R., & Stringer, C. (2017). United
Nations Decade on Biodiversity: A study of the reporting prac-
tices of the Australian mining industry. Accounting, Auditing
and Accountability Journal, 30(8), 1711–1745.
Atkins, J. (2020). Push to put dollar value on ESG impact. The
Business Times, available at: Push to put dollar value on ESG
impact, Companies & Markets - THE BUSINESS TIMES.
Accessed 27 December 2020.
Atkins, J. F., & Atkins, B. C. (2018). Around the World in 80 Spe-
cies. . Routledge.
Atkins, J., Gräbsch, C., & Jones, M. J. (2014). Biodiversity report-
ing: Exploring its anthropocentric nature. In M. J. Jones (Ed.),
Accounting for biodiversity (pp. 213–215). Routledge.
Atkins, J., & Maroun, W. (2018). Integrated extinction accounting
and accountability: building an ark. Accounting, Auditing and
Accountability Journal, 31(3), 750–786.
Atkins, J. F., & Maroun, W. (2020). The Naturalist’s Journals of Gil-
bert White: Exploring the roots of accounting for biodiversity
and extinction accounting. Accounting, Auditing & Account-
ability Journal, 33(8), 1835–1870.
Atkins, J., Maroun, W., Atkins, B. C., & Barone, E. (2018). From
the Big Five to the Big Four? Exploring extinction accounting
for the rhinoceros. Accounting, Auditing and Accountability
Journal, 31(2), 674–702.
Ball, A., & Craig, R. (2010). Using neo-institutionalism to advance
social and environmental accounting. Critical Perspective on
Accounting, 21(2), 283–293.
Bebbington, J., & Larrinaga, C. (2014). Accounting and sustainable
development: An exploration. Accounting, Organizations and
Society, 39(6), 395–413.
Bebbington, J., & Unerman, J. (2018). Achieving the United Nations
sustainability goals: An enabling role for accounting research.
Accounting, Auditing and Accountability Journal, 31(1), 2–24.
Belal, A., & Owen, D. L. (2015). The rise and fall of stand-alone social
reporting in a multinational subsidiary in Bangladesh. Account-
ing, Auditing & Accountability Journal, 28(7), 1160–1192.
Bhattacharya, T. R., & Managi, S. (2013). Contributions of the pri-
vate sector to global biodiversity protection: Case study of the
Fortune 500 companies. International Journal of Biodiversity
Science, Ecosystem Services and Management, 9(1), 65–86.
Bhattacharyya, A., & Yang, H. (2019). Biodiversity disclosure in
Australia: Effect of GRI and institutional factors. Australasian
Journal of Environmental Management, 26(4), 347–369.
Boiral, O. (2016). Accounting for the unaccountable: Biodiversity
reporting and impression management. Journal of Business
Ethics, 135(4), 751–768.
Boiral, O., & Heras-Saizarbitoria, I. (2017). Managing biodiversity
through stakeholder involvement: Why, who, and for what ini-
tiatives? Journal of Business Ethics, 140(3), 403–421.
Boiral, O., Heras-Saizarbitoria, I., & Brotherton, M. C. (2019). Assess-
ing and improving the quality of sustainability reports: The audi-
tors’ perspective. Journal of Business Ethics, 155(3), 703–721.
Boiral, O., Heras-Saizarbitoria, I., Brotherton, M. C., & Bernard, J.
(2018). Ethical issues in the assurance of sustainability reports:
Perspectives from assurance providers. Journal of Business
Ethics, 159(4), 1–15.
Bouten, L., Everaert, P., Van Liedekerke, L., De Moor, L., & Chris-
tiaens, J. (2011). Corporate social responsibility reporting: A
comprehensive picture? Accounting Forum, 35(3), 187–204.
Braam, G., & Peeters, R. (2018). Corporate sustainability perfor-
mance and assurance on sustainability reports: Diffusion of
accounting practices in the realm of sustainable development.
Corporate Social Responsibility and Environmental Manage-
ment, 25(2), 164–181.
Buchling, M. & Maroun, W. (2018). Extinction accounting by the
public sector. In J. Atkins, & B. Atkins (Eds.), Around the
world in 80 species (pp. 201–218) Routledge.
Business and Biodiversity Campaign. (2020). Business and Biodiver-
sity. Retrieved May 7, 2020, from https://www.business-biodi
versity.eu/en/business
Callicott, J. B. (1990). Whither conservation ethics? Conservation
Biology, 4(1), 15–20.
Callicott, J. B. (1994). Conservation values and ethics. In G. K.
Meffe, & C. R. Carroll (Eds.), Principle of conservation biol-
ogy (pp. 29–42). Sinauer and Associates.
Cameron, A. C., & Trivedi, P. K. (1990). Regression-based tests for
overdispersion in the Poisson Model. Journal of Econmetrics,
46(3), 347–364.
Carrington, D. (2020). Halt destruction of nature or suffer even worse
pandemics, say world’s top scientists. The Guardian. Retrieved
May 7, 2020, from https://www.theguardian.com/world/2020/
apr/27/halt-destruction-nature-worse-pandemics-top-scientists
Casey, R. J., & Grenier, J. H. (2015). Understanding and contribut-
ing to the Enigma of Corporate Social Responsibility (CSR)
assurance in the United States. Auditing: A Journal of Practice,
34(1), 97–130.
Ceballos, G., Ehrlich, P. R., & Raven, P. H. (2020). Vertebrates on
the brink as indicators of biological annihilation and the sixth
mass extinction. In Proceedings of the National Academy of
Sciences of the United States of America, 1–7.
Chiu, T., & Wang, Y. (2014). Determinants of social disclosure qual-
ity in Taiwan: An application of stakeholder theory. Journal of
Business Ethics, 121(1), 1–20.
Cho, C. H. (2009). Legitimation strategies used in response to envi-
ronmental disaster: A French case study of Total SA’s Erika
and AZF incidents. European Accounting Review, 18(1),
33–62.
Cho, C. H., Guidry, R. P., Hageman, A. M., & Patten, D. M. (2012). Do
actions speak louder than words? An empirical investigation of
corporate environmental reputation. Accounting, Organizations
and Society, 37(1), 14–25.
Cho, C. H., Laine, M., Roberts, R. W., & Rodrigue, M. (2015a). Organ-
ized hypocrisy, organizational façades, and sustainability report-
ing. Accounting, Organizations and Society, 40, 78–94.
Cho, C. H., Michelon, G., Patten, D. M., & Roberts, R. W. (2015b).
CSR disclosure: The more things change…? Accounting, Audit-
ing and Accountability Journal, 28(1), 14–35.
Cho, C. H., & Patten, D. M. (2007). The role of environmental dis-
closures as tools of legitimacy: A research note. Accounting,
Organizations and Society, 32(7–8), 639–647.
Cho, C. H., Patten, D. M., & Roberts, R. W. (2014). Environmental
disclosures and impression management. In R. P. Hart (Ed.),
Communication and language analysis in the corporate world
(pp. 217–231). IGI-Global Publishers.
Clarkson, P. M., Li, Y., Richardson, G. D., & Vasvari, F. P. (2008).
Revisiting the relation between environmental performance and
environmental disclosure: An empirical analysis. Accounting,
Organizations and Society, 33(4–5), 303–327.
Clarkson, P. M., Li, Y., Richardson, G. D., & Vasvari, F. P. (2011).
Does it really pay to be green? Determinants and consequences
of proactive environmental strategies. Journal of Accounting and
Public Policy, 30(2), 122–144.
13

Corporate Accountability Towards Species Extinction Protection: Insights from Ecologically…
593
Convention on Biological Diversity. (2020). Global Biodiversity
Outlook 5 Report. Retrieved December 7, 2020, from Global
Biodiversity Outlook 5, Convention on Biological Diversity
(cbd.int)
Costanza, R., De Groot, R., Sutton, P., Van Der Ploeg, S, Ander-
son, S. J., Kubiszewski, I., Farber, S., & Turner, R. K. (2014).
Changes in the global value of ecosystem services. Global
Environmental Change, 26, 152–158.
Deegan, C. (2002). Introduction: The legitimising effect of social and
environmental disclosures—A theoretical foundation. Account-
ing, Auditing & Accountability Journal, 15(3), 282–311.
Dehejia, R. H., & Wahba, S. (2002). Propensity score matching
methods for non-experimental causal studies. Review of Eco-
nomics and Statistics, 84(1), 151–161.
F&C Asset Report. (2004). Is biodiversity a material risk for com-
panies? Retrieved May 31, 2020, from http://www.businessan
dbiodiversity.org/pdf/FC%20Biodiversity%20Report%20FIN
AL.pdf
Gaia, S., & John Jones, M. (2017). UK local councils reporting of bio-
diversity values: A stakeholder perspective. Accounting, Auditing
and Accountability Journal, 30(7), 1614–1638.
Gaia, S., & Jones, M. J. (2019). Biodiversity reporting for governmen-
tal organisations: Evidence from English local councils. Account-
ing, Auditing and Accountability Journal, 33(1), 1–31.
Geraci, A., Daniele, F., & Chiara, M. (2018). Testing exogeneity of
multinomial regressors in count data model: Does two-stage
residual inclusion work? Journal of Econometric Methods, De
Gruyter, 7(1), 1–19.
Gibassier, D., Maas, K., & Schaltegger, S. (2020). Business, society,
biodiversity & natural capital. Business, strategy and the environ-
ment, Call for papers.
Giordano-Spring, S., Cho, C. H., & Patten, D. M. (2015). The norma-
tivity and legitimacy of CSR disclosure: Evidence from France.
Journal of Business Ethics, 130(4), 789–803.
Gourieroux, C., Monfort, A., & Trognon, A. (1984). Pseudo maximum
likelihood methods: Application to Poisson models. Economet-
rica, 52, 701–720.
Gray, R. (2010). Is accounting for sustainability accounting for sustain-
ability…and how would we know? An exploration of narratives
of organisations and the planet. Accounting, Organizations and
Society, 35(1), 47–62.
Gray, R., & Milne, M. J. (2018). Perhaps the Dodo should have
accounted for human beings? Accounts of humanity and (its)
extinction. Accounting, Auditing and Accountability Journal,
31(3), 826–848.
Gujarati, D. N. (2003). Student solutions manual for use with Basic
econometrics (4th ed.). McGraw-Hill.
Gürtürk, A., & Hahn, R. (2016). An empirical assessment of assurance
statements in sustainability reports: Smoke screens or enlighten-
ing information? Journal of Cleaner Production, 136(1), 30–41.
Hair, J. F., Black, W. C., Babin, B. J., & Anderson, R. E. (2013). Multi-
variate data analysis (7th ed.). Pearson Education Limited.
Haniffa, R. M., & Cooke, T. E. (2005). The impact of culture and
governance on corporate social reporting. Journal of Accounting
and Public Policy, 24, 391–430.
Haque, F., & Jones, M. J. (2020). European firms’ corporate biodiver-
sity disclosures and board gender diversity from 2002 to 2016.
British Accounting Review, 52(2), 100893.
Hassan, A., & Guo, X. (2017). The relationships between reporting for-
mat, environmental disclosure and environmental performance:
An empirical study. Journal of Applied Accounting Research,
18(4), 425–444.
Hassan, A., & Ibrahim, E. (2012). Corporate environmental informa-
tion disclosure: Factors influencing companies’ success in attain-
ing environmental awards. Corporate Social Responsibility and
Environmental Management, 19(1), 32–46.
Hassan, A., Nandy, M., & Roberts, L. (2020a). Does loss of biodiver-
sity by businesses cause Covid-19. Available at: https://www.
eauc.org.uk/does_loss_of_biodiversity_by_businesses_cause_c
Hassan, A. M., Roberts, L., & Atkins, J. (2020b). Exploring factors
relating to extinction disclosures: What motivates companies to
report on biodiversity and species protection? Business Strategy
and the Environment, 29(3), 1419–1436.
Heckman, J. J., & Todd, P. E. (2009). A note on adapting propensity
score matching and selection models to choose based samples.
The Econometrics Journal, 12(1), 230–234.
Huang, C., & Kung, F. (2010). Drivers of environmental disclosure
and stakeholder expectation: Evidence from Taiwan. Journal of
Business Ethics, 96(3), 435–451.
IPBES. (2019). Global assessment report on biodiversity and eco-
system services of the Intergovernmental Science-Policy Plat-
form on Biodiversity and Ecosystem Services. E. S. Brondizio,
J. Settele, S. Díaz, and H. T. Ngo (editors). IPBES secretariat,
Bonn, Germany. Available at: https://i pbes.n et/g lobal-a ssess ment
Johnson, C. K., Hitchens, P. L., Pandit, P. S., Rushmore, J., Evans, T.
S., Young, C. C. W., Doyle, M. M., & Johnson, C. K. (2020).
Global shifts in mammalian population trends reveal key predic-
tors of virus spillover risk. Proceedings of the Royal Society B.
https://doi.org/10.1098/rspb.2019.2736.
Jones, M. J. (1996). Accounting for biodiversity: A pilot study. British
Accounting Review, 28(4), 281–303.
Jones, M., & Solomon, J. (2013). Problematising accounting for biodi-
versity. Accounting, Auditing and Accountability Journal, 26(5),
668–687.
Jones, T. M. (1995). Instrumental stakeholder theory: A synthesis of
ethics and economics. Academy of Management Review, 20(2),
404–437.
Junior, R. M., Best, P. J., & Cotter, J. (2014). Sustainability reporting
and assurance: A historical analysis on a world-wide phenom-
enon. Journal of Business Ethics, 120(1), 1–11.
Kaufmann, D., Kraay, A., & Mastruzzi, M. (2011). The worldwide gov-
ernance indicators: Methodology and analytical issues. Hague
Journal on the Rule of Law, 3(2), 220–246.
King, M. & Atkins, J. (2016). Chief Value Officer. Greenleaf
Publishing.
Kolk, A., & Perego, P. (2010). Determinants of the adoption of sus-
tainability assurance statements: An international investigation.
Business Strategy and the Environment, 19(3), 182–198.
KPMG. (2017). The road ahead—The KPMG survey of Corporate
Responsibility Reporting 2017, Retrieved April 28, 2020, from
https://assets.kpmg/content/dam/kpmg/xx/pdf/2017/10/execu
tive-summary-the-kpmg-survey-of-corporate-responsibility-
reporting-2017.pdf
Lambert, D. (1992). Zero-inflated Poisson regression, with an applica-
tion to defects in manufacturing. Technometrics, 34, 1–14.
Lambooy, T. E., Maas, K. E. H., van ‘t Foort, S., & van Tilburg, R.
(2018). Biodiversity and natural capital: Investor influence on
company reporting and performance. Journal of Sustainable
Finance & Investment, 8(2), 158–184.
Lau, C., Lu, Y., & Liang, Q. (2016). Corporate social responsibility in
China: A corporate governance approach. Journal of Business
Ethics, 136, 73–87.
Lewis, J. K. (2016). Corporate social responsibility/sustainability
reporting among the fortune global 250: Greenwashing or green
supply chain? Entrepreneurship, Business and Economics, 1(5),
347–362.
Lin, K. Z., Cheng, S., & Zhang, F. (2017). Corporate social responsibil-
ity, institutional environments, and tax avoidance: Evidence from
a subnational comparison in China. The International Journal of
Accounting, 52, 303–318.
Luo, L., Lan, Y. C., & Tang, Q. (2012). Corporate incentives to disclose
carbon information: Evidence from the CDP Global 500 Report.
13

594
L. Roberts et al.
Journal of International Financial Management and Accounting,
23(2), 93–120.
Lyon, T. P., & Maxwell, J. W. (2011). Greenwash: Corporate environ-
mental disclosure under threat of audit. Journal of Economics &
Management Strategy, 20(1), 3–41.
Ma, B., Xie, Y., Zhang, T., Zeng, W., & Hu, G. (2020). Identification
of conflict between wildlife living spaces and human activity
spaces and adjustments in/around protected areas under climate
change: A case study in the Three-River Source Region. Journal
of Environmental Management, 262, 110322.
Mahoney, L. S., Thorne, L., Cecil, L., & LaGore, W. (2013). A research
note on standalone corporate social responsibility reports: Sig-
nalling or greenwashing? Critical Perspectives on Accounting,
24(4–5), 350–359.
Maroun, W. (2018). A conceptual model for understanding corporate
social responsibility assurance practice. Journal of Business Eth-
ics, 161, 187–209.
Maroun, W., & Atkins, J. (2018). The emancipatory potential of extinc-
tion accounting: Exploring current practice in integrated reports.
Accounting Forum, 42(1), 102–118.
Maroun, W., Usher, K., & Mansoor, H. (2018). Biodiversity reporting
and organised hypocrisy, the case of the South African food and
retail industry. Qualitative Research in Accounting & Manage-
ment, 15(4), 437–464.
Milne, M. J., & Gray, R. (2013). W(h)ither ecology? The triple bottom
line, the global reporting initiative, and corporate sustainability
reporting. Journal of Business Ethics, 118(1), 13–29.
Næss, A. (1989). Ecology. . Cambridge University Press.
Næss, A. (2008). Ecology of wisdom. Publishers Group West.
Natural Capital Coalition. (2020). Natural Capital. Retrieved May 8,
2020, from https://naturalcapitalcoalition.org/natural-capital-2/
Nguyen, T., Locke, S., & Reddy, K. (2015). Ownership concentration
and corporate performance from a dynamic perspective: Does
national governance quality matter?. International Review of
Financial Analysis, 41, 148–161.
Odriozola, M., & Baraibar-Diez, E. (2017). Is corporate reputation
associated with quality of CSR reporting? Evidence from Spain.
Corporate Social Responsibility and Business Management,
24(2), 121–132.
Patten, D. (2002). The relation between environmental performance
and environmental disclosure: A research note. Accounting,
Organizations and Society, 27(8), 763–773.
Patten, D. M. (2015). An insider’s reflection on quantitative research
in the social and environmental disclosure domain. Critical Per-
spective on Accounting, 32(1), 45–50.
Perego, P., & Kolk, A. (2012). Multinationals’ accountability on sus-
tainability: The evolution of third-party assurance of sustainabil-
ity reports. Journal of Business Ethics, 110(2), 173–190.
Peters, G. F., & Romi, A. M. (2015). The association between sustain-
ability governance characteristics and he assurance of corporate
sustainability reports. Auditing: A journal of Practice, 34(1),
163–198.
Pflugrath, G., Roebuck, P., & Simnett, R. (2011). Impact of Assur-
ance and Assurer’s Professional Affiliation on Financial Ana-
lysts’ Assessment of credibility of corporate social responsibility
information. Auditing: A Journal of Practice, 30(3), 239–254.
Porritt, J. (2020). We must not miss this glorious chance to address
the biodiversity and climate crises. The Guardian. Retrieved
August 20, 2020, from https://www.theguardian.com/comme
ntisfree/2020/jun/24/climate-biodiversity-crises-government-
green-recovery-coronavirus
PWC, & WWF. (2020). Nature is too big to fail. Retrieved May 7,
2020, from https://www.pwc.ch/en/publications/2020/nature-is-
too-big-to-fail.pdf
Quigley, T. J., Hambrick, D. C., Misangyi, V. F., & Rizzi, G. A. (2019).
CEO selection as risk-taking: A new vantage on the debate about
the consequences of insiders versus outsiders. Strategic Manage-
ment Journal, 40, 1453–1470.
Raar, J., Barut, M., & Azim, M. I. (2020). The challenge: Re-steering
accountability concepts to incorporate biodiversity management
and reporting. Sustainability, Accounting, Management and Pol-
icy Journal, 11(1), 1–30.
Reade, C., Thorp, R., Goka, K., Wasbauer, M., & McKenna, M. (2015).
Invisible compromises: Global business, local ecosystems, and
the commercial bumble bee trade. Organization and Environment,
28(4), 436–457.
Rimmel, G., & Jonäll, K. (2013). Biodiversity reporting in Sweden:
Corporate disclosure and preparers’ views. Accounting, Auditing
and Accountability Journal, 26(5), 746–778.
Roberts, L., Hassan, A., Elamer, A., & Nandy, M. (2020). Biodiversity
and extinction accounting for sustainable development: A system-
atic literature review and future research developments. Business
Strategy and the Environment, 30(1), 705–720.
Roberts, L., Hassan, A., Nandy, M., & Elamer, A. (2020a). Nursing
both the Covid 19 and Biodiversity Crisis together. Available at:
https://w ww.e auc.o rg.u k/n ursin g_b oth_t he_c ovid_1 9_a nd_b iodi
versit y_cris
Samkin, G., Schneider, A., & Tappin, D. (2014). Developing a reporting
and evaluation framework for biodiversity. Accounting, Auditing
and Accountability Journal, 27(3), 527–562.
Sandifer, P. A., Sutton-Grier, A. E., & Ward, B. P. (2015). Exploring
connections among nature, biodiversity, ecosystem services, and
human health and well-being: Opportunities to enhance health
and biodiversity conservation. Ecosystem Services, 12, 1–15.
Santos Silva, J. M. C., & Tenreyro, S. (2011). Further simulation evi-
dence on the performance of the Poisson pseudo-maximum likeli-
hood estimator. Economics Letters, 112, 220–222.
Schaltegger, S., Hörisch, J., & Freeman, R. E. (2017). Business cases for
sustainability: A Stakeholder Theory Perspective. Organization
& Environment, 32(3), 191–212.
SER. (2016). Werken aan een circulaire economie: geen tijd te verliezen.
Sociaal-Economische Raad.
Simnett, R., Vanstraelen, A., & Chua, W. F. (2009). Assurance on sus-
tainability reports: An international comparison. The Accounting
Review, 84(3), 937–967.
Skouloudis, A., Malesios, C., & Dimitrakopoulos, P. G. (2019). Cor-
porate biodiversity accounting and reporting in mega-diverse
countries: An examination of indicators disclosed in sustainability
reports. Ecological Indicators, 98, 888–901.
Smith, T., Paavola, J., & Holmes, G. (2019). Corporate reporting and
conservation realities: Understanding differences in what busi-
nesses say and do regarding biodiversity. Environmental Policy
and Governance, 29(1), 3–13.
Sobkowiak, M., Cuckston, T., & Thomson, I. (2020). Framing sus-
tainable development challenges: Accounting for SDG-15 in
the UK. Accounting, Auditing & Accountability Journal, 33(7),
1671–1703.
Solomon, J. F., Solomon, A., Joseph, N. L., & Norton, S. D. (2013).
Impression management, myth creation and fabrication in private
social and environmental reporting: Insights from Erving Goff-
man. Accounting, Organizations and Society, 38(3), 195–213.
Spaiser, V., Ranganathan, S., Swain, R. B., & Sumpter, D. J. T. (2017).
The sustainable development oxymoron: Quantifying and model-
ling the incompatibility of sustainable development goals. Inter-
national Journal of Sustainable Development & World Ecology,
24(6), 457–470.
Stephan, U., Uhlaner, L. M., & Stride, C. (2015). Institutions and social
entrepreneurship: The role of institutional voids, institutional sup-
port, and institutional configurations. Journal of International
Business Studies, 46(3), 308–331.
Tagesson, T., Blank, V., Broberg, P., & Collin, S. (2009). What explains
the extent and content of social and environmental disclosures on
13

Corporate Accountability Towards Species Extinction Protection: Insights from Ecologically…
595
corporate websites: A study of social and environmentl reporting
in Swedish listed corporations. Corporate Social Responsibility
and Environmental Management, 1(6), 352–364.
The World Bank.. (2020). Biodiversity. Retrieved May 7, 2020, from
https://www.w orldbank.o rg/en/topic/b iodiversity#1
Thompson, S. C., & Barton, M. A. (1994). Ecocentric and anthropocen-
tric attitudes toward the environment. Journal of Environmental
Psychology, 14(2), 149–157.
Tilling, M. V., & Tilt, C. A. (2010). The edge of legitimacy: Voluntary
social and environmental reporting in Rothmans’ 1956–1999
annual reports. Accounting, Auditing & Accountability Journal,
23(1), 55–81.
United Nations. (2020a). Retrieved May 15, 2020, from https://www.
unenvironment.org/news-and-stories/story/2020-crunch-year-
biodiv ersit y-a nd-c limate-emergencies
United Nations. (2020b). Transforming our world: The 2030 agenda for
sustainable development. Retrieved August 14, 2020, from https://
sdgs.u n.o rg/2 030agenda
van Liempd, D., & Busch, J. (2013). Biodiversity reporting in Den-
mark. Accounting, Auditing and Accountability Journal, 26(5),
833–872.
Waldron, A., Miller, D. C., Redding, D., Mooers, A., Kuhn, T. S., Nib-
belink, N., Roberts, J. T., Tobias, J. A., & Gittleman, J. L. (2017).
Reductions in global biodiversity loss predicted from conserva-
tion spending. Nature, 551, 364–367.
WEF. (2020). The World Economic Forum. The Global Risk Report
2020. Retrieved May 4, 2020, from https://www.weforum.org/
reports/the-g lobal-risks-report-2 020
Weir, K. (2018). The purposes promises and compromises of extinction
accounting in the UK public sector. Accounting, Auditing and
Accountability Journal, 31(3), 875–899.
WHO. (2020). Climate change and human health. Retrieved August
14, 2020, from https://www.who.int/globalchange/ecosystems/
biodiv ersit y/en/
Zhao, L., & Atkins, J. (2018). Panda accounting and accountability.
In J. Atkins, & B. Atkins (Eds.), Around the world in 80 species
(pp. 359–388). Routledge.
Zijl, V. W., Wostmann, C., & Maroun, W. (2017). Strategy disclosures
by listed financial services companies: Signalling theory, legiti-
macy theory and. South African Integrated Reporting Practices,
48(3), 73–85.
Publisher’s Note Springer Nature remains neutral with regard to
jurisdictional claims in published maps and institutional affiliations.
13