

International Journal of
Environmental Research
and Public Health
Article
Traditional Korean Medicine-Based Forest Therapy
Programs Providing Electrophysiological Benefits for
Elderly Individuals
Jiyune Yi 1, Boncho Ku 2, Seul Gee Kim 2 , Taegyu Khil 1, Youngsuwn Lim 1, Minja Shin 1,
Sookja Jeon 1, Jingun Kim 1, Byunghoon Kang 1, Jongyeon Shin 1, Kahye Kim 2,
Ah Young Jeong 1, Jeong Hwan Park 2, Jungmi Choi 3 , Wonseok Cha 3 , Changseob Shin 1,
Wonsop Shin 1,* and Jaeuk U. Kim 2,*
1 Department of Forest Therapy, Graduate School of Chungbuk National University, Chungju,
Chungbuk 28644, Korea; jiyuneyi@gmail.com (J.Y.); ktg0704@hanmail.net (T.K.); suwnmail@naver.com (Y.L.);
yeamolove@hanmail.net (M.S.); dawon0619@hanmail.net (S.J.); jingun0308@naver.com (J.K.);
byunghoon21@naver.com (B.K.); sjaksdmf5252@naver.com (J.S.); honggilyue@naver.com (A.Y.J.);
sinna@chungbuk.ac.kr (C.S.)
2 Korea Institute of Oriental Medicine, Daejeon 34054, Korea; secondmoon@kiom.re.kr (B.K.);
sgkim11@kiom.re.kr (S.G.K.); kkh2@kiom.re.kr (K.K.); siegfriegd@kiom.re.kr (J.H.P.)
3 Human Anti-Aging Standards Research Institute, Uiryeong, Gyungnam 52151, Korea;
jmchoi@brnd.co.kr (J.C.); danho@brnd.co.kr (W.C.)
* Correspondence: shinwon@chungbuk.ac.kr (W.S.); jaeukkim@kiom.re.kr (J.U.K.);
Tel.: +82-42-868-9558 (J.U.K.); +82-43-261-2536 (W.S.)
Received: 19 September 2019; Accepted: 29 October 2019; Published: 6 November 2019
Abstract: We aimed to develop forest therapy programs (FTPs) to prevent dementia and related
health problems in the elderly population, with the assumption that health benefits are FTP-type
specific and depend on the participant’s psychophysiological traits. For this purpose, we developed
two distinct FTPs, namely, a guided-breathing meditation program (BP) and a walking program (WP);
we adopted the approach of Sasang constitutional (SC) medicine, which categorizes individuals into
one of three SC types (SC1, SC2, or SC3) for medical care. The FTPs ran 11 sessions over 11 weeks.
We recruited 29/31/28 participants who were 65 years of age or older for the BP/WP/control groups,
respectively; obtained electrophysiological measurements via electroencephalogram (EEG), heart
rate variability (HRV), and bioimpedance; and analyzed the intervention effects with analysis of
covariance. Compared with the control, the BP and WP resulted in benefits for neural activity and
parasympathetic nervous activity (PNA), respectively, and both FTPs yielded distinct beneficial effects
on bioimpedance. Constitution-specific effects were also present. The SC1- and SC2-type participants
gained positive effects in neural activity from the BP and WP, respectively. The SC3-type participants
showed improvements in PNA from the WP. In conclusion, for older individuals, both programs
conferred health benefits that would help prevent dementia, and the benefits were program-specific
and constitution-specific.
Keywords: forest therapy; cognitive impairment; dementia; breathing program; walking program;
Sasang constitutional medicine; electrophysiology; EEG; HRV; bioimpedance
1. Introduction
The aging of society is a global issue, and South Korea became a member of the ‘aged societies’ as
the proportion of its total population accounted for by the elderly population over 65 years reached
14.2% in the ‘2017 Population and Housing Census’ [1]. Along with the increase in the elderly
Int. J. Environ. Res. Public Health 2019, 16, 4325; doi:10.3390/ijerph16224325
www.mdpi.com/journal/ijerph

Int. J. Environ. Res. Public Health 2019, 16, 4325
2 of 20
population, degenerative health problems and the related medical costs have become socioeconomic
concerns. In particular, the impact of the growing number of people with dementia challenges national
and global public health systems [2]. According to the World Health Organization (WHO), the number
of individuals with dementia is expected to triple from 50 million to 152 million by 2050, and the global
cost of caring for people with dementia was estimated to be US$ 818 billion, which is approximately
1.1% of the global gross domestic product [3]. This report estimates that the cost could be US$ 2 trillion
by 2030. Because there is no cure for dementia, the role played by preventive medicine with diverse
interventions such as physical exercise, cognitive interventions, social activities, and activities in nature
for the elderly population will increase substantially [4].
Studies show that interacting with nature improves the physical and mental health of people [5–10], and
forest therapy is gaining more recognition as a nature-based therapy [11–13]. The term “forest therapy”
has been used interchangeably with more traditionally defined “forest bathing” or “Shinrin-yoku”.
The effects of forest bathing on human immune function and physiology are well reported in the
literature [12,14–16]. According to Li et al. [14], a forest bathing trip “involves a visit to a forest field
for the purpose of relaxation and recreation” and Park et al. [16] defined the term as “making contact
with nature and taking in the atmosphere of the forest: a process intended to improve an individual’s
state of mental and physical relaxation”. In these studies, the activities associated with forest bathing
are mainly walking, spending time, or simply remaining in the forest environment. More recently,
authors have often distinguished forest therapy from forest bathing as a strengthened form added
by guided practices programs that could facilitate participant engagement with various therapeutic
activities in the forest for restoration, rehabilitation, and wellness [17–19].
The conditions on which forest therapy can have beneficial effects include anxiety, depression,
mood disorders, stress-related symptoms, hypertension, cancer, immune functions, and cognitive
function; the various conditions on which forest therapy or forest bathing have therapeutic effects
continue to appear in new studies. Among them, depression, hypertension, physical inactivity,
diabetes, and obesity are known risk factors for dementia [20]. Therefore, in aged societies, forest
therapy programs (FTPs) can play an important role as a preventive or therapeutic intervention for
older adults with normal cognition or mild cognitive impairment. In Korea, forest therapies with
older populations are of recent interest, but only a few articles exist [21]; the evidence levels are low
because of small numbers of participants, preliminary study designs, or short program hours. For the
elderly population, lower mobility and degraded physical and cognitive abilities make the forest less
accessible, and recent forest therapies performed with older Korean populations have been mostly
based on urban forests. Some authors have reported the benefits of depression and stress relief [22,23];
improved resilience, depression, stress, and quality of life [24]; increases in blood melatonin levels [25];
and improved functional fitness and gait patterns [26]. The studies examining the beneficial effects of
FTPs for older people are limited [27,28], and little is known about FTPs as a preventive intervention
for dementia.
In this work, we aimed to develop FTPs that can be run in urban forest areas for the elderly
population to prevent cognitive decline. We hypothesized that different characteristic activities in
the forest may induce different health promotion effects and that these effects may also depend on
the participant’s psychological preferences and physiological susceptibilities to activity types. To
test both hypotheses, we developed two different characteristic FTPs and analyzed the effects of the
FTPs on constitution-specific subgroups by following the approach of Sasang constitutional medicine
(SCM), in which participants are categorized into one of three Sasang constitutional (SC) types [29,30].
Second, we measured the risk factors for dementia based on electrophysiological methods such as an
electroencephalogram (EEG) for brain function, heart rate variability (HRV) for autonomic nervous
function, and bioimpedance for body composition and cellular metabolic status. Electrophysiological
assessments provide objective outcomes, and they are noninvasive, portable, cost-effective, and easy
to implement in the field of forest therapy. More studies are needed regarding the utility of various
electrophysiological analyses as assessment methods for diverse FTPs.

Int. J. Environ. Res. Public Health 2019, 16, 4325
3 of 20
2. Materials and Methods
2.1. FTPs
We developed two FTPs that were two hours long on average per daily session (10:00~12:00) for
a total of 11 sessions with one session per week. In choosing an appropriate program duration and
session hours for the prevention of dementia, appropriate references are not sufficient in the field of
forest therapy. According to a recent meta-analysis, an exercise training period targeting cognitive
function in older adults with mild cognitive impairment (MCI) had a range of 6 weeks to 52 weeks of
intervention with one session to three sessions per week and 30 min to 90 min per session, and the
effects of these benefits were not conclusive [31]. A recent random clinical trial performed for elderly
individuals with MCI used a 12-week resistance exercise program with two sessions per week and one
hour per session; the study reported a positive effect on the EEG along with some physical benefits [32].
In recent papers regarding forest therapy for elderly individuals, a 12-week program with one session
per week and two hours per session was developed [22,23,25]. In our pilot study, we assumed that
the participants would obtain combined benefits from the guided exercise and healing-relaxation
components by activities in the forest, and thus chose the minimal number of intervention hours
necessary for the least beneficial effects on cognitive and physiological functions for the elderly.
To increase the effectiveness of the FTPs, we adopted some therapeutic modalities from traditional
Korean medicine (TKM) [33]. The first program is called the “Walking Program (WP)”, and its key
design point is active walking in the forest to induce sweating and stimulate the acupuncture point
of Yongquan (K11) during walking; this acupuncture point is known to benefit cognitive decline,
hypertension, blood circulation, and sleep problems, among other conditions [34,35]. The second
program is called the “Breathing Program (BP)”, and its key design point is guided-breathing meditation
with the simultaneous stimulation of the cervical spine so that the cervical spine is aligned in its
optimal posture, which is known to activate the therapeutic Qi and blood flow through the meridian
system in TKM [36]; stimulation of the cervical spine is known to increase cerebral blood flow and
reduce neuropathic upper limb pain [37,38], among other health-promotion effects. Both FTPs were
designed to promote the cognitive and physical health status of the elderly population, and the BP was
especially designed as an appropriate FTP for individuals who have difficulties engaging in active
physical exercises in nature. Each program was conducted in urban forests located in Cheongju City,
Korea (M-forest and B-forest), which were easily accessible by nearby urban dwellers.
The WP consisted of 30 min of preparatory activities, 50 min of forest walking, 20 min of muscle
training with a stretchable band, and 20 min of closing activities. The preparation activities consisted
of different types of clapping (fist, bud, hand, egg, and fingertip); tapping the whole body and several
acupuncture points known for dementia prevention, such as Baihui (GV20), Shenting (GV24), Fengchi
(GB20), and Taixi (KI3) [39]; and getting acquainted with nature. Participants taped red beans at Yongquan
(K11) [34] to both feet so that the Yongquan could be stimulated by acupressure during walking, and
they walked at a tempo that was perceived as slightly intense exercise (13 to 14 points on the Borg rating
of perceived exercise in the first three sessions, increasing up to 16~17 points in later sessions [40]).
The BP consisted of 30 min of a preparatory session, 30 min of guided-breathing meditation,
20 min of slow forest walking, 20 min of muscle training with a stretchable band, and 20 min of closing
activities. The major difference from the WP was the guided-breathing meditation session. It consisted
of three guided-breathing parts with different postures and motions, with deep breathing in and out
(hypogastric breathing), and induced the stimulation of the cervical spine so that the cervical spine
could be aligned towards its optimal posture to activate the therapeutic Qi and blood flow through the
meridian system [36] and to increase the cerebral blood flow and cognitive improvement [37].
2.2. Sasang Constitutional Medicine
SCM is a branch of TKM and is well established as a standard diagnosis and treatment modality [41].
SCM classifies individuals into one of four SC types, namely, Tae-Eum (TE, Greater Yin), So-Eum (SE,

Int. J. Environ. Res. Public Health 2019, 16, 4325
4 of 20
Lesser Yin), So-Yang (SY, Lesser Yang), or Tae-Yang (TY, Greater Yang), and describes the respective
physiology, pathology, therapeutic, and health preservation methods [29,30]. According to the theory
of SCM, the type-specific clinical symptoms include indigestion, sweat, sleep, urination, and defecation,
along with other biopsychological traits. The TY type and TE type are in seesaw relation, and the SY
type and SE type are in another seesaw relation with regard to the underlying metabolism. The TY
type features strong sympathetic activation, but weak anabolism and energy storage, whereas the TE
type features strong anabolism and energy savings, but weak sympathetic activation. On the other
hand, the SY type is strong in food intake and digestion, but weak in waste discharge, and the SE type
is strong in waste discharge, but weak in food intake and digestion [42].
As a recent study reported that the TE-type population accounted for 39.2% of the total
3700 participants, the SE type accounted for 27.1%, the SY type accounted for 33.7%, and the
TY type accounted for less than 0.1% in Korea [43]—modern clinical reports on the TY type are very
rare. For this reason, the KS-15 questionnaire, which we used to classify the SC types, is a short form
with only 15 questions used to classify individuals into the TE, SE, or SY type [44]. As the major features
of SCM are described in detail in some classic books and review papers (e.g., the works of [41,45]),
we would like to address some weak features of each SC type related to the assumptions involved in
composing FTPs. For the TE type, perspiration is a sign of good health, and the absence of perspiration
is an unhealthy sign. The SY type is characterized by a hot, unstable, and easily bored temperament
and less developed muscles in the lower body parts. On the other hand, the SE type features a negative
and nervous mind and less developed muscles in the upper body [29]. We hypothesized that the FTP
would be more effective if it can complement or improve the weak psychophysiological features of
each SC type, as follows: a low or intermediate intensity of exercise, with upper body exercises, or
meditative walk for the SE type; walking/strolling, breathing control, meditation, and lower body part
exercises for the SY type; and intermediate to strenuous exercise that induces sweating for the TE type.
2.3. Subjects and Study Protocol
The FTPs ran from 8 August 2018 to 14 November 2018. We aimed to recruit 30 participants for
each FTP, with a total of 90 elderly participants aged 65 years or older, including 30 participants in
the control group (CN) (30 participants in the WP, 30 in the BP, and 30 in the CN). In this study, the
participants in the control group received no intervention or treatment related with activities in the
forest. Participants were volunteer county dwellers satisfying the following criteria:
• not diagnosed with dementia
• without any restrictions on outdoor activity, including walking for more than three hours
• able to communicate and complete the self-reporting questionnaires
• understand the purpose of the study and having voluntarily submitted a consent form.
Before participation in the FTPs, we conducted several questionnaires to examine the general
health status of the participants. We acquired basic demographic information that could affect cognitive
and physical health and the Korean instrumental activities of daily living (K-IADL) to eliminate
participants with functional disabilities owing to neurodegenerative diseases [46]. For the subgroup
analysis, we used the KS-15, which is a short form of the Sasang constitution classification [44]. We
also used a Korean version of the geriatric depression scale (GDS) [47,48] and a cold–heat pattern
identification questionnaire; these will be discussed elsewhere.
Electrophysiological measurements were carried out at the baseline and after completing all the
sessions of the FTPs. For the cognitive test, we used the Mini Mental-Status Examination for Dementia
Screening (MMSE-DS) [49], an extensively used Korean version of the Mini Mental-Status Examination
(MMSE) to assess the global cognitive status, and a neurocognitive test with the resting-state EEG. For the
activation of the autonomic nervous system (ANS), we measured the HRV by photoplethysmography
(PPG). Finally, we measured the bioimpedance to estimate the general body composition factors,
including body fat mass; fat-free mass; total body water; and lower level information, such as resistance,
Int. J. Environ. Res. Public Health 2019, 16, 4325
5 of 20
reactance, and phase angle at 50 kHz. For comparison, the pre- and post-measurements were recorded
for the CN as well.
Participants were recruited through advertisements and phone calls in cooperation with two
county health centers (H-gu and S-gu) and a local senior citizen club (H senior club). Written informed
consent was obtained from each subject prior to study participation. The study was approved by the
Institutional Review Board of Chungbuk National University (IRB number: CBNU-201808-SB-678-01).
2.4. Electrophysiological Measurements
For the neurophysiological measurement, we used a wireless EEG device (neuroNicle FX2,
LAXTHA, Inc., Korea) to measure the electrical activities in the prefrontal regions of Fp1 and Fp2 in
the International 10/20 electrode system with a reference electrode on the right earlobe. The sampling
rate was 250 Hz, the bandpass frequency was 3 to 43 Hz, and all contact impedances were kept
beloΩw 10 kΩ. Subjects were seated in a comfortable position in a resting state with their eyes closed
and muscles relaxed, and the EEG was recorded for five minutes in a quiet environment. A trained
operator monitored the subject and EEG traces and alerted the subject whenever he/she showed signs
of behavioral artifact or EEG drowsiness [50].
For the HRV measurement, we used a PPG device (ubpulse T1, LAXTHA, Inc., Korea). Subjects
underwent PPG recordings on the fingertip for five minutes in a comfortable seated position in a
resting state. The sampling rate was 250 Hz and the bandpass frequency was 0.3 to 10.6 Hz.
Bioelectrical impedance was measured using a bioimpedance analysis (BIA) device (InBody S-10,
InBody, Korea), which measures impedance data with a direct segmental multifrequency method. We
measured the impedance and reactance at three frequencies, namely, 5, 50, and 250 kHz. The phase
angle (PhA) was defined by the angle between the impedance and reactance according to the following
equation:
PhA
PhaArc=sina(rrcesaicnt(arneacceta/nicme/peimdapnecned)anc1e8)0×
◦
/180
/π
(1)
Eight electrodes were used to measure five segmental impedance datapoints in the body; four
were in contact with the thumbs and index fingers of each hand, and the other four were in contact
with the interior and exterior sides of each ankle. The bioimpedance was measured with the subjects
in a supine position. Four operators were adequately trained for the measurement of EEG, PPG, and
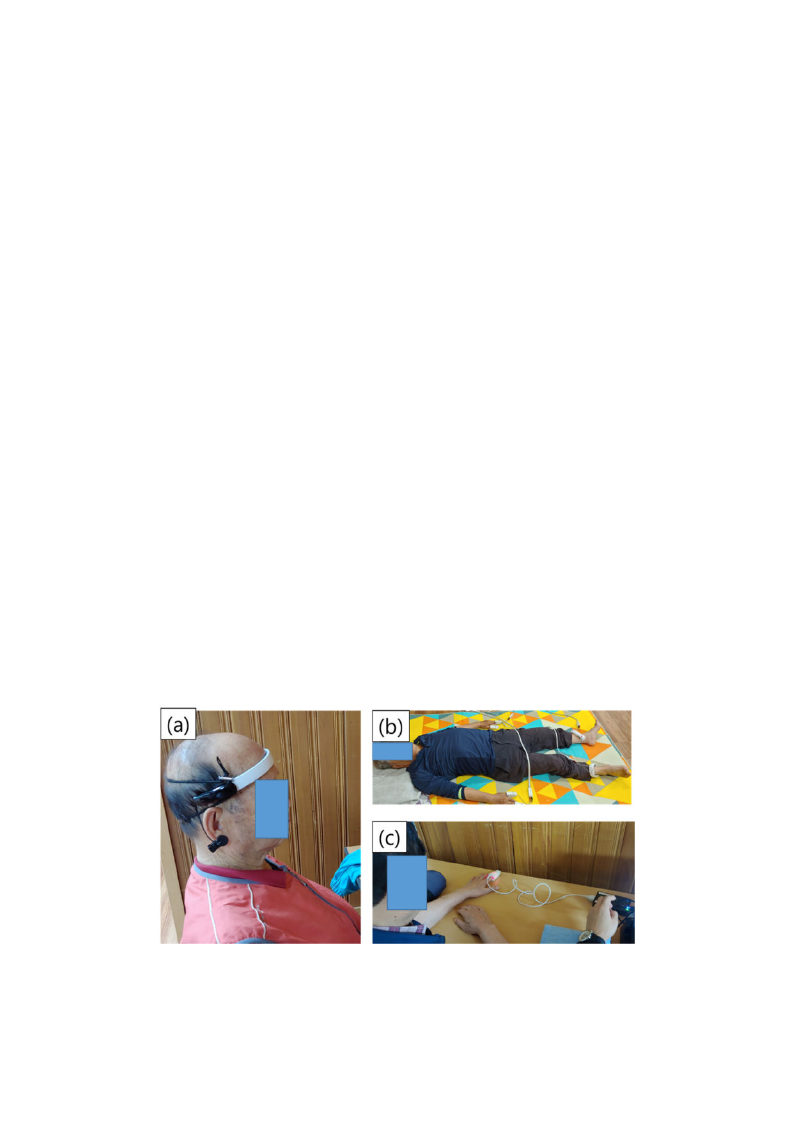
bioimpedance. Figure 1 shows images of the EEG, bioimpedance, and HRV measurements, and Table 1
shows the analytical variables from each device.
Figure 1. Photographs of the (a) electroencephalogram (EEG), (b) bioimpedance, and (c)
photoplethysmography (PPG) measurement process.

Int. J. Environ. Res. Public Health 2019, 16, 4325
6 of 20
Table 1. Datasets and characteristic variables to be analyzed. EEG, electroencephalogram;
PPG, photoplethysmography.
Dataset
EEG
Bioimpedance
HRV
Variable
MEF [Hz]
Pα [µV2]
Pβ [µV2]
ATR
FFM [kg]
BFM [kg]
%BF [%]
PhA_body
Imp_arm [Ω]
Imp_leg [Ω]
Reactance_arm [Ω]
Reactance_leg [Ω]
PhA_arm
PhA_leg
HF [msec2]
LF [msec2]
%LF
HR [bpm]
Explanation
Median frequency: the median frequency in the dominant intrinsic
oscillatory frequency band of 4–13 Hz of the power spectrum
Alpha band power: The spectral power integrated over the frequency
range between 8 and 13 Hz (natural logarithmic scale)
Beta band power: The spectral power integrated over the frequency range
between 13 and 30 Hz (the natural logarithmic scale)
Alpha/theta ratio: the power ratio of alpha rhythms (8–13 Hz) to theta
rhythms (4–8 Hz)
Fat-free mass
Body fat mass
Percent body fat (body fat/whole body mass)
Phase angle of the whole body = (reactance of the whole
body)/(impedance of the whole body)
Impedance averaged over both arms
Impedance averaged over both legs
Reactance averaged over both arms
Reactance averaged over both legs
Phase angle of both arms
Phase angle of both legs
Spectral power in the high frequency (HF) range of HRV (0.15–0.4 Hz)
Spectral power in the low frequency (LF) range of HRV (0.04–0.15 Hz)
LF power/(LF+HF power)
Heart rate
2.5. Statistical Analysis
Statistical analyses were conducted using R statistical software (ver. 3.6.0) [51]. The significance
level was set to α = 0.05 for all statistical tests (two-tailed). Before performing the analyses, two experts
(J.C. and J.U.K.) screened the dataset for the resting-state EEG, bioimpedance, and HRV and ruled out
inappropriate signals that should not be analyzed because of measurement error or pathophysiological
factors such as arrhythmia. Missing values for the demographic characteristics and each biosignal were
imputed using the multiple imputation (MI) method. MI was performed with the “mice” function
provided by the “mice” package in R software, applying the option of the predictive mean matching
algorithm [52].
The baseline characteristics of the participants according to each allocated FTP and the control
group are summarized as the means and standard deviations (SDs) for continuous variables and the
frequencies and proportions for categorical variables based on the available dataset (Table 2). The
differences in baseline characteristics were investigated with one-way analysis of variance (ANOVA)
or the chi-squared test for continuous and categorical variables, respectively.
The change in each biosignal outcome between the baseline (before attending the FTP) and the
endpoint (after completing the FTP) was analyzed using the generalized linear model (GLM) with the
identity function keeping the baseline values fixed. Several confounders, such as age, sex, education
level, MMSE score, and daily activity hours, were also considered covariates in the GLM model
(Tables 3–5). The mean change and its 95% confidence interval (CI) within each FTP and control group
were provided according to each resting-state EEG, bioimpedance, or HRV variable. The multiple
comparisons between two groups (change in BP vs. CN and change in WP vs. CN) were calculated to
identify the mean difference in the change from the control group based on the t-statistics. p-values
and 95% CIs related to the multiple tests were adjusted by Dunnett’s method. The effect sizes of the
mean change in each FTP intervention and the mean difference in the change between the FTP and
control groups provided in Table 3, Table 4, and Table 5 were calculated using the equation suggested
by Rosnow et al. [53].
Int. J. Environ. Res. Public Health 2019, 16, 4325
7 of 20
3. Results
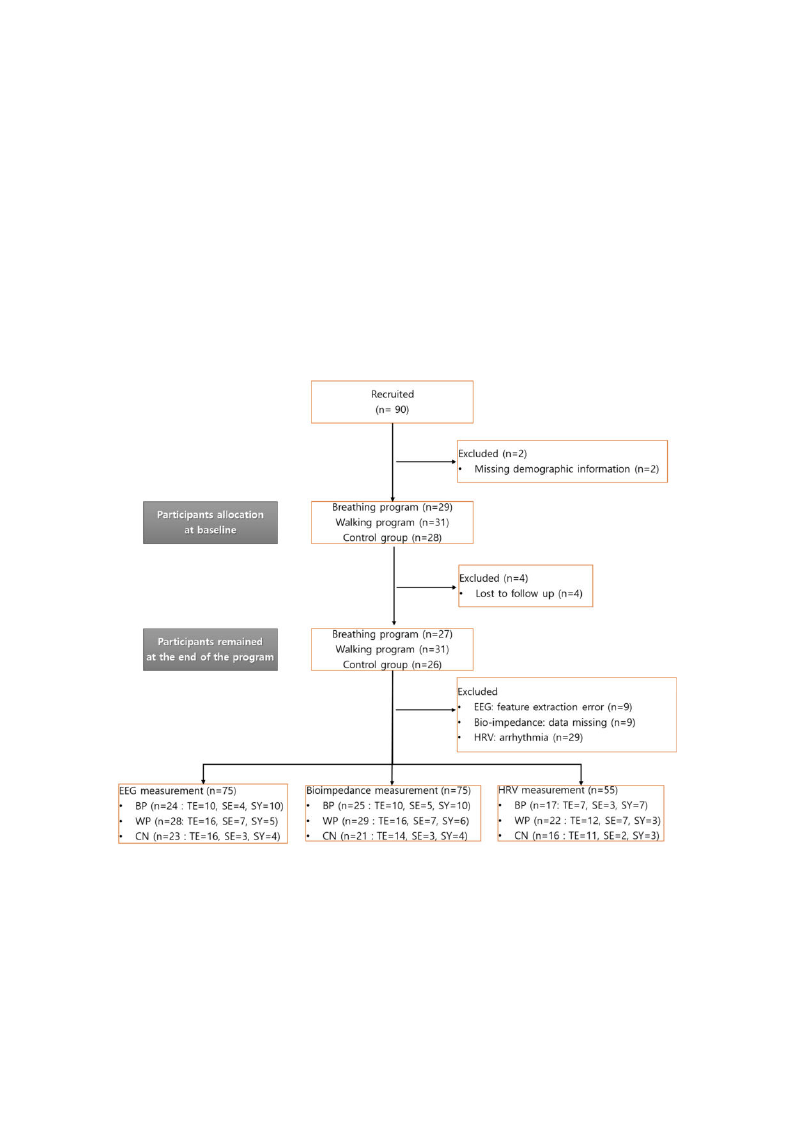
A total of 90 subjects were recruited for the study; 29 subjects were recruited from the S health
center and allocated to the BP, 31 subjects were recruited from the H health center and allocated to
the WP, and 30 subjects were recruited from the H senior club and allocated to the CN. Two subjects
were excluded because of missing demographic information, and four subjects were lost to follow up
during the FTPs. Finally, a total of 84 subjects remained for the biosignal measurements after finishing
each FTP (27/31/26 subjects for the BP/WP/CN). Before analysis, two experts screened the dataset
and eliminated inappropriate samples that could not be analyzed because of measurement errors or
pathophysiological factors such as arrhythmia. As a result, the number of participants remaining for
analysis in each dataset (EEG, bioimpedance, and HRV) was 74, 75, and 50, respectively, as shown in
Figure 2; there was EEG data contamination for 10 participants, and there were missing bioimpedance
measurements for 9 participants, while 34 participants were excluded from the HRV analysis because
of arrhythmia.
Figure 2. Flow chart of the study. HRV, heart rate variability; BP, guided-breathing meditation program;
WP, walking program; CN, control; TE, Tae-Eum; SE, So-Eum; SY, So-Yang.
3.1. Demographics
The participants’ demographics and baseline values are summarized in Table 2. There were
significant differences in age, educational level, marital status, and MMSE scores among the BP, WP, and
CN participants: in the order of BP, CN, and WP, the age decreased and the MMSE scores, education
levels, and marital statuses increased. This tendency is in accordance with the general fact that the
MMSE score is proportional to the duration of education and marital status and inversely proportional

Int. J. Environ. Res. Public Health 2019, 16, 4325
8 of 20
to age. There were no significant differences in other factors, such as body mass index (BMI), medical
history, daily activity hours, sex, weight, height, or SC type.
Table 2. Demographic information. SC, Sasang constitutional; HRV, heart rate variability; TE, Tae-Eum;
SE, So-Eum; SY, So-Yang; MMSE, Mini Mental-Status Examination; BMI, body mass index; FTP, forest
therapy program.
Demographic Variable
Control Group Breathing Program Walking Program p-Value
N (%)
Missing cases
EEG
HRV
Bioimpedance
SC Type
TE
SE
SY
Sex: Female
Age [yr]
Height [cm]
Weight [kg]
BMI [kg/m2]
MMSE
Smoking: Yes
Alcohol: Yes
Religion: Yes
Marital status: Married
Education level
None
1~3 years
4~6 years
7~9 years
More than 10 years
Medical history
Hypertension
Diabetes
Dyslipidemia
Arthritis
Cerebrovascular disease
Depression
Parkinson’s disease
Etc.
Visits to forest [per month]
Willing to participate in an FTP
Daily activity hours [hour/day]
28 (31.8%)
6 (20.7%)
16 (61.5%)
8 (27.6%)
18 (64.3%)
3 (10.7%)
7 (25.0%)
20 (69.0%)
74.4 ± 4.9
154.9 ± 6.6
60.8 ± 8.1
25.3 ± 3.2
25.3 ± 3.5
1 (3.6%)
1 (3.6%)
22 (78.6%)
14 (50.0%)
3 (10.7%)
2 (7.1%)
13 (46.4%)
3 (10.7%)
7 (25.0%)
13 (46.4%)
5 (17.9%)
13 (46.4%)
15 (53.6%)
1 (3.6%)
1 (3.6%)
0 (0.0%)
5 (17.9%)
2.9 ± 5.1
24 (85.7%)
1.3 ± 1.7
29 (33.0%)
5 (17.2%)
13 (44.8%)
4 (13.8%)
12 (41.4%)
5 (17.2%)
12 (41.4%)
22 (75.9%)
78.5 ± 6.9
153.3 ± 10.2
58.4 ± 9.7
23.8 ± 2.9
23.5 ± 4.0
4 (13.8%)
3 (10.3%)
15 (51.7%)
4 (13.8%)
12 (41.4%)
3 (10.3%)
10 (34.5%)
1 (3.4%)
3 (10.3%)
17 (58.6%)
7 (24.1%)
11 (37.9%)
17 (58.6%)
2 (6.9%)
2 (6.9%)
0 (0.0%)
13 (44.8%)
1.4 ± 5.6
27 (93.1%)
0.9 ± 1.0
31 (35.2%)
3 (9.7%)
9 (29.0%)
2 (6.5%)
16 (51.6%)
8 (25.8%)
7 (22.6%)
28 (90.3%)
72.9 ± 6.2
151.9 ± 5.5
56.5 ± 8.6
24.4 ± 3.3
26.3 ± 4.1
1 (3.2%)
2 (6.5%)
20 (64.5%)
16 (51.6%)
1 (3.2%)
7 (22.6%)
10 (32.3%)
2 (6.5%)
11 (35.5%)
15 (48.4%)
5 (16.1%)
8 (25.8%)
12 (38.7%)
1 (3.2%)
0 (0.0%)
1 (3.2%)
8 (25.8%)
1.8 ± 3.7
31 (100.0%)
2.1 ± 3.2
0.486
0.413
0.075
0.214
0.118
0.002
0.325
0.178
0.168
0.024
0.191
0.595
0.105
0.004
0.005
0.609
0.714
0.253
0.275
0.758
0.338
0.395
0.071
0.491
0.094
0.114
Data are summarized as the means ± SDs for continuous variables and as the frequencies and proportions for
categorical variables. p-values were derived from a one-way analysis of variance (ANOVA) test for continuous
variables and a chi-squared test for categorical variables.
3.2. Changes in Electrophysiology According to EEG, Bioimpedance, and HRV
We performed an analysis of covariance (ANCOVA) to examine the changes due to the forest
therapy program interventions, changes after each FTP, and effective differences between each FTP
and the CN. The analyzed variables in each dataset are described in Table 1. According to the detailed
statistical methods described in Section 2.5, the changes in biomarkers due to each FTP were analyzed
with a GLM, wherein several confounders, such as age, sex, education level, MMSE, and daily activity
hours, were considered covariates; these models were generated to identify the mean difference in the
change from the control group based on t-statistics. The test results are presented in Table 3, Table 4,
and Table 5 for each FTP group analysis and in Figure 3, Figure 4, and Figure 5 for the subgroup
analyses according to each SC type.

Int. J. Environ. Res. Public Health 2019, 16, 4325
9 of 20
3.2.1. Resting-State EEG
Table 3 shows the ANCOVA results of EEG variables of median frequency (MEF), the power of the
alpha and beta bands (Pα & Pβ), and the ratio of Pα/Pβ (ATR). It shows, with respect to their baselines,
a decrease in the MEF (δ = −0.45 with 95% CI of (−0.78, −0.11), p < 0.01, and γ = 0.57) in the CN, no
changes in the variables in the BP, and decreases in the MEF (δ = −0.40 with 95% CI of (−0.77, −0.03),
p < 0.05, and γ = 0.40) and ATR (δ = −0.15 with 95% CI of (−0.23, −0.07), p < 0.001, and γ = 0.68) in the
WP. In the multiple comparison analysis, no variable showed differences between groups in terms
of p-values. In terms of the effect size, however, the BP showed a marginal increase in the MEF with
Γ = 0.45 (∆ = 0.43) compared with the CN, and the WP showed a marginal decrease in ATR with
Γ = 0.44 (∆ = −0.09).
Table 3. Changes in EEG variables after the forest therapy programs (FTPs) (analysis of covariance
(ANCOVA) results). BP, guided-breathing meditation program; WP, walking program; CI,
confidence interval.
EEG
Control
Breathing Program
Walking Program
BP–CN
WP–CN
Variable XB δ (95% CI)
γ XB δ (95% CI) γ XB δ (95% CI) γ ∆ (95% CI) Γ ∆ (95% CI) Γ
MEF [Hz]
8.47
−0.45 **
(−0.78, −0.11)
0.57
8.40
−0.02
(−0.38, 0.34)
0.02
8.40
−0.40 *
(−0.77, −0.03)
0.40
0.43
(−0.11, 0.97)
0.45
0.05
(−0.48, 0.57)
0.05
Pα [µV2]
2.71
−0.10
(−0.33, 0.13)
0.18
3.00
−0.17
(−0.42, 0.08)
0.28
2.65
−0.15
(−0.42, 0.11)
0.22
−0.07
(−0.45, 0.31)
0.11
−0.06
(−0.42, 0.31)
0.09
Pβ [µV2]
1.86
−0.10
(−0.37, 0.16)
0.17
2.31
−0.16
(−0.44, 0.12)
0.24
2.09
0.13
(−0.16, 0.42)
0.17
−0.06
(−0.49, 0.37)
0.08
0.23
(−0.18, 0.64)
0.32
ATR
1.25
−0.06
(−0.13, 0.02)
0.33
1.18
0.00
(−0.08, 0.08)
0.02
1.22
−0.15 ***
(−0.23, −0.07)
0.68
0.06
(−0.06, 0.18)
0.29
−0.09
(−0.21, 0.03)
0.44
The changes in variables after each FTP was analyzed using a generalized linear model (GLM), where XB is the
mean value at baseline and δ (95% CI) and γ are the mean (95% confidence interval) and effect size, respectively,
of the difference after each FTP or the CN in an equivalent time interval. Multiple comparisons between the two
groups (change in BP vs. CN and WP vs. CN) were conducted to identify the mean difference in the change from
the CN group based on t-statistics, where ∆ and Γ are the mean difference and effect size, respectively, of each FTP
(BP or WP) relative to the CN. p-values (p < 0.1, * p < 0.05, ** p < 0.01, *** p < 0.001) and 95% CIs related to the
multiple tests were adjusted by Dunnett’s method. Effect sizes were calculated by the Rosnow method.
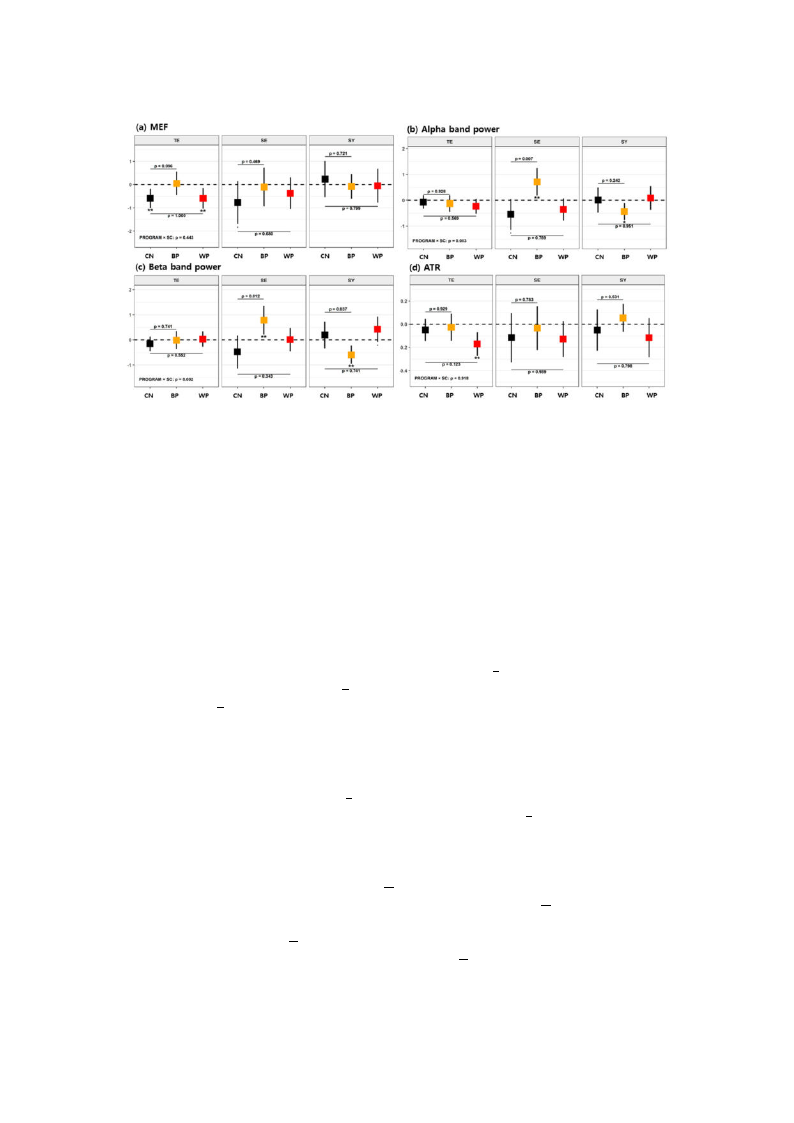
The effects of FTPs on cognition were analyzed in SC type subgroups, and the results are shown in
Figure 3 (and details in Table A1, Appendix A). When only the TY-type participants were counted, the
control group showed a decrease in MEF (p < 0.01 and γ = 0.74), and the WP group showed decreases
in MEF (p < 0.01 and γ = 0.67) and ATR (p < 0.01 and γ = 0.84) with respect to their baselines. There
were no mean differences in the variables between the WP and the CN, and there was a minor increase
in MEF with the WP group compared with the CN group (p < 0.1 and Γ = 0.53). For the SE-type
participants, the control group showed decreases in MEF (p < 0.1 and γ = 0.97) and Pα (p < 0.1 and
γ = 1.06), but in contrast, the BP group showed increased Pα (p < 0.01 and γ = 1.35) and Pβ (p < 0.01
and γ = 1.38) with respect to their baselines. Moreover, mean increases in Pα (p = 0.07 and Γ = 0.80)
and Pβ (p = 0.012 and Γ = 0.74) were found in the BP group compared with the CN group, but no
significant changes in their mean values were observed between the WP and CN groups. For the
SY-type participants, the BP group showed decreases in Pα (p < 0.05 and γ = 0.84) and Pβ (p < 0.01 and
γ = 1.04), but the WP group showed increased Pβ (p < 0.1 and γ = 0.76). There was also a decrease in
Pβ (p = 0.037 and Γ = 0.69) in the BP group compared with the CN group. Accordingly, the BP was
effective at increasing the powers of the alpha and beta bands in the SE type, while no such effects
were observed in the TE or SY type. On the other hand, the WP resulted in an improvement in beta
band power for the SY type, but no such effect was found for the other SC types.
Int. J. Environ. Res. Public Health 2019, 16, 4325
10 of 20
Figure 3. Mean changes in EEG variables after each of the forest therapy programs (FTPs) according to
SC types for (a) median frequency (MEF), (b) Pα,α(c) Pββ, and (d) alpha/theta ratio (ATR). Error bars
represent 95% confidence intervals (CIs) for the mean changes. Asterisks below the lower confidence
limits indicate the magnitude of statistical significance for the mean changes within each program group
value (p < 0.1, * p < 0.05, ** p < 0.01, *** p < 0.001). The p-values noted in the figure are obtained from the
multiple comparisons (BP vs. CN and WP vs. CN) for the group difference in the mean changes between
the two groups. Dunnett’s method was used to adjust the type I error. Mean changes are adjusted for
sex, age, education level, Mini Mental-Status Examination (MMSE), and daily activity hours.
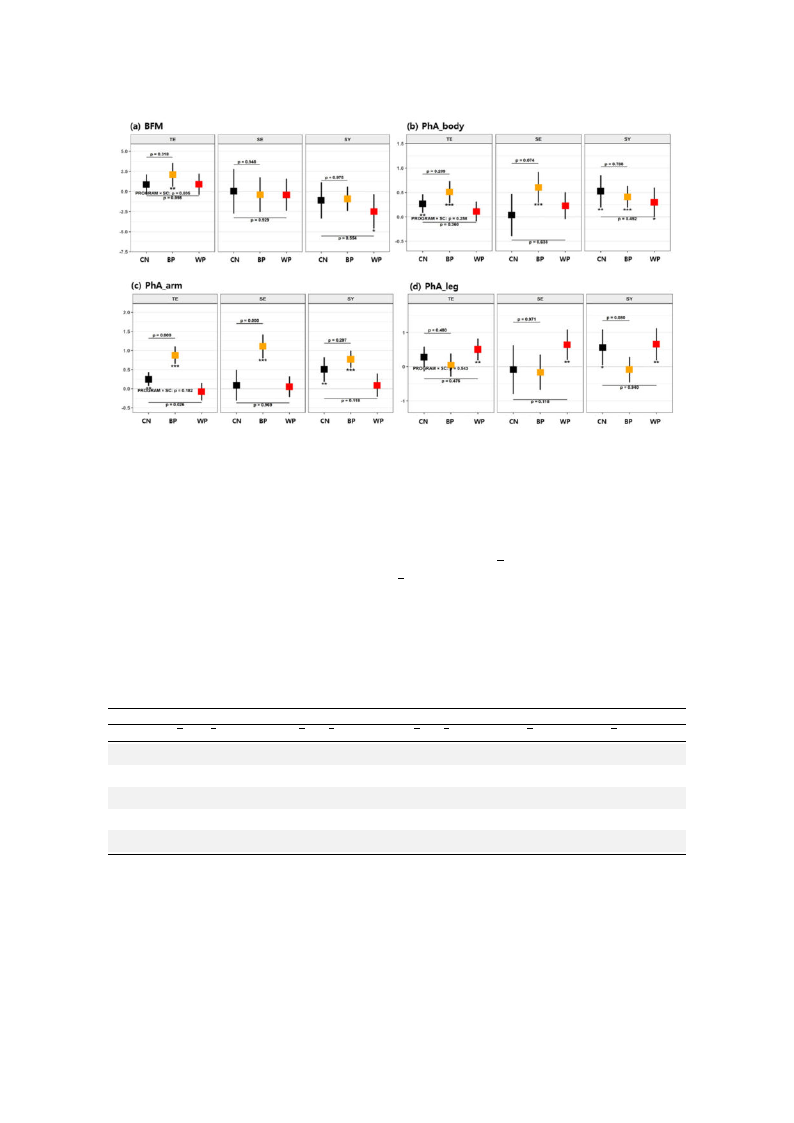
3.2.2. Bioimpedance
Table 4 shows the ANCOVA results of bioimpedance variables such as the fat-free mass (FFM);
body fat mass (BFM); % body fat (%BF); and impedances, reactances, and phase angles of the arms
(Imp_arm, Reactance_arm & PhA_arm), legs (Imp_leg, Reactance_leg & PhA_leg), and whole body
(PhA_body) (see list in Table 1). The overall changes in FFM, BFM, or %BF were not observed after
any FTP or in the CN. However, there were increases in the whole body and segmental phase angles.
Specifically, increases in PhA_body were observed in the BP group (δ = 0.48 with 95% CI of (0.34, 0.63),
wpCanN<ads0gtf.hor0oeu0un1Cp,dNsa.bngedrtowγue=pen(1δ.t3γh=0e)0,B.t2Ph9δeawnWidtPhth9ge5r%oCuNCpI((Γoδf==(000..1.42δ450,)0,w.b4iut4ht),t9ph5e<%re0C.w0I0ao1sf,na(o0n.d0ch3γ,aδ0n=.g30e6.8)b,5ep)γt,w<ane0ed.n0a5t,hmaeinnWdorPγian=ncdr0e.4γath4see),
More importantly, the segmental phase angleΓs of the arms and legs showed opposite behaviors
between different interventions. First, with respect to their baselines, a significant increase in the
PhA_arm was observed in the BP group (δ = 0.87 with 95% CI of (0.70, 1.03), p < 0.001, and γ = 2.13),
t0aohn.b8eds5eP)ar,hvpsAeig<d_nl0eiinfi.g0ct0iahn1ne,tthaCinenNdcBrPgeγaro=osreu0tip.hn8.γe9tAh)P,enhwoAPhth_hiAaleerr_mrlieenglitanewtriδtevhasesetlioWynbgsPsme.rrCeavsloeulnedlrstieiwnqnutachrseeentahWtslayePt,stngihnoreotsPuhuhpecAhP(δ_hian=Arcm_0rδea.6ari0nmsecwrsaeinwtahdsee9rPd5eh%soAibgC_snγIleieofirgvfcewa(0dne.t3irl5nye,
in the BP group compared with the CN group (∆ = 0.58 with 95% CI of (0.33, 0.84), p < 0.001, and
(cΓ−o=0m.51p1.2a,9r−e),0dw.0Γwh3)ii,ltehpi<tthd0ee.0cCr5Ne,aasgnerddoΓuinp=t(h0∆e.6W4=).PI0gn.r3co1ounwptricatohsmt9, p5tha%erePCdhIwAoif_thl(e−gth0Δi.en0=4Ccr,0Ne0.a5.gs68er7do),usppig<(n∆i0fi.=c1a, n−atn0lyd.2i7ΓnwΔ=thi=t0eh.−W5905P)%, gwCrohIuiolpef
vipta<dlue0ecT.s1rhe,reaaastncheodedn−rΓtitrnh=aasth0tni.e−n5Γimg4B)bPp. eeghdraaovnuicopersvcoaomlfusepesga.rmFeΓdeonrwtianiΔlstpht=ahntah0csee.e3,C1asmnNgalglelrsoinaucrperem(a∆soess=tlwy−ec0ra−Δe.u3f=s5oeuwd−nibdtyhitn9h5teh%cehCIamInpgo_efas(r−imn0r.Γi7en1a,tc−ht0ae.2nB3cP)e,
Int. J. Environ. Res. Public Health 2019, 16, 4325
11 of 20
group (δ/XB = 4.1%) and in the Imp_leg (δ/XB = 4.7%) in the WP group with respect to their baselines;
however, there were no significant differences from the CN group. Simultaneously, larger increases
were found in the Reactance_arm (δ/XB = 22.5%) in the BP group, in the Reactance_leg (δ/XB = 15.4%)
in the WP group, and increases in the Reactance_arm (δ/XB = 5.5%) and Reactance_leg (δ/XB = 7.9%)
in the control group. Because the phase angle is the ratio between reactance and impedance (see
Equation (1)), the increases in the segmental phase angles were mostly owing to the increases in the
segmental reactance levels of the arm and leg.
Table 4. Changes in the bioimpedance variables after the FTPs (analysis of covariance (ANCOVA)
results). The details are identical to those in Table 3. FFM, fat-free mass; BFM, body fat mass; %BF, %
body fat.
Bioimpedance
Control
Variable
FFM [kg]
XB
40.70
BFM [kg] 20.48
%BF [%] 33.00
PhA_body 5.38
Imp_arm
[Ω]
343.69
Imp_leg [Ω] 168.44
Reactance_arm
[Ω]
31.45
Reactance_leg
[Ω]
15.52
PhA_arm 5.28
PhA_leg 5.35
δ (95% CI)
0.72
(−0.30, 1.74)
0.26
(−0.79, 1.30)
−0.36
(−1.85, 1.13)
0.29 ***
(0.14, 0.44)
3.22
(−4.38, 10.82)
3.41
(−2.91, 9.74)
1.74 *
(0.29, 3.19)
1.23 *
(0.23, 2.23)
0.28 ***
(0.14, 0.43)
0.29 *
(0.06, 0.52)
Breathing Program
Walking Program
BP–CN
WP–CN
γ XB δ (95% CI) γ XB δ (95% CI)
0.31 37.47
−0.26
(−1.26, 0.74)
0.10 38.28
0.20
(−0.92, 1.31)
0.11 20.21
0.62
(−0.43, 1.67)
0.24 18.72
0.02
(−1.15, 1.18)
0.11 34.48
0.75
(−0.76, 2.26)
0.20 32.25
−0.41
(−2.12, 1.31)
0.85 4.91
0.48 ***
(0.34, 0.63)
1.30 5.42
0.20 *
(0.03, 0.36)
0.18
346.11
14.25 ***
(6.54, 21.96)
0.74
347.20
−1.19
(−9.63, 7.25)
0.24
180.63
−3.86
(−10.13, 2.40)
0.25
168.65
8.76 *
(1.65, 15.87)
0.52 28.07
6.32 ***
(4.70, 7.95)
1.55 33.92
−0.56
(−2.18, 1.06)
0.53 16.24
−0.37
(−1.39, 0.65)
0.14 14.58
2.25 ***
(1.12, 3.39)
0.85 4.66
0.87 ***
(0.70, 1.03)
2.13 5.63
0.01
(−0.17, 0.20)
0.54 5.16
−0.06
(−0.30, 0.17)
0.11 4.97
0.60 ***
(0.35, 0.85)
γ ∆ (95% CI) Γ ∆ (95% CI) Γ
0.07
−0.98
(−2.52, 0.55)
0.36
−0.53
(−2.01, 0.96)
0.20
0.01
0.36
(−1.30, 2.02)
0.12
−0.24
(−1.88, 1.40)
0.08
0.09
1.11
(−1.26, 3.47)
0.26
−0.04
(−2.39, 2.30)
0.01
0.44
0.19
(−0.05, 0.43)
0.45
−0.09
(−0.32, 0.13)
0.24
0.05
11.03
(−1.01, 23.08)
0.51
−4.41
(−16.13, 7.32)
0.21
0.46
−7.28
(−17.27, 2.71)
0.41
5.35
(−4.37, 15.07)
0.31
0.13
4.58 ***
(2.14, 7.03)
1.05
−2.30 *
(−4.57, −0.02)
0.57
0.74
−1.60
(−3.21, 0.01)
0.56
1.02
(−0.56, 2.60)
0.37
0.03
0.58 ***
(0.33, 0.84)
1.29
−0.27 *
(−0.51, −0.03)
0.64
0.89
−0.35
(−0.71, 0.02)
0.54
0.31
(−0.04, 0.67)
0.50
The effects of FTPs on bioimpedance changes were analyzed by SC-type subgroup. In Figure 4
(see also Table A2, Appendix A), we only presented the variables that showed the SC-specific changes.
Unlike the behaviors of the EEG variables, there were no contrasting behaviors between the different
SC subgroups. BFM increased for the TE-type participants in the BP, while it decreased for the SY-type
participants in the WP compared with their respective baselines. However, these values did not
significantly differ from those of the CN participants. The phase angle of the whole body (PhA_body)
increased irrespective of the SC type for all FTPs, showing no significant differences from the CN
participants except for the SE-type participants in the BP (p < 0.1 and γ = 0.56).
More importantly, irrespective of the SC type, the within-group analysis showed that the PhA_arm
increased in the BP group and the PhA_leg increased in the WP group compared with the baseline.
Among the BP participants, significant increases in the PhA_arm were observed in the TE-type (p < 0.001
and Γ = 1.08) and SE-type participants (p < 0.001 and Γ = 1.09) in reference to the CN, while a decrease
in the PhA_leg was observed in the SY type (p < 0.1 and Γ = 0.59). On the other hand, among the
WP participants, there was no intergroup difference in the PhA_leg, but there was a decrease in the
PhA_arm in the TE type (p < 0.05 and Γ = 0.66) compared with the CN.
Int. J. Environ. Res. Public Health 2019, 16, 4325
12 of 20
Figure 4. Mean changes in bioimpedance variables after each of the FTPs according to SC types for (a)
body fat mass (BFM), (b) PhA_body, (c) PhA_arm, and (d) PhA_leg. The details are identical to those
in Figure 3.
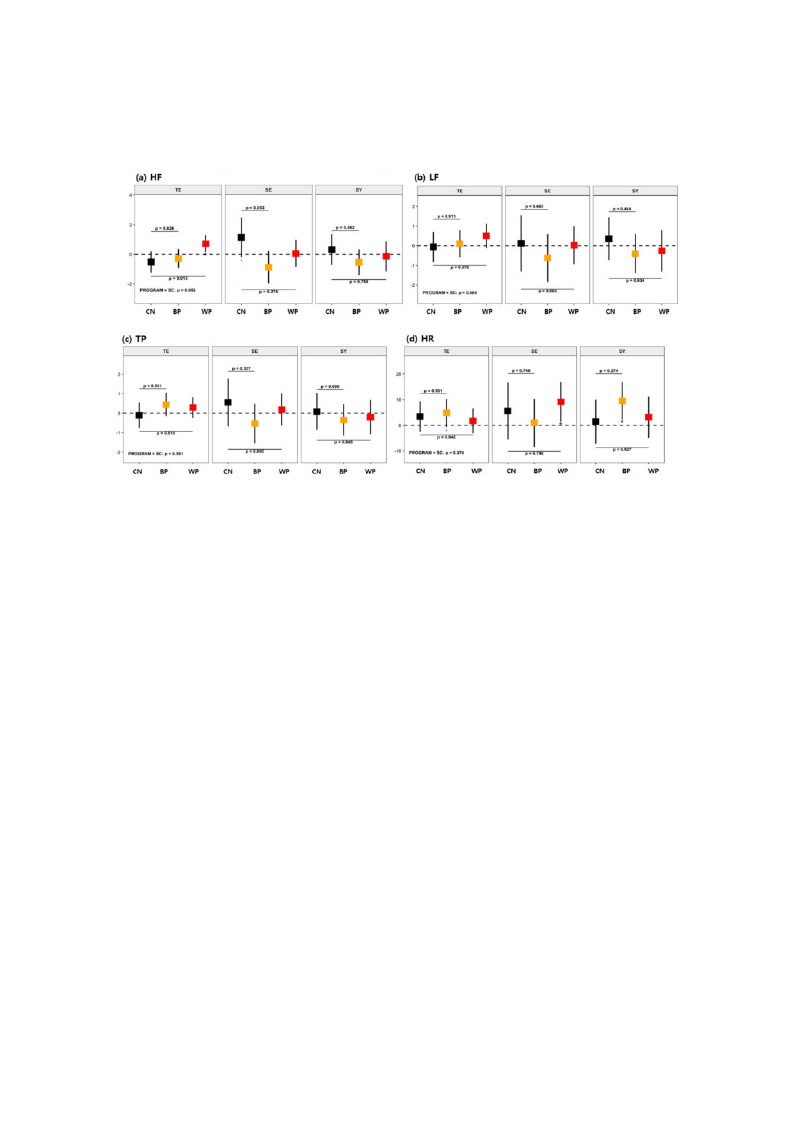
3.2.3. Heart Rate Variability
The changes in the HRV variables, such as the spectral powers of high frequency (HF), low
frequency (LF), total power (TP = HF + LF + VLF), and heart rate (HR), were tested by ANCOVA
and are shown in Table 5. The results showed a decrease inδ HF (δ = −0.46 with 95%− CI of (−0.98,
0.05), p < 0γ.1, and γ = 0.46) and an increaseδin HR (δ = 5.97 with 95% CI of (1.82, 10.11), p < 0.0γ05, and
γ = 0.73) in the BP, but no changes in variables in the WP and the CN compared with their respective
baseline values. Compared with the CN participants, the WP participants showed a minor increase in
HF, with a moderate effect sizΓe (Γ = 0.48, but p > 0.1).
Table 5. Changes in HRV variables after FTPs (ANCOVA results). The details are identical to those in
Table 3. HF, high frequency; LF, low frequency; TP, total power; HR, heart rate.
HRV
Variable
HF [msec2]
LF [msec2]
%LF
TP [msec2]
HR [bpm]
XB
3.88
3.50
46.89
5.47
68.93
Control
δ (95% CI)
−0.13
(−0−.69, 0.44)
−(−0.505.0,00.56)
−1.38
−(−6.31, 3.55)
(−0−−.503.,004.46)
− 2.87
(−1−.58, 7.33)
−
Breathing Program
Walking Program
BP–CN
WP–CN
γ XB δ (95% CI) γ XB δ (95% CI) γ ∆ (95% CI) Γ ∆ (95% CI) Γ
0.13 4.27
−0.46
(−−0.98, 0.05)
0.46 4.61
0.41
(−0.09, 0.92)
0.35
−0.34
(−1.−22, 0.55)
0.28
0.54
(−0.31, 1.39)
0.48
0.00 4.03 −(−0−.608.,106.35) 0.16 3.99 −(−0.202.2,80.78) 0.24 (−−1−.005.,107.72) 0.14 (−0−.506.2,71.11) 0.25
0.16
48.25
− 1.48
−(−3.19, 6.14)
0.16
46.50
−1.38
−(−5.90, 3.14)
0.13
−2.86
(−−5.00, 10.71)
0.26
0.00
(−7−.40, 7.40)
0.00
0.04 5.88
0.05
(−0.40, 0.50)
0.06 6.14
(−−0.207.1,70.62)
0.17
0.09
(−0.69, 0.86)
0.08
0.21
(−0.54, 0.96)
0.21
0.38
67.64
− 5.97 **
(1.82, 10.11)
0.73
64.17
− 3.02
(−1.04, 7.09)
0.32
− 3.09
(−3.85, 10.04)
0.32
− 0.15
(−6.61, 6.91)
0.02
−
−
−
−
The effects of−FTPs on the HRV changes were analyze−d by SC subgro−up, as shown in −Figure 5 (see
also Table A3, Appendix A). For the TE-type participants, the results showed increased HF in the WP
compared with the CN (p = 0.013 and Γ = 1.02). For the SE-type participants, a minor decrease in HF
was found in the BP compared with the CN (p =Γ 0.053 and Γ = 0.79). No group differences were found
in other variables. Intragroup differences were also found. For theΓSE-type participants, HR (p < 0.05
and γ = 1.07) increased with the WP. For the TE- and SY-type participants, HR (p < 0.1 and γ = 0.62 for
TE, and p < 0γ.05 and γ = 1.17 for SY) increased with BP. Because an increase in HF indicates activatedγ
parasympathetic nerve activity [γ54], the WP was found to be effective in the TE-type participants. The
Int. J. Environ. Res. Public Health 2019, 16, 4325
13 of 20
increases in HR indicate upregulated blood flow; the upregulated effect was observed for the SE type
in the WP and the SY type in the BP.
Figure 5. Mean changes in HRV variables after each of the FTPs according to SC type for (a) high
frequency (HF), (b) low frequency (LF), (c) total power (TP), and (d) heart rate (HR). The details are
identical to those in Figure 3.
4. Discussion
The major aim of this study was to improve the neurocognitive abilities, autonomic nervous
activities, and metabolic functions, and thus eventually prevent dementia, in older people via FTPs
that could be carried out in nearby urban forests. In composing the FTPs, we assumed that distinct
benefits could be induced by different characteristics of the program and that the benefits may vary
with the psychophysiological traits of the participants. To test these assumptions, we first developed
two FTPs with distinct characteristics. The BP was designed to induce deep breathing with postures
that could induce the cervical spine to achieve optimal alignment to activate therapeutic Qi and blood
flow through the meridian system and to increase cerebral blood flow, improving cognitive function
while maintaining a low profile of other physical activities. The WP was designed to cause participants
to walk actively to an extent that might induce sweating. Second, to test the personality-dependent
benefits, we employed the concepts of SCM, in which individuals belonged to one of three different SC
types with different psychological preferences and physiological susceptibilities to different types of
physical activities.
In the forest therapy field, HRV is the most commonly used electrophysiological measurement to test ANS
and cardiovascular function [12], and compared with walking in an urban area, walking in a forest generally
has relaxing effects, with increased parasympathetic nervous system activity [16,55,56]. As advancing the
measurement and signal processing techniques, portable EEG devices were recently implemented
to assess neurocognitive activities stimulated by walking in the forest [57,58]. The bioimpedance
analysis (BIA) technique was commercialized as a quick, portable, and reliable measurement of body
composition, such as the FFM, fat mass, and total body water [59]. It is also a reliable estimator of
cellular metabolism, such as intracellular water content, extracellular water content, and changes in
intracellular pH and phosphocreatine [60]. This technique is not yet commonly implemented as a tool
to evaluate the effect of forest therapy, as body composition does not change in a short period of time.
However, in a repetitive FTP over a number of weeks, the body composition and cellular metabolic

Int. J. Environ. Res. Public Health 2019, 16, 4325
14 of 20
states are susceptible to change, and the BIA method can be a plausible tool to evaluate the therapeutic
effects in the forest [23].
The implementation of 11 sessions over 11 weeks resulted in some beneficial effects with regard to
neural activity in terms of EEG biomarkers; the ANS in terms of HRV biomarkers; and, for the first
time, on bioimpedance in terms of the segmental phase angles. In terms of the EEG and HRV variables,
compared with the CN, we observed a marginal increase in MEF among the EEG variables for the BP
participants (effect size = 0.45, p > 0.1) and a marginal increase in HF among the HRV variables for the
WP participants (effect size = 0.48, p > 0.1). A long history of literature supports that individuals with
cognitive decline showed decreases in the MEF and ATR [50], and decreases in alpha wave activity
and beta wave power are observed in the early stage of Alzheimer’s disease [61–63]. In terms of the
effect size calculations based on Cohen’s d, the BP and WP showed possible beneficial effects for neural
activity and for activation of the parasympathetic nervous response, respectively. Because the p-values
are above the level of statistical significance, however, the results need to be confirmed by further study.
In terms of the bioimpedance variables, the PhA of the arms was increased largely for the BP
participants (effect size = 1.29, p < 0.001), and the PhA of the legs was increased for the WP participants
(effect size = 0.50, p < 0.1) compared with the CN. In contrast to the sensitive changes in total/segmental
PhAs and related impedance and reactance values, no such changes were observed in FFM, BFM, or %BF.
Recently, increases in phase angle by resistance training (RT) for older individuals have been reported
by a series of works [64]. In particular, based on a progressive RT for 12 weeks (three times/week),
Souza et al. reported increases in %BF, skeletal muscle mass, total body water, and PhA; among
the observed variables, the PhA presented the highest relative effect size and statistical significance
with respect to the differences between pre- and post-intervention and between training and control
groups [65]. An emerging number of studies investigated the PhAs of BIA as a biomarker for various
diseases and physiological conditions down to the cellular level. In particular, the PhAs at 50 kHz
were reported to be lower in patients with diabetes mellitus [66], in patients with malnutrition [67],
in patients at risk of death in the intensive care unit (ICU) [68], in people with lower FFM values, in
patients with chronic obstructive pulmonary disease [69], and in cancer patients with lower quality of
life and malnutrition [70]. These previous reports commonly indicate that changes in health conditions
towards metabolic malnutritional states are related to reduced PhAs. Therefore, bioimpedance PhAs at
50 kHz may work as a prognostic biomarker of the FTP effects with respect to the recovery of cellular
metabolism; the increased PhA in the arms for the BP participants may indicate increased metabolism
in the upper body parts owing to the BP, and the increased PhA in the legs for the WP participants
may indicate increased metabolism in the lower body parts owing to the WP.
In the subgroup analysis by SC type, constitution-specific effects appeared in the EEG and HRV
biomarkers. The SE-type participants gained benefits in neural activity (increased powers of alpha and
beta waves) from the BP, and the SY-type participants obtained an increase in beta band power from the
WP. With respect to the HRV biomarkers, the TE-type participants showed a relaxation effect (increased
parasympathetic nerve activity) from the WP. Slightly upregulated blood flow effects were observed
among the SE-type participants in the WP- and SY-type participants in the BP. According to a recent
systematic review, the TE type has a low threshold for parasympathetic activation [42], which may
explain why a moderate level of walking in the forest effectively induced elevated parasympathetic
nerve activity in the TE type. However, the constitution-specific effects were not observed in the
behavior of bioimpedance PhAs; for all TE-, SE-, and SY-type participants, the BP increased the average
PhA of the arms, and the WP increased the average PhA of the legs.
Recent publications on SCM show that different SC types are characterized with different
susceptibilities to metabolic syndrome. Compared with other SC types (especially with respect to the
SE type), the TE type is characterized by an attenuated metabolic rate down to the cellular level [71]
with suspected reduction in mitochondrial metabolism [72], and most likely as a consequence, the
TE type is highly associated with an increased risk of general obesity and abdominal obesity [73],
and individuals of the TE type have higher blood pressures, glucose metabolism values, and lipid

Int. J. Environ. Res. Public Health 2019, 16, 4325
15 of 20
profile levels, which impose a higher risk of type 2 diabetes [74]. The SC type itself was reported
to be a risk factor for metabolic syndrome (TE > SY > SE) [75], and the SE type was a risk factor
for irritable bowel syndrome [76]. FTPs can distinctively account for participants’ age, sex, and
pathological and psychophysiological features. We showed that the SCM could be a candidate for such
a tailored approach. To our knowledge, this is the first report of such a tailored approach in the field
of forest therapy or exercise-based interventions for healthcare; we do not have systematic support
from previous publications, and subsequent works should be followed to develop more practical FTPs
accounting for participants’ psychophysiological traits.
There are some limitations of this study. Age, education level, and MMSE scores between the BP,
WP, and CN participants were not well matched, which are known factors affecting neurocognitive
status. More frequently used assessment tools to evaluate the effects of forest therapy with regard to the
quality of life or profile of mood states could help evaluate more integrative effects. For the classification
of the SC types, for the sake of convenience, we used only a short form (KS-15), the accuracy of which
was reported to be approximately 63%; therefore, the subgroup analysis contains a moderate level of
misclassification errors in the SC-type grouping [44]. In the subgroup analysis according to SC types,
some cells had only a few samples, which might have resulted in biased findings. Taking into account
that this work is only a feasibility study to check the possibility of different phenotypic responses
to different therapeutic modalities in the forest, further studies should be designed to include more
participants in each phenotype. There was no intervention for the control group, and designs for a
future study should include an equivalent level of indoor exercise for the control group to investigate
additional benefits due to performing the activities in the forest.
5. Conclusions
In conclusion, both the BP and the WP had health benefits for the elderly population in terms
of neurophysiology, HRV, and bioimpedance, and the beneficial effects varied depending on the
characteristics of the FTPs and on the SC types. In particular, the BP was effective at increasing the
phase angle of the upper limbs, and the WP was effective at increasing the phase angle of the lower
limbs. In the subgroup analysis according to the SCM typology, the BP was beneficial in increasing
the powers of the alpha wave or beta wave in the SE type, and the WP was effective in increasing the
beta wave power for the SY type. Moreover, the WP elevated the parasympathetic nervous system
activity in the TE-type participants. These constitution-specific variations were not observed in the
bioimpedance biomarkers. This result suggests that forest therapy can be effective at preventing
dementia and that the beneficial effects can be maximized when the therapeutic program accounts for
the participant’s psychological and physiological traits. To confirm the results of this feasibility study,
more sessions with longer durations and a greater number of participants will be needed.
Author Contributions: Conceptualization, J.Y., J.U.K., and W.S.; methodology, J.Y., T.K., W.C., C.S., and J.U.K.;
software, J.C. and W.C.; validation; J.Y., J.K., B.K., J.S., and J.C.; analysis, B.K., S.G.K., and J.U.K.; investigation
(field work), J.Y., T.K., Y.L., M.S., S.J., J.K., B.K., J.S., A.Y.J., K.K., and J.H.P.; data curation, B.K., S.G.K., and T.K.;
writing—original draft preparation, J.Y., B.K., and J.U.K.; writing—review and editing, W.S.; project administration,
K.K.; supervision and funding acquisition, J.U.K.
Funding: This research was funded by the R&D Program for Forest Science Technology (Project No.
2018124A00-1920-AB01) funded by the Korea Forest Service (Korea Forestry Promotion Institute).
Conflicts of Interest: The authors declare that they have no conflicts of interest.
Appendix A
Owing to the space limitation and to provide results with reduced visual complexity, we presented
the constitution-specific results only with figures that did not contain the essential information with the
effect size. Here, the information supplementary to Figure 3 through Figure 5 is presented in Table A1
through Table A3.
Int. J. Environ. Res. Public Health 2019, 16, 4325
16 of 20
Table A1. Changes in EEG variables after FTPs according to SC types (ANCOVA results).
EEG Variable
Control
BP
WP
BP–CN
WP–CN
SC
Type
XB
δ (95% CI)
γ
XB δ (95% CI)
γ
XB δ (95% CI)
γ ∆ (95% CI)
Γ
∆ (95% CI)
Γ
MEF [Hz]
Pα [µV2]
Pβ [µV2]
ATR
TE
8.49
−0.59 **
(−1.01, −0.18)
0.74
8.62
0.05
(−0.46, 0.56)
0.06
8.59
−0.60 **
(−1.04, −0.15)
0.67
0.65
(−0.10, 1.39)
0.53
−0.00
(−0.65, 0.64)
0.00
SE
8.36
−0.77
(−1.69, 0.15)
0.97
8.61
−0.10
(−0.93, 0.72)
0.13
8.06
−0.37
(−1.06, 0.31)
0.41
0.67
(−0.76, 2.09)
0.28
0.40
(−0.84, 1.63)
0.21
SY
8.48
0.24
(−0.53, 1.01)
0.31
8.08
−0.08
(−0.61, 0.45)
0.10
8.30
−0.05
(−0.77, 0.68)
0.06
−0.32
(−1.40, 0.76)
0.19
−0.29
(−1.48, 0.91)
0.14
TE
2.85
−0.07
(−0.33, 0.19)
0.13
2.94
−0.13
(−0.45, 0.19)
0.25
2.62
−0.23
(−0.52, 0.05)
0.41
−0.06
(−0.53, 0.41)
0.08
−0.16
(−0.57, 0.25)
0.24
SE
2.10
−0.54
(−1.14, 0.05)
1.06
3.36
0.71 **
(0.18, 1.24)
1.35
2.71
−0.35
(−0.78, 0.07)
0.63
1.26 **
(0.32, 2.20)
0.80
0.19
(−0.59, 0.97)
0.16
SY
2.62
0.01
(−0.47, 0.50)
0.02
2.91
−0.44 *
(−0.77, −0.11)
0.84
2.64
0.09
(−0.37, 0.54)
0.17
−0.45
(−1.13, 0.23)
0.43
0.08
(−0.68, 0.83)
0.06
TE
1.96
−0.15
(−0.44, 0.14)
0.27
2.38
−0.01
(−0.36, 0.35)
0.01
2.02
0.03
(−0.28, 0.34)
0.05
0.15
(−0.38, 0.67)
0.17
0.18
(−0.26, 0.63)
0.24
SE
1.15
−0.48
(−1.14, 0.18)
0.84
2.49
0.79 **
(0.22, 1.36)
1.38
2.22
0.01
(−0.45, 0.48)
0.02
1.26 *
(0.25, 2.28)
0.74
0.49
(−0.38, 1.37)
0.37
SY
2.01
0.19
(−0.34, 0.73)
0.36
2.16
−0.59 **
(−0.96, −0.23)
1.04
2.12
0.43
(−0.08, 0.93)
0.76
−0.79 *
(−1.53, −0.04)
0.69
0.23
(−0.60, 1.06)
0.17
TE
1.28
−0.05
(−0.14, 0.05)
0.26
1.20
−0.03
(−0.14, 0.09)
0.15
1.25
−0.17 **
(−0.27, −0.07)
0.84
0.02
(−0.15, 0.19)
0.08
−0.12
(−0.27, 0.03)
0.49
SE
1.24
−0.12
(−0.33, 0.10)
0.63
1.17
−0.03
(−0.22, 0.16)
0.18
1.18
−0.13
(−0.28, 0.03)
0.62
0.08
(−0.25, 0.41)
0.15
−0.01
(−0.29, 0.27)
0.03
SY
1.14
−0.05
(−0.23, 0.13)
0.28
1.17
0.05
(−0.07, 0.18)
0.29
1.14
−0.12
(−0.28, 0.05)
0.62
0.11
(−0.14, 0.35)
0.28
−0.07
(−0.34, 0.21)
0.14
The changes in variables after each FTP were analyzed using a GLM, where XB is the mean value at baseline and
δ (95% CI) and γ are the mean (95% confidence interval) and effect size, respectively, of the difference after each
FTP or the CN in an equivalent time interval. Multiple comparisons between the two groups (change in BP vs.
CN and WP vs. CN) were conducted to identify the mean difference in the change from the CN group based on
t-statistics, where ∆ and Γ are the mean difference and effect size, respectively, of each FTP (BP or WP) relative to the
CN. p-values (p < 0.1, * p < 0.05, ** p < 0.01, *** p < 0.001) and 95% CIs related to the multiple tests were adjusted by
Dunnett’s method. Effect sizes were calculated by the Rosnow method.
Table A2. Changes in bioimpedance variables after FTPs according to SC types (ANCOVA results).
The details are identical to those in Table A1.
Bioimpedance
Control
BP
WP
BP−CN
WP−CN
Variable
SC
Type XB
δ (95% CI)
γ
XB δ (95% CI)
γ
XB δ (95% CI)
γ ∆ (95% CI)
Γ
∆ (95% CI)
Γ
TE
23.53
0.86
(−0.39, 2.10)
0.37
25.31
2.09 **
(0.61, 3.56)
0.90
22.67
0.89
(−0.44, 2.21)
0.33
1.23
(−0.87, 3.33)
0.35
0.03
(−1.90, 1.95)
0.01
BFM
SE
14.26
0.03
(−2.74, 2.79)
0.01
16.65
−0.39
(−2.55, 1.78)
0.16
12.88
−0.42
(−2.42, 1.57)
0.16
−0.41
(−4.32, 3.49)
0.06
−0.45
(−4.00, 3.10)
0.08
SY
14.47
−1.11
(−3.37, 1.15)
0.49
16.89
−0.91
(−2.43, 0.62)
0.38
15.02
−2.48 *
(−4.61, −0.35)
0.95
0.20
(−2.80, 3.21)
0.04
−1.37
(−4.73, 1.99)
0.24
TE
5.55
0.27 **
(0.08, 0.46)
0.76 4.78
0.51 ***
(0.29, 0.73)
1.45
5.53
0.11
(−0.09, 0.32)
0.28
0.24
(−0.10, 0.58)
0.42
−0.16
(−0.45, 0.13)
0.32
PhA_body
SE
4.63
0.04
(−0.40, 0.47)
0.10
5.04
0.60 ***
(0.29, 0.92)
1.73
5.13
0.23
(−0.05, 0.51)
0.63
0.57
(−0.05, 1.18)
0.56
0.19
(−0.36, 0.74)
0.22
SY
5.33
0.52 **
(0.19, 0.85)
1.59 4.98
0.41 ***
(0.19, 0.64)
1.17
5.47
0.30 *
(0.00, 0.59)
0.82
−0.11
(−0.56, 0.34)
0.16
−0.23
(−0.73, 0.28)
0.27
TE
5.40
0.25 **
(0.07, 0.43)
0.73 4.58
0.87 ***
(0.64, 1.10)
2.41
5.75
−0.08
(−0.30, 0.15)
0.17
0.63 ***
(0.28, 0.97)
1.08
−0.32 *
(−0.62, −0.03)
0.66
PhA_arm
SE
4.83
0.09
(−0.31, 0.49)
0.26
4.68
1.11 ***
(0.80, 1.42)
3.19
5.36
0.05
(−0.22, 0.32)
0.14
1.02 ***
(0.45, 1.59)
1.09
−0.04
(−0.58, 0.49)
0.05
SY
5.24
0.50 **
(0.18, 0.82)
1.57 4.73
0.77 ***
(0.55, 0.99)
2.17
5.63
0.09
(−0.21, 0.39)
0.24
0.27
(−0.17, 0.71)
0.39
−0.41
(−0.91, 0.09)
0.50
TE
5.68
0.28
(−0.02, 0.58)
0.50
4.98
0.05
(−0.29, 0.39)
0.09
5.06
0.50 **
(0.19, 0.82)
0.80
−0.23
(−0.74, 0.27)
0.27
0.22
(−0.26, 0.70)
0.27
PhA_leg
SE
3.89
−0.09
(−0.80, 0.62)
0.14
5.45
−0.16
(−0.68, 0.35)
0.29
4.86
0.64 **
(0.20, 1.08)
1.10
−0.08
(−1.13, 0.97)
0.04
0.73
(−0.15, 1.61)
0.53
SY
5.32
0.56 *
(0.04, 1.09)
1.08
5.20
−0.09
(−0.45, 0.28)
0.15
4.87
0.66 **
(0.19, 1.12)
1.15
−0.65
(−1.37, 0.06)
0.59
0.09
(−0.71, 0.89)
0.07

Int. J. Environ. Res. Public Health 2019, 16, 4325
17 of 20
Table A3. Changes in HRV variables after FTPs according to SC types (ANCOVA results). The details
are identical to those in Table A1.
HRV Variable
Control
SC
Type
XB
δ (95% CI)
γ
HF [ms2]
LF [ms2]
TP [ms2]
HR [bpm]
TE
3.78
−0.52
(−1.23, 0.20)
0.56
SE
3.93
1.14
(−0.19, 2.46)
1.23
SY
4.09
0.31
(−0.71, 1.34)
0.36
TE
3.21
−0.06
(−0.83, 0.71)
0.06
SE
3.48
0.12
(−1.31, 1.54)
0.12
SY
4.22
0.35
(−0.74, 1.44)
0.38
TE
5.35
−0.12
(−0.77, 0.54)
0.14
SE
5.11
0.55
(−0.68, 1.79)
0.65
SY
5.97
0.09
(−0.85, 1.02)
0.11
TE
68.63
3.42
(−2.49, 9.32)
0.44
SE
70.54
5.59
(−5.48, 16.67)
0.72
SY
68.57
1.41
(−7.21, 10.02)
0.19
BP
XB δ (95% CI) γ
4.18
−0.29
(−0.93, 0.36)
0.32
4.13
−0.88
(−1.98, 0.23)
0.93
4.51
−0.54
(−1.42, 0.34)
0.56
3.58
0.10
(−0.59, 0.79)
0.11
4.53
−0.62
(−1.83, 0.58)
0.61
4.45
−0.40
(−1.38, 0.58)
0.37
5.61
0.45
(−0.15, 1.04)
0.54
6.14
−0.54
(−1.55, 0.48)
0.62
6.16
−0.35
(−1.15, 0.46)
0.39
68.02
4.79
(−0.71, 10.29)
0.62
70.60
0.93
(−8.46, 10.33)
0.12
65.27
9.45 *
(2.13, 16.77)
1.17
WP
XB δ (95% CI) γ
4.23
0.71 *
(0.13, 1.30)
0.69
4.80
0.06
(−0.84, 0.97)
0.06
5.58
−0.13
(−1.15, 0.88)
0.13
3.76
0.51
(−0.11, 1.12)
0.46
3.90
0.03
(−0.94, 0.99)
0.02
4.86
−0.26
(−1.31, 0.80)
0.25
6.02
0.28
(−0.25, 0.82)
0.30
6.04
0.18
(−0.64, 1.01)
0.20
6.69
−0.21
(−1.10, 0.68)
0.24
64.79
1.73
(−3.17, 6.63)
0.20
63.63
9.11 *
(1.40, 16.82)
1.07
62.81
3.14
(−4.87, 11.15)
0.40
BP–CN
∆ (95% CI) Γ
0.23
(−0.85, 1.32)
0.17
−2.01
(−4.05, 0.03)
0.79
−0.85
(−2.40, 0.69)
0.45
0.16
(−0.99, 1.32)
0.11
−0.74
(−2.99, 1.51)
0.26
−0.75
(−2.41, 0.91)
0.37
0.56
(−0.42, 1.55)
0.45
−1.09
(−3.00, 0.81)
0.46
−0.43
(−1.84, 0.98)
0.25
1.37
(−7.67, 10.41)
0.12
−4.66
(−21.76, 12.44)
0.22
8.04
(−4.87, 20.95)
0.50
WP–CN
∆ (95% CI) Γ
1.23 *
(0.24, 2.22)
1.02
−1.07
(−2.81, 0.66)
0.54
−0.45
(−2.14, 1.25)
0.21
0.56
(−0.50, 1.63)
0.44
−0.09
(−1.93, 1.75)
0.04
−0.61
(−2.35, 1.14)
0.28
0.40
(−0.52, 1.33)
0.36
−0.37
(−1.97, 1.23)
0.20
−0.30
(−1.79, 1.20)
0.16
−1.69
(−10.04, 6.66)
0.17
3.51
(−11.07, 18.10)
0.21
1.73
(−11.99, 15.46)
0.10
References
1. Statistics Korea. 2017 Population and Housing Census; Statistics Korea: Daejeon, Korea, 2018.
2. Livingston, G.; Sommerlad, A.; Orgeta, V.; Costafreda, S.G.; Huntley, J.; Ames, D.; Ballard, C.; Banerjee, S.;
Burns, A.; Cohen-Mansfield, J.; et al. The Lancet International Commission on Dementia Prevention and
Care. Lancet 2017, 390, 2673–2734. [CrossRef]
3. World Health Organization. Meeting on the Implementation of the Global Action Plan on the Public Health Response
to Dementia; World Health Organization: Geneva, Switzerland, 2018.
4. Intzandt, B.; Black, S.E.; Lanctot, K.L.; Herrmann, N.; Oh, P.; Middleton, L.E. Is Cardiac Rehabilitation
Exercise Feasible for People with Mild Cognitive Impairment? Can. Geriatr. J. 2015, 18, 65–72. [CrossRef]
[PubMed]
5. Bratman, G.N.; Daily, G.C.; Levy, B.J.; Gross, J.J. The benefits of nature experience: Improved affect and
cognition. Landsc. Urban Plan. 2015, 138, 41–50. [CrossRef]
6. Berman, M.G.; Kross, E.; Krpan, K.M.; Askren, M.K.; Burson, A.; Deldin, P.J.; Kaplan, S.; Sherdell, L.;
Gotlib, I.H.; Jonides, J. Interacting with nature improves cognition and affect for individuals with depression.
J. Affect. Disord. 2012, 140, 300–305. [CrossRef]
7. Shin, W.S.; Shin, C.S.; Yeoun, P.S. The influence of forest therapy camp on depression in alcoholics. Environ.
Health Prev. Med. 2012, 17, 73–76. [CrossRef] [PubMed]
8. Shin, W.S.; Shin, C.S.; Yeoun, P.S.; Kim, J.J. The Influence of interaction with forest on cognitive function.
Scand. J. For. Res. 2011, 26, 595–598. [CrossRef]
9. Hartig, T.; Mitchell, R.; Vries, S.D.; Frumkin4, H. Nature and Health. Annu. Rev. Public Health 2014, 35,
207–228. [CrossRef]
10. Gallis, C. Green Care: For Human Therapy, Social Innovation, Rural Economy, and Education; Nova Science
Publishers: Hauppauge, NY, USA, 2013.
11. Oh, B.; Lee, K.J.; Zaslawski, C.; Yeung, A.; Rosenthal, D.; Larkey, L.; Back, M. Health and well-being benefits
of spending time in forests: Systematic review. Environ. Health Prev. Med. 2017, 22, 71. [CrossRef]
12. Song, C.; Ikei, H.; Miyazaki, Y. Physiological Effects of Nature Therapy: A Review of the Research in Japan.
Int. J. Environ. Res. Public Health 2016, 13, 781. [CrossRef]
13. Li, Q. Forest Medicine; Nova Science Publishers: Hauppauge, NY, USA, 2012.
14. Li, Q.; Morimotoi, K.; Nakadai, A.; Inagaki, H.; Katsumata, M.; Shimizu, T.; Hirata, Y.; Hirata, K.; Suzuki, H.;
Miyazaki, Y.; et al. Forest bathing enhances human natural killer activity and expression of anti-cancer
proteins. Int. J. Immunopathol. Pharmacol. 2007, 20, 3–8. [CrossRef]

Int. J. Environ. Res. Public Health 2019, 16, 4325
18 of 20
15. Park, B.-J.; Tsunetsugu, Y.; Kasetani, T.; Hirano, H.; Kagawa, T.; Sato, M.; Miyazaki, Y. Physiological Effects of
Shinrin-yoku (Taking in the Atmosphere of the Forest)—Using Salivary Cortisol and Cerebral Activity as
Indicators. J. Physiol. Anthropol. 2007, 26, 123–128. [CrossRef] [PubMed]
16. Park, B.J.; Tsunetsugu, Y.; Kasetani, T.; Kagawa, T.; Miyazaki, Y. The physiological effects of Shinrin-yoku
(taking in the forest atmosphere or forest bathing): Evidence from field experiments in 24 forests across
Japan. Environ. Health Prev. Med. 2010, 15, 18–26. [CrossRef] [PubMed]
17. Lee, I.; Choi, H.; Bang, K.S.; Kim, S.; Song, M.; Lee, B. Effects of Forest Therapy on Depressive Symptoms
among Adults: A Systematic Review. Int. J. Environ. Res. Public Health 2017, 14, 321. [CrossRef] [PubMed]
18. Han, J.W.; Choi, H.; Jeon, Y.H.; Yoon, C.H.; Woo, J.M.; Kim, W. The Effects of Forest Therapy on Coping with
Chronic Widespread Pain: Physiological and Psychological Differences between Participants in a Forest
Therapy Program and a Control Group. Int. J. Environ. Res. Public Health 2016, 13, 255. [CrossRef]
19. Chun, M.H.; Chang, M.C.; Lee, S.J. The effects of forest therapy on depression and anxiety in patients with
chronic stroke. Int. J. Neurosci. 2017, 127, 199–203. [CrossRef]
20. Deckers, K.; van Boxtel, M.P.; Schiepers, O.J.; de Vugt, M.; Munoz Sanchez, J.L.; Anstey, K.J.; Brayne, C.;
Dartigues, J.F.; Engedal, K.; Kivipelto, M.; et al. Target risk factors for dementia prevention: A systematic
review and Delphi consensus study on the evidence from observational studies. Int. J. Geriatr. Psychiatry
2015, 30, 234–246. [CrossRef]
21. Jung, J. A Systematic Review of Forest Therapy Program on Older Adults. J. Humanit. Soc. Sci. 2019, 21,
1017–1032.
22. Lee, H.J.; Son, S.A. Psychological and Physical Effects of 10 Weeks Urban Forest Therapy Program on
Dementia Prevention in Low-Income Elderly Living Alone. J. People Plants Environ. 2018, 21, 557–564.
[CrossRef]
23. Lee, H.J.; Son, S.A. Qualitative Assessment of Experience on Urban Forest Therapy Program for Preventing
Dementia of the Elderly Living Alone in Low-Income Class. J. People Plants Environ. 2018, 21, 565–574.
[CrossRef]
24. Han, I.D.; Koo, C.-D. The Effect of Forest Healing Program on the Resilience of Elderly People in Urban
Forest. J. People Plants Environ. 2018, 21, 293–303. [CrossRef]
25. Kim, J.Y.; Shin, C.S.; Lee, J.K. The Effects of Forest Healing Program on Mental Health and Melatonin of the
Elderly in the Urban Forest. J. Korea Soc. Plants People Environ. 2017, 20, 95–106. [CrossRef]
26. Choi, J.-H.; Shin, C.-S.; Yeoun, P.-S. Effects of Forest-Walking Exercise on Functional Fitness and Gait Pattern
in the Elderly. J. Korean For. Soc. 2014, 103, 503–509. [CrossRef]
27. Mao, G.; Cao, Y.; Wang, B.; Wang, S.; Chen, Z.; Wang, J.; Xing, W.; Ren, X.; Lv, X.; Dong, J.; et al. The Salutary
Influence of Forest Bathing on Elderly Patients with Chronic Heart Failure. Int. J. Environ. Res. Public Health
2017, 14, 368. [CrossRef] [PubMed]
28. Mao, G.X.; Cao, Y.B.; Lan, X.G.; He, Z.H.; Chen, Z.M.; Wang, Y.Z.; Hu, X.L.; Lv, Y.D.; Wang, G.F.; Yan, J.
Therapeutic effect of forest bathing on human hypertension in the elderly. J. Cardiol. 2012, 60, 495–502.
[CrossRef]
29. Kim, J.Y.; Pham, D.D. Sasang constitutional medicine as a holistic tailored medicine. Evid. Based Complementary
Altern. Med. 2009, 6 (Suppl. 1), 9–11. [CrossRef]
30. Kim, J.U.; Ku, B.; Kim, Y.M.; Do, J.H.; Jang, J.S.; Jang, E.; Jeon, Y.J.; Kim, K.H.; Kim, J.Y. The concept of
sasang health index and constitution-based health assessment: An integrative model with computerized
four diagnosis methods. Evid. Based Complementary Altern. Med. 2013, 2013, 879420. [CrossRef]
31. Gates, N.; Fiatarone Singh, M.A.; Sachdev, P.S.; Valenzuela, M. The effect of exercise training on cognitive
function in older adults with mild cognitive impairment: A meta-analysis of randomized controlled trials.
Am. J. Geriatr. Psychiatry 2013, 21, 1086–1097. [CrossRef]
32. Hong, S.G.; Kim, J.H.; Jun, T.W. Effects of 12-Week Resistance Exercise on Electroencephalogram Patterns
and Cognitive Function in the Elderly with Mild Cognitive Impairment: A Randomized Controlled Trial.
Clin. J. Sport Med. 2018, 28, 500–508. [CrossRef]
33. Sung, S.-H.; Park, J.-H.; Lee, Y.-J.; Han, C.-H. The Analysis of Research Trends on Forest Therapy in the
Korean Journal. J. Korean Med. Rehabil. 2015, 25, 63–70. [CrossRef]
34. Chaochao, Y.; Le, W.; Lihong, K.; Feng, S.; Chaoyang, M.; Yanjun, D.; Hua, Z. Acupoint combinations used for
treatment of Alzheimer’s disease: A data mining analysis. J. Tradit. Chin. Med. 2018, 38, 943–952. [CrossRef]

Int. J. Environ. Res. Public Health 2019, 16, 4325
19 of 20
35. Shen, K.; Cho, Y.; Pascoe, E.M.; Hawley, C.M.; Oliver, V.; Hughes, K.M.; Baer, R.; Frazier, J.; Jarvis, E.;
Tan, K.S.; et al. The SIESTA Trial: A Randomized Study Investigating the Efficacy, Safety, and Tolerability of
Acupressure versus Sham Therapy for Improving Sleep Quality in Patients with End-Stage Kidney Disease
on Hemodialysis. Evid. Based Complementary Altern. Med. 2017, 2017, 7570352. [CrossRef] [PubMed]
36. Shang, C. Emerging paradigms in mind-body medicine. J. Altern. Complementary Med. 2001, 7, 83–91.
[CrossRef] [PubMed]
37. Visocchi, M. Spinal cord stimulation and cerebral haemodynamics. Hydrocephalus 2006, 99, 111–116.
38. Wolter, T.; Kieselbach, K. Cervical Spinal Cord Stimulation: An Analysis of 23 Patients with Long-term
Follow-up. Pain Physician 2012, 15, 203–212. [PubMed]
39. Kim, J.-H.; Cho, M.-R.; Park, G.-C.; Lee, J.-S. Effects of different acupuncture treatment methods on mild
cognitive impairment: A study protocol for a randomized controlled trial. Trials 2019, 20, 551. [CrossRef]
40. Borg, G.A. Psychophysical bases of perceived exertion. Med. Sci. Sports Exerc. 1982, 14, 377–381. [CrossRef]
41. Song, I.-B. An Introduction to Sasang Constitutional Medicine; Jimoondang: Seoul, Korea, 2005.
42. Han, Y.R.; Lee, H.B.; Han, S.Y.; Kim, B.J.; Lee, S.J.; Chae, H. Systematic review of type-specific
pathophysiological symptoms of Sasang typology. Integr. Med. Res. 2016, 5, 83–98. [CrossRef]
43. Jin, H.J.; Baek, Y.; Kim, H.S.; Ryu, J.; Lee, S. Constitutional multicenter bank linked to Sasang constitutional
phenotypic data. BMC Complement. Altern. Med. 2015, 15, 46. [CrossRef]
44. Baek, Y.-H.; Jang, E.-S.; Park, K.-H.; Yoo, J.-H.; Jin, H.-J.; Lee, S.-W. Development and Validation of Brief
KS-15 (Korea Sasang Constitutional Diagnostic Questionnaire) Based on Body Shape, Temperament and
Symptoms. J. Sasang Const. Med. 2015, 27, 211–221. [CrossRef]
45. Choi, S.-H. Longevity and Life Preservation in Eastern Medicine; Kyung Hee University Press: Seoul, Korea,
2009.
46. Chin, J.; Park, J.; Yang, S.J.; Yeom, J.; Ahn, Y.; Baek, M.J.; Ryu, H.J.; Lee, B.H.; Han, N.E.; Ryu, K.H.; et al.
Re-standardization of the Korean-Instrumental Activities of Daily Living (K-IADL): Clinical Usefulness for
Various Neurodegenerative Diseases. Dement. Neurocognitive Disord. 2018, 17, 11–22. [CrossRef]
47. Yesavage, J.A.; Brink, T.L.; Rose, T.L.; Lum, O.; Huang, V.; Adey, M.; Leirer, V.O. Development and validation
of a geriatric depression screening scale: A preliminary report. J. Psychiatr. Res. 1982, 17, 37–49. [CrossRef]
48. Cho, M.J.; Bae, J.N.; Suh, G.H.; Hahm, B.J.; Kim, J.K.; Lee, D.W.; Kang, M.H. Validation of Geriatric Depression
Scale, Korean Version (GDS) in the Assessment of DSM-III-R Major Depression. J. Korean Neuropsychiatr.
Assoc. 1999, 38, 48–63.
49. Han, J.W.; Kim, T.H.; Jhoo, J.H.; Park, J.H.; Kim, J.L.; Ryu, S.H.; Moon, S.W.; Choo, I.H.; Lee, D.W.; Yoon, J.C.;
et al. A Normative Study of the Mini-Mental State Examination for Dementia Screening (MMSE-DS) and Its
Short form (SMMSE-DS) in the Korean Elderly. J. Korean Geriatr. Psychiatry 2010, 14, 27–37.
50. Choi, J.; Ku, B.; You, Y.G.; Jo, M.; Kwon, M.; Choi, Y.; Jung, S.; Ryu, S.; Park, E.; Go, H.; et al. Resting-state
prefrontal EEG biomarkers in correlation with MMSE scores in elderly individuals. Sci. Rep. 2019, 9, 10468.
[CrossRef]
51. R Development Core Team. R: A Language and Environment for Statistical Computing; R Foundation for
Statistical Computing, Vienna, Austria, 2011. R Foundation for Statistical Computing: Vienna, Austria, 2011.
52. Van Buuren, S.; Groothuis-Oudshoorn, K. Mice: Multivariate Imputation by Chained Equations in R. J. Stat.
Softw. 2010, 45, 67. [CrossRef]
53. Rosnow, R.L.; Rosenthal, R.; Rubin, D.B. Contrasts and Correlations in Effect-Size Estimation. Psychol. Sci.
2016, 11, 446–453. [CrossRef]
54. Task Force of The European Society of Cardiology; The North American Society of Pacing and
Electrophysiology. Heart rate variability; Standards of measurement, physiological interpretation, and
clinical use. Eur. Heart J. 1996, 17, 354–381. [CrossRef]
55. Song, C.; Ikei, H.; Kobayashi, M.; Miura, T.; Taue, M.; Kagawa, T.; Li, Q.; Kumeda, S.; Imai, M.; Miyazaki, Y.
Effect of forest walking on autonomic nervous system activity in middle-aged hypertensive individuals: A
pilot study. Int. J. Environ. Res. Public Health 2015, 12, 2687–2699. [CrossRef]
56. Lee, J.; Tsunetsugu, Y.; Takayama, N.; Park, B.J.; Li, Q.; Song, C.; Komatsu, M.; Ikei, H.; Tyrvainen, L.;
Kagawa, T.; et al. Influence of forest therapy on cardiovascular relaxation in young adults. Evid. Based
Complementary Altern. Med. 2014, 2014, 834360. [CrossRef]
57. Aspinall, P.; Mavros, P.; Coyne, R.; Roe, J. The urban brain: Analysing outdoor physical activity with mobile
EEG. Br. J. Sports Med. 2015, 49, 272–276. [CrossRef]

Int. J. Environ. Res. Public Health 2019, 16, 4325
20 of 20
58. Neale, C.; Aspinall, P.; Roe, J.; Tilley, S.; Mavros, P.; Cinderby, S.; Coyne, R.; Thin, N.; Bennett, G.;
Thompson, C.W. The Aging Urban Brain: Analyzing Outdoor Physical Activity Using the Emotiv Affectiv
Suite in Older People. J. Urban Health 2017, 94, 869–880. [CrossRef] [PubMed]
59. Shafer, K.J.; Siders, W.A.; Johnson, L.K.; Lukaski, H.C. Validity of segmental multiple-frequency bioelectrical
impedance analysis to estimate body composition of adults across a range of body mass indexes. Nutrition
2009, 25, 25–32. [CrossRef] [PubMed]
60. Raja, M.K.; Raymer, G.H.; Moran, G.R.; Marsh, G.; Thompson, R.T. Changes in tissue water content measured
with multiple-frequency bioimpedance and metabolism measured with 31P-MRS during progressive forearm
exercise. J. Appl. Physiol. 2006, 101, 1070–1075. [CrossRef] [PubMed]
61. Jackson, C.E.; Snyder, P.J. Electroencephalography and event-related potentials as biomarkers of mild
cognitive impairment and mild Alzheimer’s disease. Alzheimer’s Dement 2008, 4 (Suppl. 1), 137–143.
[CrossRef]
62. Moretti, D. Individual analysis of EEG frequency and band power in mild Alzheimer’s disease. Clin.
Neurophysiol. 2004, 115, 299–308. [CrossRef]
63. Hogan, M.J.; Swanwick, G.R.J.; Kaiser, J.; Rowan, M.; Lawlor, B. Memory-related EEG power and coherence
reductions in mild Alzheimer’s disease. Int. J. Psychophysiol. 2003, 49, 147–163. [CrossRef]
64. Sardinha, L.B. Physiology of exercise and phase angle: Another look at BIA. Eur. J. Clin. Nutr. 2018, 72,
1323–1327. [CrossRef]
65. Souza, M.F.; Tomeleri, C.M.; Ribeiro, A.S.; Schoenfeld, B.J.; Silva, A.M.; Sardinha, L.B.; Cyrino, E.S. Effect of
resistance training on phase angle in older women: A randomized controlled trial. Scand. J. Med. Sci. Sports
2017, 27, 1308–1316. [CrossRef]
66. Jun, M.H.; Kim, S.; Ku, B.; Cho, J.; Kim, K.; Yoo, H.R.; Kim, J.U. Glucose-independent segmental phase
angles from multi-frequency bioimpedance analysis to discriminate diabetes mellitus. Sci. Rep. 2018, 8, 648.
[CrossRef]
67. Kyle, U.G.; Genton, L.; Pichard, C. Low phase angle determined by bioelectrical impedance analysis is
associated with malnutrition and nutritional risk at hospital admission. Clin. Nutr. 2013, 32, 294–299.
[CrossRef]
68. Stapel, S.N.; Looijaard, W.G.P.M.; Dekker, I.M.; Girbes, A.R.J.; Weijs, P.J.M.; Straaten, H.M.O.V. Bioelectrical
impedance analysis-derived phase angle at admission as a predictor of 90-day mortality in intensive care
patients. Eur. J. Clin. Nutr. 2018, 72, 1019–1025. [CrossRef] [PubMed]
69. Maddocks, M.; Kon, S.S.; Jones, S.E.; Canavan, J.L.; Nolan, C.M.; Higginson, I.J.; Gao, W.; Polkey, M.I.;
Man, W.D. Bioelectrical impedance phase angle relates to function, disease severity and prognosis in stable
chronic obstructive pulmonary disease. Clin. Nutr. 2015, 34, 1245–1250. [CrossRef] [PubMed]
70. Grundmann, O.; Yoon, S.L.; Williams, J.J. The value of bioelectrical impedance analysis and phase angle in
the evaluation of malnutrition and quality of life in cancer patients—A comprehensive review. Eur. J. Clin.
Nutr. 2015, 69, 1290–1297. [CrossRef] [PubMed]
71. Shim, E.B.; Leem, C.H.; Kim, J.J.; Kim, J.Y. Lower cellular metabolic power can be an explanation for obesity
trend in Tae-Eum type: Hypothesis and clinical observation. Integr. Med. Res. 2017, 6, 254–259. [CrossRef]
72. Shim, E.B.; Lee, S.W.; Kim, J.Y.; Leem, C.H.; Earm, Y.E. Taeeum-type people in Sasang constitutional medicine
have a reduced mitochondrial metabolism. Integr. Med. Res. 2012, 1, 41–45. [CrossRef]
73. Baek, Y.; Park, K.; Lee, S.; Jang, E. The prevalence of general and abdominal obesity according to sasang
constitution in Korea. BMC Complement. Altern. Med. 2014, 14, 298. [CrossRef]
74. Cho, N.H.; Kim, J.Y.; Kim, S.S.; Lee, S.K.; Shin, C. Predicting type 2 diabetes using Sasang constitutional
medicine. J. Diabetes Investig. 2014, 5, 525–532. [CrossRef]
75. Song, K.H.; Yu, S.G.; Kim, J.Y. Prevalence of Metabolic Syndrome according to Sasang Constitutional Medicine
in Korean Subjects. Evid. Based Complementary Altern. Med. 2012, 2012, 646794. [CrossRef]
76. Lee, S.K.; Yoon, D.W.; Yi, H.; Lee, S.W.; Kim, J.Y.; Kim, J.K.; Hong, J.H.; Shin, C. So-eum type as an independent
risk factor for irritable bowel syndrome: A population-based study in Korea. J. Altern. Complement. Med.
2014, 20, 846–852. [CrossRef]
© 2019 by the authors. Licensee MDPI, Basel, Switzerland. This article is an open access
article distributed under the terms and conditions of the Creative Commons Attribution
(CC BY) license (http://creativecommons.org/licenses/by/4.0/).