
Utah State University
DigitalCommons@USU
All Graduate Theses and Dissertations
Graduate Studies
8-2012
An Exploration of the Relationships Among Connectedness to
Nature, Quality of Life, and Mental Health
Peter Gelden Tauber
Utah State University
Follow this and additional works at: https://digitalcommons.usu.edu/etd
Part of the Psychology Commons
Recommended Citation
Tauber, Peter Gelden, "An Exploration of the Relationships Among Connectedness to Nature, Quality of
Life, and Mental Health" (2012). All Graduate Theses and Dissertations. 1260.
https://digitalcommons.usu.edu/etd/1260
This Thesis is brought to you for free and open access by
the Graduate Studies at DigitalCommons@USU. It has
been accepted for inclusion in All Graduate Theses and
Dissertations by an authorized administrator of
DigitalCommons@USU. For more information, please
contact digitalcommons@usu.edu.

AN EXPLORATION OF THE RELATIONSHIPS AMONG CONNECTEDNESS
TO NATURE, QUALITY OF LIFE, AND MENTAL HEALTH
by
Peter G. Tauber
A thesis submitted in partial fulfillment
of the requirements for the degree
of
MASTER OF SCIENCE
in
Psychology
Approved:
Gayle S. Morse, Ph.D.
Committee Chair
M. Scott DeBerard, Ph.D.
Committee Member
JoAnn T. Tschanz, Ph.D.
Committee Member
Mark R. McLellan, Ph.D.
Vice President for Research and
Dean of the School of Graduate Studies
UTAH STATE UNIVERSITY
Logan, Utah
2012

ii
Copyright © Peter G. Tauber 2012
All Rights Reserved

iii
ABSTRACT
An Exploration of the Relationships Among Connectedness to Nature,
Quality of Life, and Mental Health
by
Peter G. Tauber, Master of Science
Utah State University, 2012
Major Professor: Gayle S. Morse, Ph.D.
Department: Psychology
The current study examined the relationships among connectedness to nature
(CTN), quality of life (QOL), and mental health (MH). Theory in biophilia and
ecopsychology has emphasized the importance of the human relationship with the natural
world for the health of individuals, our species, and our planet as a whole. Previous
research has documented the relationship between experiences in nature and outcomes of
health and well-being. However, scant research has examined the correlates of the
concept of CTN. Furthermore, no research has examined the relationship between CTN
and measures of well-being such as QOL or MH. In the current study, 267 undergraduate
students completed a series of self-report items measuring CTN, QOL, MH, and
demographic characteristics. Significant relationships between CTN and all categories of
dependent variables (QOL, MH, and demographics) were found. In addition, the
subcategory of CTN closely related to the desire for direct experiences in nature, NR

iv
experience was shown to have a stronger relationship to QOL and MH than overall
CTN—as evidenced by more significant correlations and by serving as a better predictive
model through multiple regression. QOL, MH, and demographic variables were
collectively found to predict 21% of the variance in overall CTN, while those same
variables were found to predict 35% of the variance in NR experience. Implications of
these findings based on previous research, limitations of the current study, and future
avenues of research are discussed.
(126 pages)

v
PUBLIC ABSTRACT
An Exploration of the Relationships Among Connectedness to Nature,
Quality of Life, and Mental Health
by
Peter G. Tauber, Master of Science
Utah State University, 2012
In recent decades, a new branch of psychology has emerged—ecopsychology. This field
looks at the complex relationship between human beings and the natural world. Previous
research has shown the importance of direct experiences in nature for the promotion of
human health and well-being. However, it is still not understood why these experiences
in nature carry so much importance.
It is possible that the concept of connectedness to nature (CTN) plays a role in this
relationship between nature and wellness. CTN is defined as feelings of close affiliation
with the natural world in a physical, cognitive, and emotional manner. Previous research
leaves open the possibility that these feelings of affiliation and connectedness may
contribute to well-being.
To try to better understand this idea, a survey was designed to measure CTN, quality of
life, and mental health. Since research of these ideas has never been performed before,
this should be considered an exploratory project. In this current study, 267
undergraduates at Utah State University participated.
Results indicated that certain aspects of mental health and quality of life were related to
overall CTN. First, relationships were found between mental health and quality of life
variables and one specific aspect of CTN which can also be thought of as the desire to
have direct experiences in the natural world. Second, demographic factors such as age,
gender, and ethnicity were all associated with CTN. Future research should try to
understand what things might contribute to CTN and to develop interventions which
might increase CTN and well-being.

vi
ACKNOWLEDGMENTS
First and foremost, I would like to extend my greatest feelings of appreciation and
gratitude to my advisor, Dr. Gayle Morse. Gayle, your support, encouragement, and wise
counsel throughout this process have been invaluable. You have been my rock, providing
not only academic guidance but personal and spiritual support as well. I do not believe
that I could have made it to this point without your compassion, strength, and wisdom. I
could not have asked for a better advisor and mentor. I extend my deepest bow to you.
I would also like to thank the other members of my committee, Drs. Joann
Tschanz and Scott DeBerard. Through your guidance, I have learned how to transform
my writing from the flowery, descriptive prose consistent with my liberal arts
background into the precise, evidence-based style of scientific writing where claims are
always accompanied by supporting evidence. In addition, your insistence on
methodological and statistical rigor has challenged me to think critically about the
research process and greatly aided in my development as a scientist.
I could also not have made it to this point without the support of my family and
the unconditional love and acceptance of my parents, John and Suzy Tauber. Mom and
Dad, it was your continual support and warmth from the day of my birth until the present
that enabled me to grow and flourish. You have instilled in me the value of education and
the feeling of accomplishment that comes when hard work is met with success in any
domain. I am deeply grateful for your continued love, guidance, and support. I love you
both immeasurably.
I would also like to thank my friends at USU for their continued support and care.

vii
Krista, Ellen, Sarah, Justice, Morey, and James—thank you all so much for your support.
You provided me with advice and ideas when I needed them, a shoulder to lean on when
feeling weak, and companionship to celebrate the many good times that we shared. I
could rely on you to help me through difficult times, be they academic or personal in
nature. I simply could not have made it to this point without your support, smiles, and
thoughtfulness.
Finally, I would like to acknowledge my greatest inspiration for this entire
project—nature herself. Were it not for the days spent bobbing on my surfboard in the
Pacific, the nights underneath the limitless expanse of Utah’s skies, the moments of
unbearable beauty that accompany the rise and setting of the sun, and the countless
moments of awe that accompany my time in the green mountains and red rock desert, I
would not have my passion for this field and this idea.
Namaste—a deep bow to you all.
Peter G. Tauber

viii
CONTENTS
Page
ABSTRACT................................................................................................................... iii
PUBLIC ABSTRACT ................................................................................................... v
ACKNOWLEDGMENTS ............................................................................................. vi
LIST OF TABLES ......................................................................................................... x
LIST OF FIGURES ....................................................................................................... xi
CHAPTER
I. INTRODUCTION .......................................................................................... 1
II. LITERATURE REVIEW ............................................................................... 4
The Literature Review Procedure ................................................................... 4
Philosophical and Theoretical Underpinnings of Connectedness to Nature... 5
Measures Quantifying the Human-Nature Relationship................................. 9
Quality of Life................................................................................................. 16
Quality of Life and Connectedness to Nature................................................. 20
Mental Health and Connectedness to Nature.................................................. 24
Mental Health.................................................................................................. 31
Quality of Life and Mental Health.................................................................. 32
Concluding Remarks....................................................................................... 33
Specific Aims and Research Questions .......................................................... 33
III. METHODS ..................................................................................................... 35
Setting and Sample ......................................................................................... 35
Measures ......................................................................................................... 36
Procedure ........................................................................................................ 42
IV. RESULTS ....................................................................................................... 43
Descriptive Statistics....................................................................................... 44
Aim 1: Connectedness to Nature and Demographics ..................................... 44
Aim 2: Connectedness to Nature and Quality of Life..................................... 49
Aim 3: Connectedness to Nature and Mental Health...................................... 51

ix
Page
Aim 4: Multiple Regression............................................................................ 53
V. DISCUSSION ................................................................................................. 61
Demographics ................................................................................................. 62
Implications for Past Theory and Research .................................................... 62
CTN and Demographics ................................................................................. 63
CTN and QOL................................................................................................. 66
CTN and Mental Health.................................................................................. 70
CTN and Predictors......................................................................................... 74
Limitations ...................................................................................................... 75
Implications..................................................................................................... 78
Future Directions ............................................................................................ 79
REFERENCES .............................................................................................................. 81
APPENDICES ............................................................................................................... 91
Appendix A: Letter of Information............................................................... 92
Appendix B: Demographic Questionnaire ................................................... 95
Appendix C: Nature Relatedness Scale ........................................................ 97
Appendix D: WHOQOL-BREF ................................................................... 99
Appendix E: Histograms for Distribution of NR Scale Scores .................... 103
Appendix F: Histograms for Distribution of WHOQOL Scale Scores........ 106
Appendix G: Histograms for Distribution of SCL-90 Scale Scores............. 110

x
LIST OF TABLES
Table
Page
1. Examples of Items from Each Subscale of the NR Scale .................................. 38
2. Examples of Items from Each Subscale of the WHOQOL-BREF .................... 39
3. Demographic Characteristics of the Sample...................................................... 45
4. Descriptive Statistics for Nature Relatedness Scales......................................... 46
5. Correlations Between Connectedness to Nature and Demographic
Variables ............................................................................................................ 47
6. Descriptive Statistics of WHOQOL-BREF Compared to a Normative
Sample................................................................................................................ 49
7. Correlations Between Connectedness to Nature and Quality of Life
Variables ............................................................................................................ 50
8. Descriptive Statistics of the SCL-90 Compared to a Normative Sample .......... 52
9. Correlations Between Connectedness to Nature and Mental Health
Variables ............................................................................................................ 53
10. Correlations Among All Study Variables .......................................................... 54
11. Multiple Regression: Predicting Overall Nature Relatedness with
Demographic Variables, QOL Variables, and GSI............................................ 56
12. Multiple Regression: Predicting Overall Nature Relatedness with
Demographic, QOL, and Mental Health Variables ........................................... 58
13. Multiple Regression: Predicting NR Experience with Demographic, QOL,
and Mental Health Variables ............................................................................. 60

xi
LIST OF FIGURES
Figure
Page
1. The Inclusion of Nature in Self scale................................................................. 13
E-1. Distribution of NR “self” scale scores ............................................................... 104
E-2. Distribution of NR “perspective” scale scores................................................... 104
E-3. Distribution of NR “experience” scale scores ................................................... 105
E-4. Distribution of NR “overall” scale scores.......................................................... 105
F-1. Distribution of WHOQOL “physical” scale scores ........................................... 107
F-2. Distribution of WHOQOL “psychological” scale scores .................................. 107
F-3. Distribution of WHOQOL “social relationships” scale scores.......................... 108
F-4. Distribution of WHOQOL “environment” scale scores .................................... 108
F-5. Distribution of WHOQOL “overall” scale scores ............................................. 109
G-1. Distribution of SCL-90 “somatization” scale scores ......................................... 111
G-2. Distribution of SCL-90 “obsessive-compulsive” scale scores........................... 111
G-3. Distribution of SCL-90 “interpersonal sensitivity” scale scores ....................... 112
G-4. Distribution of SCL-90 “depression” scale scores............................................. 112
G-5. Distribution of SCL-90 “anxiety” scale scores .................................................. 113
G-6. Distribution of SCL-90 “hostility” scale scores................................................. 113
G-7. Distribution of SCL-90 “paranoid ideation” scale scores.................................. 114
G-8. Distribution of SCL-90 “psychoticism” scale scores......................................... 114
G-9. Distribution of SCL-90 “global severity index” scale scores ............................ 115

CHAPTER I
INTRODUCTION
Many consider the beginning of the modern environmental movement to reach
back into to the middle of the 20th century with the publication of seminal works like
Aldo Leopold’s (1949) A Sand County Almanac and Rachel Carson’s Silent Spring
(1962), capitulating with a spate of national legislation in the 60s and 70s such as the
National Environmental Policy Act (1969), the Clean Air Act (1963), and the Endangered
Species Act (1973). Now we are witnessing a second resurgence in environmental
interest due to the salience of global climate change and the influence of high-profile
environmentalists such as Al Gore and films such as An Inconvenient Truth (Bender &
Guggenheim, 2006). The contemporary environmental movement has raised awareness
of the consequences of our planet-affecting actions on both our species and our planet as
a whole.
While the modern environmental movement in the United States is still relatively
new, other cultures have always valued the importance of preserving our land and
maintaining a balance between the natural and built environment. For example, those
who ascribe to traditional Native American beliefs typically do not recognize a separation
between their personal identity and the natural world; often both nature and their
environment are included in their sense of self. For these people, harm committed against
nature and the environment can be considered personal harm (LaDuke, 2005). In this way
personal health and psychological well-being are closely tied with the health and well-
being of the ecosystem. In contrast to those long-held beliefs of Native cultures,

2
contemporary Western culture is now just beginning to examine the link between nature
and psychological health. This is evident in treatises defining the burgeoning field of
ecopsychology (Roszak, Gomes, & Kanner, 1995) and its subfield, ecotherapy (Buzzell
& Chalquist, 2009). These compilations emphasize the important role of the human
relationship with the natural world for promoting and maintaining psychological health.
Indeed, recent research has begun to examine this human-nature connection.
Several measures have recently been created which attempt to quantify the concept of
connectedness to nature (Mayer & Frantz, 2004; Nisbet, Zelenski, & Murphy, 2009;
Schultz, 2002). For the purpose of this study, connectedness to nature can be defined as
the extent to which an individual’s view of nature is incorporated into their perception of
their own sense of self (Schultz, 2002). This broad definition includes physical, cognitive,
and emotional elements of that relationship. Nature in this sense can be defined as spaces
big or small consisting predominantly of flora and fauna and having little or no human
constructions (Schultz, 2000). Now that the concept of connectedness to nature has now
been defined and rendered quantifiable, emerging research has examined the relationship
between this variable and other important indicators of well-being such as psychological
health and quality of life (QOL).
Since research indicates that 46.4% of all Americans will suffer from a mental
health (MH) disorder at some point in their lives (Kessler et al., 2005), it is crucial to gain
more knowledge about the potential connections between MH and other personal
characteristics like one’s relationship with the natural world. If people are motivated to
increase their sense of connectedness to the natural world for personal reasons such as

3
improvements in their own health and well-being, then they may be more motivated to
seek out a more personal affiliation with the natural world. But, to date, no research has
examined the links between sentiments of connectedness to the natural world and
measures of physical or psychological health. However, emerging research has linked
experiences in the natural world with health and well-being. Experiences in nature have
been associated with significant personal gains such as an increase in positive affect
(Burns, 2008), decreased substance use (Frumkin, 2001), and lower rates of symptoms of
mental distress (Chalquist, 2009).
This new and interesting research suggests that it may be possible that one’s
sentiments of connectedness to nature (CTN) are also related to wellness. In order to
explore this, the current research will frame CTN around the broad concept of QOL as
well as aspects of MH. To date no one has directly examined the link between beliefs and
perceptions of a personal connection to nature and a broad measurement of QOL. Nor has
a comprehensive measure of MH been applied to this issue either. The following review
of the literature will critique and synthesize the previous research centered on the concept
of connectedness to nature and its relationship to health and QOL. In addition, this review
will examine what specific aspects of QOL and MH are most related to the human
connection with nature, and how they are related.

4
CHAPTER II
LITERATURE REVIEW
The Literature Review Procedure
Objectives
To understand of the current state of research with regards to connectedness to
nature, health, and well-being, this chapter has three objectives: (a) to describe the current
state of research regarding exposure and connectedness to nature and their relationships
to health and QOL; (b) to discuss the issues, strengths, and weaknesses in previous
research regarding the above topics; and (c) to draw conclusions based on this
information from which the research questions and strategies for this study were
formulated.
Keywords
A preliminary search of the PsycINFO, Academic Search Premier, and Utah State
University library databases was conducted to identify all studies published prior to
August, 2011, that reported either: (a) measures of connectedness to nature or (b) the
effects on health and wellbeing of time spent in the natural world. A variety of search
terms and search term combinations were used including: CONNECTEDNESS,
CONNECT* TO NATURE, CONNECT* TO ENVIRONMENT, and NATURE AND
HEALTH. Additional articles were found through the reference sections of articles
identified through the database searches and from review articles on the health effects of
time spent in nature (Chalquist, 2009; Frumkin, 2001).

5
Inclusion/Exclusion Criteria
Articles were included in this literature review if they met one of the following
criteria: (a) they contained a measure quantifying a sentiment of connection to the natural
world or (b) they documented the relationship between time spent in nature and physical
and/or MH. Studies were excluded if either: (a) no measure of connectedness to nature
was mentioned or (b) the study did not document the effects of health and well-being for
an intervention in the natural world.
Philosophical and Theoretical Underpinnings of
Connectedness to Nature
Overview
The goal of this section is to summarize the theory which could be used to explain
the importance and significance of the human connection to nature. In an attempt to find
contemporary theory which explains the affiliation between humans and the natural
world, works from diverse fields such as biology, philosophy, and psychology were
examined.
The Biophilia Hypothesis
It is evident that many people value nature highly and are willing to spend
significant amounts of time and money in order to interact with it through behaviors such
as paying a premium for a good view, devoting time to a garden, or hiking or driving
great distances to reach a desired natural setting (Clayton, 2003). The biophilia
hypothesis (Kellert & Wilson, 1993; Wilson, 1984) posits that there is an innate

6
emotional affiliation of human beings to other living organisms. This hypothesis suggests
that humans have grown to appreciate and protect other forms of life. Furthermore, the
demonstration of respect for all forms of life on this planet may assure our continued
survival as a species as the interconnected nature of life on this planet requires the
maintenance of a harmonious equilibrium between all forms of life.
This human need to affiliate with other living creatures extends far beyond the
mere exploitation of nature’s material resources to include the influence of nature on our
emotional, cognitive, aesthetic, and even spiritual development (Kellert, 1993). Thus, our
inherent Biophilia pervasively influences our thoughts and feelings. Sentiments of
affiliation vary on a personal level and some of that variation may be accounted for by
factors such as one’s level of exposure to nature. Still, it is hypothesized that all human
beings possess some degree of biophilia (Kellert & Wilson, 1993; Wilson, 1984). And,
by tapping into this trait through empirical investigation, it is possible to gain a greater
understanding of the reasons behind humans’ inherent connection to the natural world.
Deep Ecology
Viewing ourselves as a part of nature and understanding this human connection to
nature has also been explored in the field of deep ecology (Roszak et al., 1995). Deep
Ecology approaches the issue from a mainly philosophical and theoretical perspective. It
emphasizes the development of theory exploring the interconnectedness of all life forms
and the inherent value of all living creatures. However, perhaps due to the inability to
operationalize its terms and assess them in an empirical manner, deep ecology lacks
empirical support in the literature. Nevertheless, its theoretical propositions, such as the

7
connectedness of all living creatures and the inherent value of all living beings for
nonutilitarian reasons, has strongly influenced both the environmental movement and
contemporary theories of human connectedness to the natural world. These in turn have
led to more direct, empirical applications of this theory which examine the human
relationship with nature through the field of ecopsychology.
Ecopsychology
Ecopsychology concerns itself with more applied and practical aspects of
humans’ connectedness to nature. Through research and practice, the field of
ecopsychology seeks to explore more specific details regarding the human-nature
relationship. It places psychological research and the study of wellness in the context of
our current ecological systems. This includes experimental research published in peer-
reviewed journals such as Ecopsychology. For example, a recent issue of this journal
covered such diverse areas as outcome data for youth offenders who participate in a
wilderness adventure program (Russell, 2010) and the efficacy of applying different
social psychological principles to improve conservation behaviors (Meineri, Martin, &
Grandjean, 2010). In addition, the ecopsychology movement also targets the general
public through the publication of mass-market monographs such as those by Richard
Louv (Last Child in the Woods and The Nature Principle) and Bill McKibben (The End
of Nature and Deep Economy). Ecopsychology has also gained a foothold in the fields of
psychotherapy and counseling. In ecotherapy (Buzzell & Chalquist, 2009), the authors
explored how nature can be applied to a therapeutic context in diverse areas such as
equine therapy, couples work, and work with trauma.

8
Ecopsychological theory emphasizes the importance of expanding our sense of
self to include other living beings and the natural environment as a whole in addition to
empathizing with other forms of life. This concept of an ecological self as a nature-
inclusive identity is synonymous with a belief in the human connection to nature.
Including nature in one’s self-identity implies a perception of belonging to nature and
relating with it intimately. Although there has been a lack of empirical research regarding
the specific concept of ecological self, numerous researchers have attempted to quantify
the human-nature relationship in other terms with a variety of scales and measures.
Summary of the Theoretical Underpinnings
of Connectedness to Nature
Based on the above findings, there is an emerging literature base which informs
the theoretical understanding of CTN. Through the work of biologists, philosophers and
psychologists, the significance and importance of the human-nature connection has been
suggested. A relationship with the natural world is hypothesized to directly affect one’s
physical, mental, and overall wellness through the benefits gained by increased exposure
to nature and positive experiences in the natural world. Sentiments of connectedness to
the natural world may also be interpreted as a representation of the intention to be
integrated more fully with the other living beings on this planet and in that regard may be
related to QOL and wellness. Thus, the goal of the current project is to empirically
investigate how sentiments of connectedness to the natural world are related to wellbeing
and to gain a better understanding of the significance of the human-nature connection
through empirical exploration.

9
Measures Quantifying the Human-Nature Relationship
Overview
A review of the measures used to examine the human-nature relationship provides
an overview of how the above theoretical underpinnings can be placed in an applied,
empirical context. The goal of this section is to document previously published measures
purporting to describe the human-nature relationship and then engage in a critical
analysis of their strengths and weaknesses. The objective of this section is to determine
which measures, if any, could be deemed appropriate for the current study involving the
construct of CTN.
The New Ecological Paradigm
The concept of the human connection to the natural world described by the
biophilia hypothesis and in the ecopsychology movement has been studied empirically
using measures that quantify and categorize the human relationship with the natural
environment. The first researchers in this area concerned themselves with developing a
paper and pencil survey to quantify how one can measure sentiments and attitudes
towards nature and the environment. The result of this inquiry was the development of
the new environmental paradigm, the first measure designed to tap into personal attitudes
and beliefs about nature (Dunlap & VanLiere, 1978). It was later updated to become the
new ecological paradigm (NEP; Dunlap, Van Liere, Mertig, & Jones, 2000).
The 15 item NEP is a measurement of people’s ecological worldviews and
environmental concern. It measures the degree to which a person views humans as an

10
integral part of the natural environment instead of being seen as separate from nature. It
also taps basic, essential beliefs about the nature of the earth and humanity’s relationship
with it. Representative items include “plants and animals have as much of a right to exist
as humans,” “the balance of nature is very delicate and easy to upset,” and “humans have
the right to modify the natural environment to suit their needs.” Overall, the measure
elicits cognitive beliefs about people’s relationship with the natural world. However, the
measure lacks items which go beyond cognitions to include a sense of emotional or
physical affiliation with the natural world. The measure also lacks items which directly
tap into the concept of CTN elucidated in the theoretical literature of biophilia or
ecopsychology. Thus, while its cognitively based statements certainly tap into people’s
beliefs about the human relationship with nature, the measure fails to include physical,
emotional, or behaviorally-based manifestations of connectedness to nature relevant to
this study.
Environmental Value Orientations Scale
Similar to the highly cognitive NEP, a different measure was created by Stern and
Dietz (1994) to examine the origins of people’s environmental concern: the
Environmental Value Orientations Scale. Using factor analytic techniques they
demonstrated that environmental concerns are related to three different value
orientations: egoistic, social-altruistic, and biospheric values. Egoistic values describe
attention to environmental issues that affect people personally (“I am concerned about
environmental problems because of the consequences for: me, my lifestyle, my health,
my future”). Social-altruistic values describe environmental action from a place of moral

11
obligation and attending to environmental issues that have consequences to other human
beings (“I am concerned about environmental problems because of the consequences for:
people in my community, all people, children, future generations”). Biospheric values
describe judging environmental issues on the basis of the cost and benefits to nature and
the biosphere as a whole, thus giving the environment itself moral consideration (“I am
concerned about environmental problems because of the consequences for: plants, marine
life, birds, animals”). These value domains are all measured by separate scales which are
independently calculated.
This measure elicits the reasons why people may be concerned about the
environment as opposed to simply documenting the extent of their sentiments of concern.
In addition, this measure is worded within the context of “concern about environmental
problems.” This is understood to activate both the cognitive and emotional facets of
environmental concern. However, this scale lacks components which would make it an
appropriate measure of connectedness to nature. Concern for nature is different from
connectedness to nature; one can feel concerned about another being or system without
expressing strong sentiments of connectedness to that being or system. While this scale is
unique in its disambiguation of the reasons why people may be concerned about the
environment as well as its emotion-oriented language, it is not an appropriate measure for
the concept of connectedness to nature in this study.
Environmental Attitudes Scale
Similarly, Thompson and Barton (1994) formulated two distinct attitudes toward
the environment in their Environmental Attitudes Scale. In their measure, one subscale

12
tracks ecocentrism—valuing nature for its own sake and protecting it because of its
intrinsic value. The other subscale, Anthropocentrism, is defined by the belief that nature
should be valued only for the material and physical benefits that it can provide for
humans. Those with strong ecocentric values were more likely to endorse conservation
behaviors and belong in environmental organizations. Those with strong Anthropocentric
values were more likely to endorse environmental apathy and less likely to engage in pro-
environmental behaviors. This measure is inappropriate for use in the current because it
examines attitudes and values towards the natural world which are distinct from the
concept of connectedness to nature and do not tap an emotional, cognitive, or physical
strength of affiliation with the natural world.
Inclusion of Nature in Self Scale
Instead of framing the human relationship with nature around environmental
concerns, other researchers have focused on specific qualities of peoples’ connection to
the natural world and related those to pro-environmental behaviors. The concept of
connectedness to nature was first introduced by Schultz, who designed a measure to
examine the extent that people viewed themselves as part of the natural environment
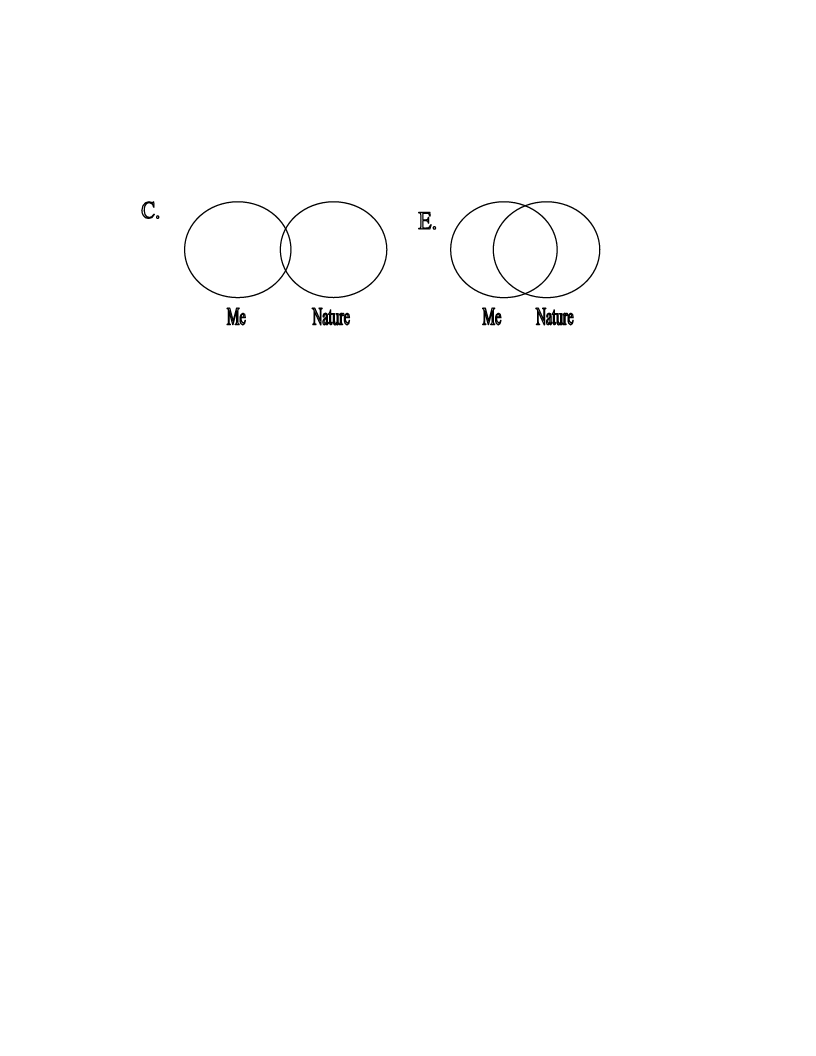
(Schultz, 2000, 2001). The Inclusion of Nature in Self scale taps beliefs regarding one’s
feelings of connection to the natural world through a visual metaphor of overlapping
circles (see Figure 1). More overlap between the two circles of “me” and “nature”
indicates a stronger connection between those two domains. This method of measuring
connectedness to nature confers many advantages. Its visual, nonlinguistic nature allows
the subject to express their choice in a context free from the construct of language. This
13
Choose the one pair of circles that best represents your sense of connection to the natural world and circle
that set:
Figure 1. The Inclusion of Nature in Self scale.
could potentially create a less biased and more intuitive measure. In addition, its
simplicity and facility of administration make it a very accessible measure to administer.
However, it also suffers from a few disadvantages. It offers no details or reasons as to
why one may feel that sense of connection. While potentially useful as a single-item
measure, it is unclear whether this is a true measure of connectedness to nature or if it
could merely be tapping sentiments of affiliation or preference. Furthermore, as a single-
item measure, it is impossible to judge internal consistency or reliability. Therefore this
measure is not appropriate for use in the current study.
Environmental Identity Scale
Other researchers have been more concerned with issues of identity. Clayton
(2003) established a different approach to the topic of the human relationship with the
natural environment. She described Environmental Identity through the establishment of
a personal sense of connection to the natural environment which is based on history,
similarity, and feelings of personal connection (Clayton, 2003). The Environmental

14
Identity Scale (EIS) combines past and present interactions with nature, self-
identification with nature, environmental ideology, and emotional response to nature to
create a measure of environmental identity. Environmental identity has been shown to
positively correlate with pro-environmental behavior. Thus, someone with a stronger
environmental identity would be more likely to endorse efforts of resource conservation
and environmental protection. Likewise, those with a weaker environmental identity
would be less likely to favor the protection of the environment or the conservation of
natural resources. Although the EIS does tap into certain aspects of connectedness to
nature such as one’s sense of overlap between personal identity and environmental
identity, it also draws upon past experiences with nature and political values. Therefore,
the EIS broadens the concept of connectedness to the natural world desired for this study
by bringing in political beliefs and past experiences in the natural world, and this does not
fit the concept of connectedness to nature desired for measurement in this study.
Connectedness to Nature Scale
Another measure designed to quantify the concept of connectedness to nature is
the Connectedness to Nature Scale (CNS; Mayer & Frantz, 2004). Based on the theory
and writings of Aldo Leopold (Leopold, 1949), the 14-item CNS was designed to
measure “an individual’s affective, experiential connection to nature” (Mayer & Frantz,
2004). Sample items include, “I often feel a sense of oneness with the natural world
around me,” “I think of the natural world as a community to which I belong,” and “I
often feel a kinship with animals and plants” (Mayer & Frantz, 2004). The CNS is an
effective measure of environmental attitudes, a multi-item scale, and a good predictor of

15
environmental behavior. However, the measure also has a few drawbacks. First, there is
concern that the CNS does not measure an emotional connectedness to nature as the
authors purport, and instead merely taps into cognitive beliefs (Perrin & Benassi, 2009).
Also, Perrin and Benassi argued that it is only the scale’s self-referential nature and
positive tone that account for the differences with the NEP. Furthermore, the measure
lacks a physical component of connectedness to nature, which is deemed to be crucial in
the construct of connectedness to the natural world (Nisbet et al., 2009). Because of these
concerns and the limited definition of “connectedness to nature” proposed by the authors,
this measure will not be used as the primary operational definition of CTN in this study.
Nature Relatedness Scale
This study will use a more recent scale to measure the concept of connectedness
to nature—the Nature Relatedness (NR) scale (Nisbet et al., 2009). The NR was designed
to assess the affective, cognitive, and physical relationships between humans and the
natural world. The measure also taps into a sense of appreciation and understanding of
the interconnectedness of life on this planet. In addition to functioning as a single,
cohesive measure of connectedness, the NR loads onto 3 distinct factors: NR Self, NR
Experience, and NR Perspective. See Chapter III for statistics regarding the reliability of
this scale, and Table 1 (shown later in Chapter III) for definitions of each subscale and
sample items that load onto each individual scale.
Summary and Conclusions
After a review of the measures developed to examine individuals’ relationships

16
with the natural world, the NR (Nisbet et al., 2009) best defines the concept of CTN for
purposes of this study. Its multi-scale format allows direct examination of three
empirically validated components of connectedness to nature (Schultz, 2002): a personal,
self-concept-related aspect, a view of our species’ place in the broader ecosystem, and the
value of physical experiences in the natural world. This is especially useful when wishing
to compare the NR to other measures of health and wellness, as desired in the current
study. The NR is sensitive to change after experiences in nature, and the measure was
found to be associated with pro-environmental behaviors.
Since the NR has been found to be associated with a few measures of well-being,
it is possible that it may be associated with related constructs as well. The following
section will examine QOL based on previous literature, provide theoretical background
supporting this concept, and describe various measures used to quantify the construct of
QOL with the ultimate goal of choosing a measure which best fits the construct of QOL
and is most practical for use in the current study.
Quality of Life
Overview of the Construct
“Quality of Life” is a construct created to measure a level of overall well-being in
individuals or populations (World Health Organization [WHO], 1997). This broad, far-
reaching concept encompasses numerous domains such as one’s environment,
community, social and family relations, physical health, MH, and leisure activities. Its
exact definition varied from one author to the next. One Danish team (Ventegodt et al.,

17
2005) described QOL with regards to the relationship between one’s current life
experiences, personal history, and early life biological factors. In this context, QOL
contains numerous subjective factors (e.g. meaning in life, life satisfaction, and
happiness) and objective factors (e.g. income, status, and work). Health and ability play a
large role in determining one’s QOL as well. The authors conclude that for many QOL is
determined not solely by life events but also by the way that one views and processes
those events. This implies a large subjective component to QOL and suggests that QOL is
also related to one’s ability to be a part of the present reality.
Other authors view QOL as a complement to measures of functional status and
health (WHOQOL Group, 1998). According to the WHO, an ideal measure of QOL
should include physical, psychological, social, and spiritual domains. These authors
assert that QOL is a multidimensional construct which loses a great deal of richness and
validity when examined from a mono-dimensional perspective.
Others assert that QOL should be viewed by examining measurable, objective
characteristics such as functional status, health, and well-being (Garratt, Ruta, Abdalla,
Buckingham, & Russell, 1993). This has led to the creation of many health-related
measures of QOL. These measures examine QOL through one’s ability to interact with
the world and function in basic tasks of living on a day to day basis. These measures also
are frequently used to determine how illnesses affect one’s ability to function.
Since an investigation into the construct of QOL is relevant and necessary, one
way to further explicate definitions of QOL is to examine the measures themselves. For
this study, numerous measures of QOL were evaluated with the goal of choosing a

18
measure that adequately captures the multi-faceted nature of well-being in an appropriate,
culturally sensitive manner for a representative sample of healthy, college-aged adults.
The Short Form- 36
First, the category of health-related QOL measures was evaluated to see if one of
those measures adequately expressed the above-stated criterion. The Short Form-36 (SF-
36) was examined due to its ubiquity (Turner-Bowker, Bartley, & Ware, 2002),
popularity, and balance between brevity and comprehensiveness (Ware & Sherbourne,
1992). The SF-36 consists of 36 questions that break down into eight subscales: physical
functioning, role limitations due to physical problems, bodily pain, MH, and role
limitations due to emotional problems, social functioning, vitality, and general health
perceptions.
This measure was not chosen for inclusion in the current study because it
provided too limiting and strict of a definition of QOL by focusing mainly on one’s
capacity to accomplish tasks and function autonomously. While aspects of social
functioning and overall well-being are included, their weight with regards to the entire
measure is light. While the SF-36 would be quite appropriate in a medical setting, for a
healthy, college-age sample there remains the possibility of a limited range of scores and
a larger than necessary emphasis on physical health to the neglect of other valuable
aspects of well-being.
The Quality of Life Questionnaire
The Quality of Life Questionnaire (Evans & Cope, 1989) was subsequently

19
examined as a possible measure due to its more broad and inclusive definition of QOL
beyond a health related context. In this measure, 192 true/false self-report items were
designed to gauge an individual’s behavior in the context of their environment. It
includes five major domains: general well-being, interpersonal relations, organizational
activity, occupational activity, and leisure and recreational activity.
This measure succeeds in creating a broad, multifaceted definition of QOL. It
extends beyond merely health related aspects of QOL to include other domains such as
work, leisure, and civic responsibilities. However, this operational definition of QOL is
not ideal for use in the current study. It appears to be targeted strictly towards working
adults of North American culture. It asserts that certain domains like occupation, voting,
and charity work are relevant factors for one’s QOL. While this may be the case for
some, for the college students and young adults (many of whom do not work and are not
civically active) who are the subject of the current study, this measure may give an
inaccurate impression of QOL by placing value on certain domains which are not as
relevant to this cohort. In addition, its definition of QOL appears limited to mainstream
North American culture, limiting its generalizability.
The WHOQOL-BREF
The WHO’s Quality of Life-Brief measure (WHOQOL-BREF) is a promising
measure of QOL for the current study (WHO, 2011). This 26-item measure was designed
to allow the participant to determine the importance of certain activities and values in the
determination of their own QOL, and so the measure claims to be free of cultural bias and
thus applicable worldwide (WHO, 1993). The WHO defined QOL as “individuals'

20
perceptions of their position in life in the context of the culture and value systems in
which they live and in relation to their goals, expectations, standards and concerns”
(WHO, 1997). Consequently, this measure includes physical, mental, social,
environmental, and personal belief components of well-being. By focusing on
individuals’ perceptions of their own well-being, the measure strives to assess overall
functioning in the context of health and QOL (WHO, 1993). For these reasons, the
WHOQOL-BREF was chosen as the best measure of QOL for the purposes of this study.
Quality of Life and Connectedness to Nature
The following section will examine several specific aspects of QOL and how they
may be related to the construct of CTN. The following review will cover the
environmental, social, and physical aspects of QOL. The well-established relationship
between MH, an important aspect of QOL included in most measures, and CTN will be
reviewed in a forthcoming section.
Environment and Connectedness to Nature
Many experts consider the physical and built environment to compose a
significant aspect of QOL (Evans & Cope, 1989; Turner-Bowker et al., 2002; WHO,
1997). The physical characteristics of where one lives and specific aspects of their
community such as safety and ease of transportation are aspects of QOL frequently cited
in measures (WHO, 1997). These elements of one’s built and natural environment could
be related to and influence one’s sentiments of CTN.
Most of the literature which relates sentiments of CTN to the physical

21
environment examines the differences between rural and urban populations. Rural
inhabitants report stronger sentiments of connectedness to the natural world than urban
residents (Klassen, 2010; Muller, Kals, & Pansa, 2009). However, these studies measured
connectedness to nature as a single item self-report question, making the measure
susceptible to problems of internal validity as well as differences in interpretation
between participants. Also, those studies were also limited by the lack of socioeconomic
diversity in their participants. Another study of rural inhabitants also demonstrated that
they reported stronger sentiments of connection with the natural world than urban
residents and also reported higher scores on indices of well-being than those from urban
areas (Hinds & Sparks, 2009). However, that study similarly suffered from a small
sample size and a geographically and ethnically narrow population, reducing its external
validity.
This study attempted to expand the connection between an environmental aspect
of QOL and CTN by examining how other factors of the built environment besides
merely rural living, such as safety or ease of transportation, may be related to CTN.
Social Relationships and Connectedness
to Nature
Research connecting social relationships, an important element of QOL, and CTN
is currently quite scant. One study (Marcus, Omoto, & Winter, 2011) cited the
importance of a sentiment of community and strong interpersonal relationships in the
development of the values of environmentalism and participation in environmental
issues. The current study intends to collect exploratory data to further examine the

22
connection between social relationships and sentiments regarding CTN.
Physical Health and Connectedness
to Nature
Numerous studies have linked exposure to nature with increased physical health,
an important aspect of QOL. One study examined a representative sample of US adults
and found higher rates of physical health and well-being in those who have more direct
contact with the natural world (Kaplan & Kaplan, 1989). Other lines of inquiry have also
linked exposure to nature with positive benefits for physical health in samples of both
healthy US adults and those with physical and mental illness (Chalquist, 2009; Frumkin,
2001). Interestingly, sometimes simply having a view of nature has an effect on health.
One study found that prison inmates with views of the outdoors area beyond the prison
are sick less than those with views of an interior courtyard (Moore, 1981), while another
found that patients with views of nature from hospitals rooms recover faster than those
with views of a wall (Ulrich, 1984). These studies are notable in their significant efforts
to decrease confounding variables and examine only the difference in view. While this
health effect could be attributed to qualities of the view besides the mere presence or
absence of natural stimuli, these results still deserve attention.
Contact with animals, such as pets, has also been shown to decrease the amount of
health problems that their owners may experience. In one prospective study, a community
sample of adults was found to experience fewer illness and minor injuries than a
comparison group of nonpet owners over a 10-month period (Serpell, 1991). Pet
ownership has also been found to be associated with higher levels of physical health

23
(Mullersdorf, Granstrom, Sahlqvist, & Tillgren, 2010). Unfortunately, it was not
determined whether the health-affirming aspects of pet ownership effects were due
simply to the presence of a pet in the home or factors associated with pet ownership such
as time spent outside or an increase in physical activity or exercise. Thus, one can only
speculate as to the mechanism at work in decreasing health problems among pet owners.
In addition, hospital administrators have long understood that the presence of plants and
gardens increases rates of healing among their patients, and participation in wilderness
programs often results in improvements in physical health (Frumkin, 2001). Again, the
literature fails to explain how these situations increase healing. It may not be the presence
of nature or natural features themselves, but rather elements associated with nature
instead. Improvements in health could be accounted for by the increased sensory
stimulation and activity levels that gardens provide, and the health-promoting aspect of
wilderness programs could be due solely to increased exercise or a decrease in
environmental contaminants. Still, these findings merit further investigation.
It should likewise be noted that the exact mechanisms of how time spent in nature
may mediate physical health and wellness are unknown. Exposure to nature is often
associated with physical exercise, and it is possible that the effects of increased physical
activity which happen to take place outdoors account for health improvements.
Alternatively, the effect could even be biological: exposure to a type of bacteria, M.
vaccae, which is only found outdoors in soil, was shown to produce increases in immune
system production and boost levels of serotonin (Lowry et al., 2007). More research is
needed to determine the mechanism of action which connects exposure to nature and

24
physical health.
While physical health is merely one component of QOL, an in-depth examination
of the relationship between physical health and exposure to nature reveals the diversity of
ways in which exposure to the natural world could be related to one’s QOL. In addition,
these studies highlight avenues rich for future research which could serve to better
explain the mediating factors between exposure to the natural world and personal health.
Mental Health and Connectedness to Nature
Overview
The following section will outline the connections between nature and one’s MH.
It will begin with an examination of the research connecting experiences in the natural
world with changes in MH. After this connection has been established, a review of the
small but significant literature supporting the relationship between connectedness to
nature and MH will be conducted.
Exposure to Nature and Mental Health
An established base of research catalogs the positive effects of exposure to nature
for one’s MH. Nature may have a rejuvenating effect: spending time in nature could
serve to increase tolerance of stressful situations, improves concentration, and increase
productivity (Nisbet & Zelenski, 2011; Nisbet, Zelenski, & Murphy, 2010). Another
study examining university students in the United States using cross-sectional survey data
reported that those who self-report more contact with the natural world as measured by
time spent in a natural environment report higher levels of effective functioning and

25
personal development, peacefulness as measured by the Positive and Negative Affect
Scale, and lower levels of stress as measured by the Perceived Stress Scale (Herzog &
Strevey, 2008).
A number of studies have also examined the MH and well-being of inhabitants of
rural communities. These populations, which may typically have a higher degree of
contact with nature in their daily lives than those from urban areas, may be considered a
proxy for those with more exposure to nature. After controlling for a number of factors
such as SES, employment, and household income, one investigation demonstrated that
rural inhabitants reported lower rates of symptoms of depression and anxiety on the
General Health Questionnaire than participants living in urban areas (Weich, Twigg, &
Lewis, 2006). Yet, this difference, while statistically significant, demonstrated little
practical significance (1/2 point on the General Health Questionnaire).
To date, the exact mechanisms behind the connection between rural life, CTN,
and well-being remains unclear. While some hypothesize that rural inhabitants possess a
stronger sense of place (i.e. they feel more connected and comfortable with the land on
which they live) than urban inhabitants that contributes to increased well-being (Weich et
al., 2006), other authors purport that rural living increases one’s exposure to the natural
world, and nature’s subsequent restorative effects cause the increases in well-being
(Hinds & Sparks, 2009). Or, it could be that factors inherent to rural life such as less
crime, pollution, and crowding could attribute to improvements in well-being.
Unfortunately, no peer-reviewed study has pursued this possibility. Regardless, since
some models actively attempting to explain mediating factors only account for half of the

26
variance in the rural inhabitance-well-being connection (Hinds & Sparks, 2009), there is
still clearly a great deal more research necessary before anything more than tentative
conclusions can be reached regarding the connection between rural life, connectedness to
nature, and well-being.
The connection between exposure to nature and MH is also supported by the
literature as evidenced by two thorough literature reviews (Chalquist, 2009; Frumkin,
2001). People connected with nature through the ownership of pets such as dogs have
shown significant benefits for MH including stress reduction (Siegel, 1990) and decreases
in depression (Siegel, Angulo, Detels, Wesch, & Mullen, 1999). Unfortunately, one can
only speculate as to the mechanism of action in these studies. It may be due to the fact
that dogs, as members of the animal kingdom, increase one’s feelings of connectedness to
nature in general, which then leads to improvements in MH. Or, as mentioned above, it
could simply be that pet ownership necessitates healthy changes in lifestyle such as more
time spent outdoors doing physical activity. Or, the added companionship of pets may be
providing a boost to mood.
In addition, those who connect with the natural world through gardening and the
care of plants benefit from numerous positive MH outcomes according to research in the
field of horticultural therapy (Jarrott & Gigliotti, 2010; Rice, Remy, Whittlesey, Simson,
& Straus, 1998). Again, it is not entirely understood why this is the case. It could have
something to do with the physical act of gardening or perhaps some of its associated
features such as caring for other living creatures, interacting with nature, and being
outdoors.

27
Furthermore, ecotherapists in independent practice have reported the mental and
physical benefits of contact with nature for their clients (Burns, 2008). For example, one
intervention for couples in conflict involved creating shared experiences in natural
settings in order to strengthen their relationship. In another situation, reconnecting with
special natural areas that were important to one as a child helped to solidify values and
improve sentiments of well-being. While this evidence from psychotherapists is
anecdotal and requires systematic study to ascertain more definite conclusions, it does
indicate an area ripe for future research.
There have even been significant findings detailing nature’s restorative effect on
emotions. A “natural” stimulus, ocean waves, was specifically selected by the authors of
one study to elicit contentment. It was found that the ocean wave sound significantly
reduced the cardiovascular stress and sympathetic nervous system arousal elicited by a
fearful stimulus (Fredrickson & Levenson, 1998; Fredrickson, Mancuso, Branigan, &
Tugade, 2000). However, it may not be ocean waves’ nature-related quality that induces
the effects of contentment. It could be the repetitive, monotonous nature of the sound that
classifies it as contentment-inducing. This study only demonstrates that the stimulus
chosen by the authors to be prototypically contentment-inducing happens to be nature
related, and that the calming effect was supported by the results. Multiple additional
studies have also demonstrated the stress-reducing (Laumann, Garling, & Stormark,
2001; Rader, 2009), restorative effects (Herzog, Black, Fountaine, & Knotts, 1997;
Herzog, Maguire, & Nebel, 2003), well-being enhancement (Kaplan, 2001), and mood-
improving aspects (Rader, 2009) of exposure to nature and nature-related stimuli. Again,

28
with all of these studies, it is not possible to determine what specific aspects of these
natural stimuli account for increases in well-being. However, the preponderance of
results connecting natural stimuli with improvements in health and well-being points to
the necessity of further investigation of how this occurs. This study attempted to build on
these findings to examine whether this relationship is mediated by sentiments of
connectedness to the natural world.
Greenway (1995) demonstrated that participants in a nature-based course were
successful at breaking old unhealthy habits such as the consumption of alcohol and
tobacco. However, a lack of control variables limits the extent of determining nature’s
role in the reduction of substance use. Likewise, adolescent participants in wilderness
therapy programs, which emphasize the therapeutic aspects of a wilderness setting
(Russell, 2003, 2005), have also shown a great deal of positive outcomes such as a
stronger desire to reduce maladaptive behavior, less substance abuse, and a better
awareness of one’s feelings (Russell & Phillips-Miller, 2002). Again, it is difficult to
determine the exact role that the natural setting and connectedness to nature play in the
process of reaching these positive outcomes.
In addition, a number of thinkers in the field of ecopsychology emphasize the
importance of a connection with the earth and its implications for MH (Bragg, 1996;
Conn, 1998; Feral, 1998). According to this perspective, a significant amount of mental
illness stems from a lack of connection with the natural world in today’s modern society.
By ignoring and failing to acknowledge our connection to the natural world we are
denying a fundamental part of our identity as human beings (Howard, 1997; Roszak et

29
al., 1995). It is argued that psychological issues such as depression and anxiety can be
related back to this sense of disconnect with our natural world and additional concern
over the health and well-being of our planet (Buzzell & Chalquist, 2009). Unfortunately,
these claims lie solely on theoretical grounds without empirical support. The current
explored these theoretical claims.
One commonality does exist among of all of the above findings: there can be only
speculation as to the mechanism of action connecting exposure to nature with increases in
well-being. These studies are valuable because they provide potential reasons why nature
is important for one’s personal well-being. However, none of them provide more than
corollary evidence connecting direct exposure to natural environments or nature-related
stimuli to gains in personal health and well-being. Thus, these findings should be viewed
as an indication to further investigate the connection between nature and health and not as
support for the health-affirming aspects of exposure to nature. Connectedness to nature
could be one of the mediators in the relationship between exposure to nature and health.
The following section will examine this possibility.
Connectedness to Nature and Mental Health
Recent research in experimental psychology has served to quantify fundamental
Ecopsychological principles by associating measures of connectedness to nature with
specific outcomes and implications for health and well-being (Mayer & Frantz, 2004;
Mayer, Frantz, Bruehlman-Senecal, & Dolliver, 2009; Nisbet et al., 2010). Research
applying the Connectedness to Nature Scale demonstrates a correlation between higher
ratings of connection to the natural world and greater life satisfaction (Mayer & Frantz,

30
2004). However, life satisfaction was only a single item likert-scale question. Thus, the
information that can be gleaned from this metric is certainly limited and requires a more
detailed examination. In another study sampling U.S. university students, time spent in
nature was also found to support reflection of life problems and was associated with
higher state levels of connectedness to the natural world (Mayer et al., 2009). After
taking a walk in a natural area, students reported that they were more effective in
resolving a minor life problem through contemplation than those who performed the
same procedure in a non-natural area (i.e., a parking lot). It appears that there is
something inherently restorative about time spent in nature. And, this restorative process
may be mediated through a greater feeling of connectedness to the natural world in that
moment.
Research with the Nature Relatedness (NR) scale has explored the relationship
between connectedness with the natural world and well-being (Nisbet et al., 2009).
Recent studies have revealed that NR correlates positively with many indicators of well-
being including positive affect, autonomy, personal growth, purpose in life, and vitality
(Nisbet et al., 2010). A more recent investigation using this scale has shown that an
increased positive affect can result from taking a walk in a natural area compared to
taking the same walk indoors. Furthermore, both positive affect and time in a natural area
contribute to higher levels of Nature Relatedness (Nisbet & Zelenski, 2011). It seems
from this finding that NR mediates the relationship between time spent in nature and
positive affect. However, further research is required to support the results of this single
study.

31
Summary and Conclusions
As evident above, research supports the relationship between experiences in the
natural world and positive MH outcomes. Additionally, a small but growing body of
work has found relationships between the novel concept of CTN and indicators of MH.
Further research should attempt to build on these initial findings regarding CTN in order
to better understand the importance of the human-nature connection.
Mental Health
Overview
Mental illness represents a significant problem in this country with 26.2% of all
adults receiving a DSM-IV diagnosis and $57.5 billion spent on MHcare during a one
year period (Kessler et al., 2005). Many factors have been found to influence one’s MH
status. Differences in age and sex are found in many mental illnesses such as major
depressive disorder (American Psychiatric Association [APA], 2000; Waraich, Goldner,
Somers, & Hsu, 2004) and panic disorder (Eaton, Kessler, Wittchen, & Magee, 1994;
Goodwin et al., 2005). Socioeconomic status (SES) may also influence MH in areas such
as eating disorders (Palma-Coca et al., 2011) and depression (Kosidou et al., 2011).
Ethnic differences have also been found in the prevalence of many mental disorders such
as substance use disorders (Bray, Adams, Getz, & Baer, 2001; Huang et al., 2006). Since
spirituality has also shown to be an important factor in the treatment of substance use
disorders (Franklin, Markarian, Frances, Miller, & Mack, 2005; Lyons, Deane, Caputi, &
Kelly, 2011), information regarding strength of spiritual beliefs is deemed important. In

32
addition, exercise has been found to play a role in the prevalence (Strohle, 2009) and
treatment of various mental disorders such as depression (Mota-Pereira et al., 2011) and
anxiety (Carek, Laibstain, & Care, 2011). Interestingly, many studies have found pet
ownership to be associated with lower levels of MH as well (Mullersdorf et al., 2010;
Parslow, Jorm, Christensen, Rodgers, & Jacomb, 2005).
Quality of Life and Mental Health
Research has firmly established the relationship between QOL and MH. A
thorough review of this body of literature is beyond the scope of the current study.
However, a brief mention of a few studies incorporating similar measures to the current
study merits attention. One study found moderate to strong positive correlations between
QOL as measured by the WHOQOL and MH as measured by the SCL-90 in a group of
Dutch psychiatric outpatients (Trompenaars, Masthoff, Heck, Hodiamont, & Vries,
2005). Another study found similar findings in a group of alcoholic males (Barros da
Silva Lima, Fleck, Pechansky, de Boni, & Sukop, 2005). Additionally, a third study also
found a strong positive relationship between MH and QOL in adults with mood disorders
(Trompenaars, Masthoff, Van Heck, Hodiamont, & De Vries, 2006). These findings are
understandable due to the fact that most measures of QOL, such as the WHOQOL,
include an assessment of MH as a fundamental aspect of QOL. Thus, this relationship
between QOL and MH will not be a focus of the current study due to the extensive body
of previous work in this area and the already well-established relationships.

33
Concluding Remarks
Previous psychological research has certainly demonstrated the feasibility of
developing a measure which accurately quantifies the sentiment of connectedness to
nature discussed through the biophilia hypothesis (Wilson, 1984) and writings of
ecopsychologists (Buzzell & Chalquist, 2009; Roszak et al., 1995). Numerous other
studies have also demonstrated the strong link between exposure to nature and measures
of physical and MH. In addition, researchers are now just beginning to move in the
direction of directly applying measures of connectedness to nature to the categories of
health and wellness. However, while recent research has touched upon some of the
potential benefits of possessing strong sentiments of connectedness to nature such as
increased positive affect and greater life satisfaction, no studies have examined the
explicit connection between sentiments of connectedness to nature and specific indicators
of health and QOL. Therefore, the following specific aims and research questions were
proposed.
Specific Aims and Research Questions
This study addressed four specific aims: (1) to explore the relationship between
CTN and demographic variables (age, class standing, major, GPA, sex, ethnicity, SES,
location of childhood home, strength of spiritual beliefs, pet ownership, amount of
exercise); (2) to explore the relationship between CTN and QOL, (3) to explore the
relationship between CTN and MH; and (4) to explore what other factors relate to CTN,
and to what extent.

34
This study addressed the following research questions related to Aim 1.
1. How were the responses for demographic variables and CTN (1 overall scale
and 3 subscales) distributed across the sample?
2. What were the relationships between CTN and the demographic variables
suggested by previous research?
This study addressed the following research questions related to Aim 2.
1. How were the responses for QOL (1 general rating and 4 subscales) distributed
across the sample?
2. What were the relationships between CTN and QOL scales?
This study addressed the following research questions related to Aim 3:
1. How were the responses for MH (1 overall scale and 9 subscales) distributed
across the sample?
2. What were the relationships between CTN and MH scales?
This study addressed the following research question related to Aim 4:
1. Which of the above variables (demographics, global QOL, and global MH)
most strongly predicted CTN, and to what extent?
The research questions may contribute meaningfully to the research base because
they help to clarify connections between holding sentiments of connectedness to the
natural world and indicators of personal well-being. If these hypotheses are supported, an
argument could be made to investigate possible causal relationships between variables.
This could lead to interventions designed to increase CTN, which in turn may contribute
to increases in MH and QOL, resulting in healthier and better functioning people.

35
CHAPTER III
METHODS
Setting and Sample
Data collection took place in Logan, UT, a small college town of approximately
48,000 people in the Cache Valley region of Northern Utah. Participants were recruited
via class presentations and an online recruitment system, Sona Systems (www.sona-
systems.com), from a pool of psychology students at Utah State University during the
spring semester of 2012. In the Sona System the students had the opportunity to
participate in this study by selecting it from a list of approved experiments conducted by
the university as one possible way to obtain course credit. Their decision to choose
participation in this experiment was based on only its title (“Connectedness to Nature and
Wellness”) and the time commitment required (approximately 30 minutes). In order to
promote a wider diversity of students, participants were also recruited from sections of
Introductory English. During their class time, students participated in the survey and
listened to the researcher give a lecture of the research process as part of a course
objective of learning about research methodology.
An undergraduate college sample was chosen for many reasons. First, the Nature
Relatedness scale was partially validated on this population (Nisbet et al., 2009) so it is
hoped that the normality of distribution, subscale validity, and correlations will all also
apply to this college population as well. Although utilizing this population may limit
external validity and generalizability, previous research has shown enough variance in

36
this population’s levels of CTN (Nisbet & Zelenski, 2011; Nisbet et al., 2009), MH
(Eisenberg, Hunt, Speer, & Zivin, 2011), and QOL (Liu et al., 2009; Wang, Kao, Huan,
& Wu, 2011) to be useful for this study.
Measures
Demographics
Because of the differences in age and sex in many mental illnesses such as major
depressive disorder (APA, 2000; Waraich et al., 2004) and panic disorder (Eaton et al.,
1994; Goodwin et al., 2005), it was important to examine these demographics in this
study. SES may also influence MH (APA, 2000), and thus required inclusion in the
current study. Ethnic differences have been found in the prevalence of many mental
disorders, such as substance use disorders (Bray et al., 2001; Huang et al., 2006), so this
information was collected because of its importance for MH.
In addition to these basic demographics of age, sex, ethnicity, and SES, several
other demographic characteristics were assessed (see Appendix A). These included the
strength of spiritual beliefs and the location of one’s childhood home (urban vs. suburban
vs. rural). Because aspects of spirituality are consistent with sentiments of connectedness
to the natural world (Buzzell & Chalquist, 2009; Roszak et al., 1995) as well as substance
use (Franklin et al., 2005), information regarding strength of spiritual beliefs was deemed
important. And, stemming from differences in sentiments of CTN related to geographic
factors such as a rural location (Hinds & Sparks, 2009; Muller et al., 2009), information
regarding one’s geographic location appeared valuable as well. Because exercise, both

37
outdoors and in general, may influence MH (Chalquist, 2009; Frumkin, 2001), frequency
data regarding those activities was collected. Finally, since it has been suggested that dog
ownership and pet ownership in general may influence health and well-being (Serpell,
1991), questions assessing involvement in those two areas were collected as well. The
collection of these demographics helped to provide more information regarding the
characteristics of those with high and low levels of CTN and may even serve to inform
ways to predict sentiments of connectedness to the natural world in the future.
The Nature Relatedness Scale (NR)
As previously discussed, the NR measure taps into three components of the
human-nature connection: emotions, cognitions, and a physical relationship to the natural
world (see Appendix B). In general, it encompasses an appreciation and understanding of
the interconnectedness of life (Nisbet et al., 2009). The NR loads onto three distinct
factors: NR self (Chronbach’s α = 0.84), NR perspective (Chronbach’s α = 0.66), and NR
experience (Chronbach’s α = 0.80). See Table 1 for definitions and examples of items on
these scales.
The NR shows solid internal consistency (Chronbach’s α = 0.87), and is
temporally stable (test-retest r = 0.85). Its internal validity is supported by correlations
between Overall NR and environmentally responsible behavior (belonging to an
environmental organization and buying organic, fair trade products; r = 0.53) as well as
professing a love of animals (r = 0.34; Nisbet et al., 2009).
Although this measure lacks some external validity due to its testing with a
population of college students and one adult community sample (Nisbet et al., 2009,

38
Table 1
Examples of Items from Each Subscale of the NR Scale
Variable
Definition
Example 1
Example 2
NR-self
One’s view of nature as a part
of their self
I feel very connected to all
living things on earth.
My connection to nature and
the environment is an
important part of my
spirituality.
NR-perspective
An external, nature-
related worldview
Humans have the right
to use natural resources
any way that we want.
I think a lot about the
suffering of animals.
NR-experience
The desire to be out in nature
experiencing it directly
My ideal vacation spot would
be a remote, wilderness area.
The thought of being deep in
the woods, away from
civilization, is frightening.
2010; Nisbet & Zelenski, 2011), its high overall reliability combined with its ability to
tap into the three distinct domains of the cognitive, physical and emotional aspects of
connectedness to nature make it an appropriate measure for the purposes of this study.
World Health Organization Quality of
Life measure (WHOQOL-BREF)
The WHO Quality of Life (WHOQOL) measure (see Appendix C) was created to
develop a measure of QOL that is applicable across cultures (WHO, 2011). This allowed
participants from different cultures to dictate the most salient aspects of QOL for them
(WHO, 1993). The WHO defined QOL as “individuals' perceptions of their position in
life in the context of the culture and value systems in which they live and in relation to
their goals, expectations, standards and concerns” (WHO, 1997). This broad ranging
concept supports the WHO’s conception of health as a state that is beyond the presence
or absence of disease. Their concept also includes physical, mental, social,
environmental, and personal belief components of well-being. By focusing on

39
individuals’ perceptions of their own well-being, the measure strives to assess overall
functioning in the context of health and QOL (WHO, 1993).
The WHOQOL-BREF, an abbreviated 26 item measure, was simultaneously
designed with the WHOQOL to be more convenient for use in research studies involving
other measures (WHO, 2011). While much shorter than the 100 item original measure,
the WHOQOL-BREF still manages to remain comprehensive, comprising at least one
question from each of the 24 facets relating to QOL as well as 2 items which assess
overall QOL and health. Additionally, the measure was found to be highly correlated
with the longer WHOQOL (0.89 < r < 0.95; WHO, 1993), and possess comparable
discriminate validity.
The WHOQOL-BREF consists of four domains: physical, psychological, social
relationships, and environment. All questions are scored on a 5-point Likert scale, with
the labels varying depending on the wording of the question. Examples of questions from
each domain are found in Table 2.
Table 2
Examples of Items from Each Subscale of the WHOQOL-BREF
Variable
Definition
Example 1
Example 2
Physical
Examining physical
health and wellbeing
To what extent do you
feel that physical pain
prevents you from
doing what you need
to do?
Do you have enough
energy for everyday
life?
Psychological
Examining mental health
and psychological
wellbeing
How well are you able to
concentrate?
Social relationships
Examining personal
relationships with
other people
How satisfied are
you with your
personal
relationships?
Environment
Characteristics of the
community in which
you live
How satisfied are you
with your access to
health services?
How often do you have
negative feelings such as
blue mood, despair,
anxiety, and depression?
How satisfied are
you with the
support you get
from your friends?
How safe do you feel in
your daily life?

40
Multiple regression analysis shows that each of the four domains contributes
significantly to Overall QOL. In addition, the WHOQOL-BREF measure shows good
internal consistency: values for each subscale ranged from α = 0.71 to α = 0.86 (WHO,
1993). It shows good to excellent psychometric properties of reliability: correlations
range from r = 0.68 to r =0.95 depending on the question. Discriminant validity was
determined by comparing well and ill populations using t tests, and differences across all
domains were found to be significant (p < .001; WHO, 1998). It was also shown to be
discriminately valid from another measure of QOL, the SF-36 (Turner-Bowker et al.,
2002) and its shorter version, the SF-12 (von Steinbachel, Lischetzke, Gurny, & Eid,
2006), with t tests demonstrating p < .001 between the WHOQOL-BREF and SF-36/SF-
12. Those measures tend to relate more information regarding health status and health
services utilization, while the WHOQOL-BREF relates more strongly with overall QOL
outside of a healthcare construct (Huang, Wu, & Frangakis, 2006). This further supports
the WHOQOL-BREF’s appropriateness for use in this proposed study.
Symptom Checklist-90-Revised
(SCL-90-R)
The Symptom Checklist-90-Revised (SCL-90-R) is a paper-and pencil
psychological assessment tool used to evaluate a broad range of psychological problems
and symptoms of psychopathology (Derogatis, 2011). It is used by both MH
professionals and researchers, making it an appropriate measure for the purposes of this
study.
This self-report measure examines the participant’s subjective experience. The

41
measure consists of 90 self-report items measuring psychological symptom patterns
which have occurred during a current, point-in-time period of the past 7 days (Derogatis,
1994). The test’s use of a 5-point Likert scale of the subject’s experience of distress (0 =
not at all, 2 = moderately, 4 = extremely), along with a sixth-grade reading level, make
this test easily accessible for a wide range of participants.
The test comprises nine primary symptom dimensions or subscales (somatization,
obsessive-compulsive, interpersonal sensitivity, depression, anxiety, hostility, phobic
anxiety, paranoid ideation, and psychoticism) and three global indices of distress (global
severity index, positive symptom distress index, and positive symptom total), which serve
to provide a better overall assessment of the participant’s MH. The Global Severity Index
is considered the most sensitive numeric indicator of respondent’s psychological status
(Derogatis, 1994). Thus, only that global index will be assessed in the current study.
The test has demonstrated strong internal consistency (0.79 < α < 0.90; Horowitz,
Rosenberg, Baer, Ureno, & Villasenor, 1988) in addition to strong convergent and
discriminate validity (Derogatis, 1994). More than 1,000 studies have been conducted
which demonstrate the reliability, validity, and utility of this instrument (Derogatis,
2011). And, while it is difficult to determine test-retest reliability due to the varying
nature of psychological symptoms, especially throughout the course of treatment, the
measure has been shown to be relatively stable in non-treatment conditions (Derogatis,
1994).
The measure has also been shown to be sensitive to psychological distress,
detecting differences across the complete spectrum from mild to severe distress.

42
However, like most measures consisting of subjective ratings with Likert scales, the
scoring is totally subjective (one participant’s “3” rating may mean something different
than another participant’s “3” rating). Therefore, it is important to compare scores to a
norm group in order to gain the best understanding of the results (Derogatis, 1994). While
anonymity may serve to reduce the effect of social desirability in these self-report
measures, it is acknowledged that social desirability may still be an issue and a limitation
of any self-report measure.
Procedure
Approval to conduct this research was obtained by the Utah State University
Institutional Review Board. Prior to the start of the study, participants were presented
with a letter of information ensuring informed consent that detailed the purpose,
procedure, risks, and benefits of participation in the study (Appendix A). Participants
completed a series of paper-based self-report measures: demographic information
(Appendix B), the NR (Appendix C), the WHOQOL-BREF (Appendix D), and the SCL-
90-R. All measures were completed in a group setting in a classroom or research office at
Utah State University.

43
CHAPTER IV
RESULTS
The first section of the results will attempt to answer the research questions
related to Aim 1: (a) how the responses for demographic variables and CTN (one overall
scale and three subscales) are distributed across the sample and (b) a description of the
relationships between CTN and the demographic variables. This will be accomplished
through the use of descriptive statistics, correlations, t tests, and ANOVA.
The second section of the results will attempt to answer the research questions
related to Aim 2: (a) how the responses for QOL (one general rating and four subscales)
are distributed across the sample and (b) a description of the relationships between CTN
and QOL scales. This will be accomplished through the use of descriptive statistics and
correlations.
The third section of the results will attempt to answer the research questions
related to Aim 3: (a) how the responses for MH (one overall scale and nine subscales) are
distributed across the sample and (b) a description of the relationships between CTN and
MH scales. This was accomplished through the use of descriptive statistics and
correlations.
The fourth section of the results will attempt to answer the research question
related to Aim 4: which of the above variables (demographics, global MH, and global
QOL) predict CTN, and to what extent. This will be accomplished through multiple
regression analysis.

44
Descriptive Statistics
Two hundred sixty-seven students were included for participation in the current
study. Females accounted for 49.81% of the cohort. Ages ranged from 18-49, with a
mean age of 21.41 years (SD = 4.89). 88.01% of the sample identified as being in their
first two years of college. Regarding ethnicity, 80.83% of the population identified as
White. See Table 3 for a complete description of the sample characteristics.
Aim 1: Connectedness to Nature and Demographics
Demographic variables and CTN variables were first cleaned and sorted in
preparation for analysis. Appropriate items were reverse scored (items 2, 3, 10, 11, 13,
14, 15, 18), and scale scores were computed. All appropriate items were examined for
linearity and normality using box plots, histograms, and an examination of skewness and
kurtosis. The variables met the assumptions of linearity and normality necessary for later
regression analysis. See Appendix E for histograms describing the mean, standard
deviation, and distribution of scores for all NR scales.
Table 4 displays descriptive statistics of the sample for the nature relatedness
subscales and overall score for current study sample and the normative sample from
which the measure was designed (Nisbet et al., 2009). The t tests revealed statistically
significant differences between the two samples (p < .05) for all scales: NR self (t =
4.11), NR perspective (t = 2.08), NR experience (t = 4.35), and overall NR (t = 3.09).
However, a calculation of effect size between the two samples reveals small standard
mean differences between the two samples ranging from 0.20 to 0.40. The current

45
Table 3
Demographic Characteristics of the Sample (N = 267)
Characteristic
Sex
Female
Male
Age (range: 18-49)
Ethnicity
White
Asian/Asian American
Black/African American
Hispanic
Multiethnic
Other
Location of childhood home
Urban
Suburban
Rural
Household income
$15k or less
$15k-$25k
$25k-$45k
$45k-$65k
$65k-$100k
$100k+
Importance of spirituality
(1= low, 5 = very high)
1
2
3
4
5
How often do you exercise in nature?
(1= never, 5 = very often)
1
2
3
4
5
Are you a pet owner?
Yes
No
Means or proportion, % SD
49.81
50.19
21.41
4.89
80.83
2.63
1.13
6.77
7.14
1.50
25.76
57.20
17.04
42.15
14.88
11.57
8.68
11.57
11.15
9.43
7.17
9.82
23.01
50.57
4.53
19.24
31.32
27.93
16.98
56.16
43.94

46
Table 4
Descriptive Statistics for Nature Relatedness Scales
Nature relatedness scale
NR self
NR perspective
NR experience
NR overall
Current study sample
(N = 267)
────────────
Mean
SD
3.35
0.79
3.39
0.66
3.67
0.79
3.46
0.57
Normative sample
(N = 183)
───────────
Mean
SD
3.04
0.78
3.52
0.64
3.33
0.85
3.29
0.58
ES
0.40
-0.20
0.40
0.29
sample’s scores for NR are comparable enough to the normative sample to allow for
interpretation.
Bivariate correlations using Pearson’s r were run between CTN (as measured by
the NR scale and its 3 subscales) and demographic variables. See Table 5 for all
correlations. Visual inspection of correlations by scatter plots indicated linear
relationships for all scales examined.
Age was positively correlated with Nature Relatedness for overall NR (r = .25, p
< .01), NR perspective (r = .18, p < .01), and NR self (r = .28, p < .01) but not NR
Experience (r = .12, n.s.). Sex also showed a positive correlation with overall NR (r =
.17, p < .01), NR self (r = .15, p < .05), and NR perspective (r = .30, p < .01), with
women demonstrating higher scores, but not NR Experience (r = -.05, n.s.). No
relationship was found between household income and NR or strength of spiritual beliefs
and NR at the overall or subscale level. A positive correlation was found between GPA
and overall NR (r = .14, p < .05) as well as between GPA and the NR self (r = .16, p <
.05). Exercise outdoors was found to have a positive correlation with overall NR (r = .22,

47
Table 5
Correlations Between Connectedness to Nature and Demographic Variables
Demographic variable
Age
Sexa
Household income
Strength of spiritual beliefs
GPA
Amount of exercise outdoors
Pet ownership
a 0 = male; 1 = female.
* p <. 05.
** p < .01.
Outcome variables
────────────────────────────────────
NR experience NR self NR perspective NR overall
.12
.28**
.18**
.25**
-.05
.15*
.30**
.17**
-.03
-.01
-.03
-.03
.10
.11
-.08
.06
.12
.16*
.01
.14*
.34**
.04
.46**
.22**
.06
.09
.14*
.12
p < .01), NR perspective (r = .46, p < .01), and NR experience (r = .34, p < .01), but no
statistically significant correlation with the NR Self (r = .04, n.s.). Pet ownership was
found to have a positive correlation with NR perspective (r = .14, p < .05) but not NR self
(r = .09, n.s.), NR experience (r = .06, n.s.), or overall NR (r = .12, n.s.).
In order to better understand the properties of the NR scale in comparison to
previous research (Nisbet et al., 2009) correlations between NR scales were also
determined. Overall NR was found to be statistically significantly correlated with the NR
experience (r = .74, p < .01), NR self (r = .88, p < .01) and NR perspective subscales (r =
.65, p < .01). The NR Experience subscale was found to be correlated with the NR self
subscale (r = .51, p < .01) but not the NR perspective subscale (r = .74, n.s.). The NR self
subscale was found to be correlated with the NR Perspective subscale (r = .48, p < .01).

48
These findings are similar to the outcomes of previous research (Nisbet et al., 2009).
In addition to the above correlations, the relationship between the location of
one’s childhood home and CTN as well as Ethnicity and CTN were also examined. A
series of between subjects one-way ANOVAs were performed to determine the
relationship between location of childhood home (urban, suburban, or rural) and the
various aspects of NR. There was a significant effect for location of childhood home on
NR Experience, F(2,261) = 5.95, p < .01. Post-hoc comparisons using the Scheffe test
indicated that the mean score for the rural condition (M = 3.92, SD = 0.66) was
statistically significant and different than the mean scores for the suburban (M = 3.62, SD
= 0.78, p = .03) and urban (M = 3.43, SD = 0.94, p < .01) conditions. There was no
significant effect for location of childhood home for overall NR, F(2,257) = 1.71, n.s.,
NR perspective, F(2,258) = 0.29, n.s.; or NR self, F(2,260) = 1.12, n.s. Those who grew
up in a rural location reported stronger ratings of NR Experience than those who grew up
in urban or suburban settings.
The relationship between Ethnicity and CTN was also determined. Due to the lack
of large sample sizes for many ethnic identities, the variable of Ethnicity was collapsed
and recoded into two categories—White and non-White. This allows for the comparison
of CTN and ethnicity through a series of independent samples t tests. For NR experience
there was a significant difference found between White (M = 3.76, SD = 0.74) and non-
White (M = 3.28, SD = 0.89) students, t(264) = 3.97, p <.01. It appears that White
students endorse stronger ratings of NR Experience than non-White students. No
significant differences between White and non-White students were found for NR self,

49
t(263) = 0.03, n.s.; NR perspective, t(261) = -1.73, n.s.; or overall NR, t(260) = 1.04, n.s.
Aim 2: Connectedness to Nature and Quality of Life
QOL variables were first cleaned and sorted in preparation for analysis. Scale
scores were then computed. All appropriate items were examined for linearity and
normality using box plots, histograms, and an examination of skewness and kurtosis.
Data met the conditions for linearity and normality. See Appendix F for histograms
describing the distribution of scores with means and standard deviations for all
WHOQOL scales.
Next, descriptive statistics were examined for all subscales of the WHOQOL-
BREF (Table 6). These scores were compared to a normative group consisting of a
general community population (Hawthorne, Herman, & Murphy, 2006). Scores were
reported on a scale of 1-100 as recommended by the authors to ensure parsimony with
previous research. The t tests revealed significant differences (p < .05) between the two
samples for physical QOL (t = 7.99) and social relationships QOL (t = 2.03). However, a
Table 6
Descriptive Statistics of WHOQOL-BREF Compared to a Normative Sample
WHOQOL-BREF subscale
Physical QOL
Psychological QOL
Social relationships QOL
Environment QOL
Current study sample
───────────────
Mean
(N = 267)
SD
81.00
11.30
69.00
11.50
69.00
15.60
75.00
10.40
Normative sample
─────────────
Mean
(N = 866)
SD
73.50
18.10
70.60
14.00
71.50
18.20
75.10
13.00
ES
0.41
-0.11
-0.14
0.01

50
calculation of effect size between the two samples reveals small standard mean
differences between the two samples ranging from 0.01 to 0.41. The current sample’s
scores for QOL are comparable enough to the normative sample to allow for
interpretation.
Bivariate correlations using Pearson’s r were run between CTN (as measured by
the NR scale) and QOL variables (as measured by the WHOQOL-BREF). See Table 7
for all correlations. Visual inspection of correlations by scatter plots indicated linear
relationships for all scales examined. Positive correlations were found between NR
experience and several aspects of QOL: general QOL (r = .15, p < .05), physical QOL (r
= .18, p < .01), and psychological QOL (r = .20, p < .01). No other correlations between
NR Experience and QOL variables were significant. No statistically significant
correlations were found between NR Self and QOL variables or between the NR
perspective and QOL variables. A small positive correlation was found between overall
Table 7
Correlations Between Connectedness to Nature and Quality of Life Variables
QOL variable
General rating of QOL
Health satisfaction
QOL physical
QOL psychological
QOL social relationships
QOL environment
* p < .05.
** p < .01.
Outcome variables
────────────────────────────────────
NR experience NR self NR perspective NR overall
.15*
.06
.03
.11
-.08
-.01
-.05
.01
.18**
.02
-.03
.07
.20**
.10
-.01
.14*
.10
.06
.07
.10
.11
.01
-.07
.02

51
NR and psychological QOL (r = .14, p < .05). No other correlations between overall NR
and QOL variables were significant.
In order to better understand the properties of the WHOQOL-BREF in
comparison to use with a normative population, correlations between all QOL subscales
were also examined. Physical QOL was found to be significantly correlated with the
psychological QOL (r = .58, p < .01), social relationships QOL (r = .42, p < .01), and
environment QOL (r = .61, p < .01). Psychological QOL was found to be significantly
correlated with the social relationships QOL (r = .58, p < .01) and environment QOL (r =
.55, p < .01). Social relationships QOL was found to be significantly correlated with
environment QOL (r = .49, p < .01). Current findings are similar to previous results for
this measure (WHO, 2011).
Aim 3: Connectedness to Nature and Mental Health
MH variables were first cleaned and sorted in preparation for analysis.
Appropriate items were recoded and scale scores were computed. All scales were
examined for linearity and normality using box plots, histograms, and an examination of
skewness and kurtosis. Data met the conditions for linearity and normality. Please see
Appendix G for histograms describing the distribution of scores for all MH scales.
Next, descriptive statistics were examined for all subscales and the global severity
index of the SCL-90-R. These scores were compared to a normative group consisting of a
non-patient community sample from which the measure was developed (Derogatis,
1994). See Table 8 for a complete description of both samples. Effect size in the form of

52
Table 8
Descriptive Statistics of the SCL-90 Compared to a Normative Sample
SCL-90 Scale
Somatization
Obsessive-compulsive
Interpersonal sensitivity
Depression
Anxiety
Hostility
Phobic anxiety
Paranoid ideation
Psychoticism
Global severity index
Current study sample
(N = 267)
────────────
Mean
SD
0.32
0.29
0.53
0.37
0.42
0.35
0.45
0.35
0.24
0.29
0.27
0.27
0.10
0.18
0.33
0.33
0.25
0.28
0.33
0.25
Normative sample
(N = 974)
───────────
Mean
SD
0.36
0.42
0.39
0.45
0.29
0.39
0.36
0.44
0.30
0.37
0.30
0.40
0.13
0.31
0.34
0.44
0.14
0.25
0.31
0.31
ES
-0.10
0.31
0.33
0.20
-0.16
-0.08
-0.10
-0.02
0.44
0.06
the standardized mean difference was calculated comparing the current study sample to
the normative sample for all subscales and the global severity index. Effect sizes were
small, with values ranging from 0.02 to 0.44. The current sample’s scores for MH are
comparable enough to the normative sample to allow for interpretation.
Bivariate correlations using Pearson’s r were run between CTN (as measured by
the NR Scale and its three subscales) and MH variables (as measured by the SCL-90-R).
See Table 9 for all correlations. Visual inspection of correlations by scatter plots
indicated linear relationships for all scales examined. Some negative correlations were
found between NR experience and interpersonal sensitivity (r = -.15, p < .05), depression
(r = -.14, p < .05), hostility (r = -.18, p < .01), and phobic anxiety (r = -.12, p < .01). No
other correlations between NR experience and MH variables were significant. No
significant correlations were found between NR self and MH variables. A positive

53
Table 9
Correlations Between Connectedness to Nature and Mental Health Variables
MH variable
Somatization
Obsessive-compulsive
Interpersonal sensitivity
Depression
Anxiety
Hostility
Phobic anxiety
Paranoid ideation
Psychoticism
Global severity index (overall)
*p < .05.
Outcome variables
─────────────────────────────────────
NR experience NR self NR perspective NR overall
.02
.11
.13*
.12
-.08
.06
.06
.02
-.15*
.03
.06
-.03
-.14*
.01
.09
-.03
-.03
.11
.10
.08
-.18**
-.11
-.01
-.13*
-.12**
.06
.08
.01
-.10
.06
.06
.01
-.08
.04
.05
.01
-.09
.08
.10
.04
**p < .01.
correlation was found between NR perspective and somatization (r = .13, p < .05), but no
other correlations between NR perspective and MH variables were significant. A negative
correlation was found between overall NR and hostility (r = -.18, p < .05). No other
correlations between overall NR and MH variables were found to be significant.
Aim 4: Multiple Regression
First, zero-order correlations were calculated among all variables to be included
as predictors for subsequent regressions: demographic characteristics, the QOL scales,
and MH scales. These were analyzed to determine the potential influence of
multicollinearity. See Table 10 for a complete description of all correlations.
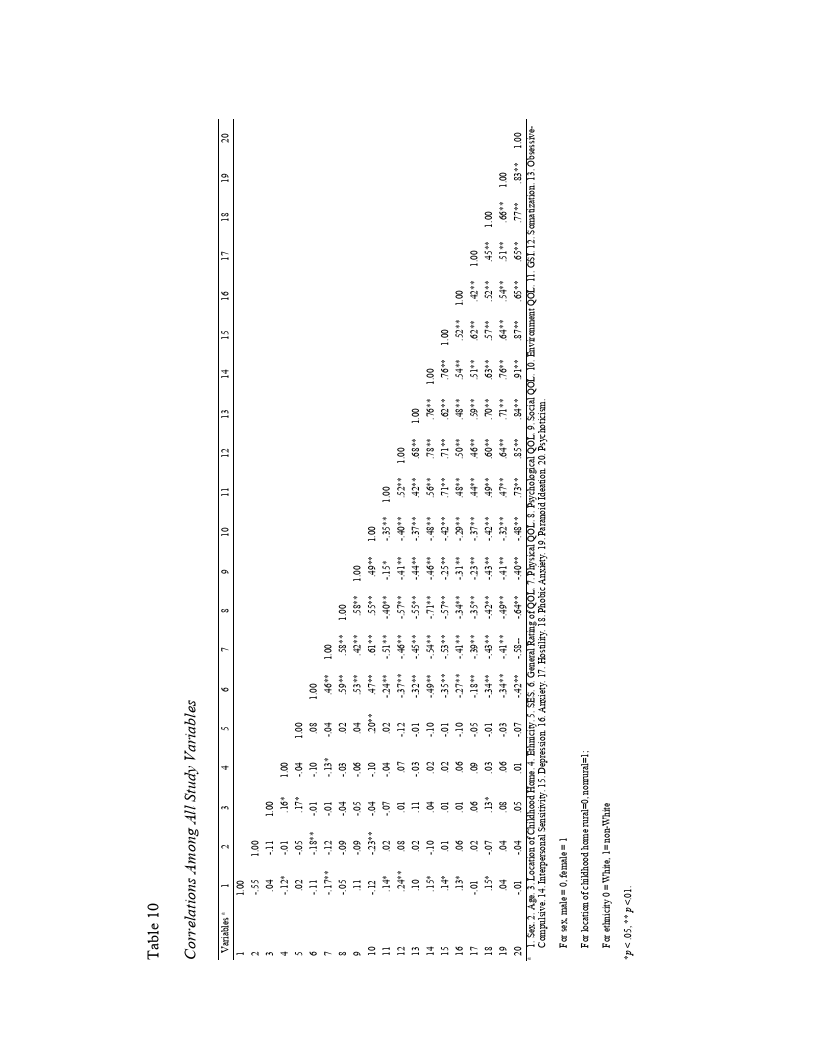
54

55
Due to strong correlations between predictor variables there were initial concerns
of multicollinearity in this sample. All MH variables were significantly correlated with
all QOL variables at moderate to high levels. In addition, sex was associated with several
aspects of MH, QOL, and demographics. Furthermore, location of childhood home was
correlated with ethnicity and SES, while environment QOL was correlated with SES and
age. Given the already-established correlation between MH and QOL (Barros da Silva
Lima et al., 2005; Trompenaars et al., 2005, 2006), these correlations were expected. The
potential for multicollinearity in this sample will be assessed through regression analysis.
To determine the variance in CTN explained by the predictor variables in addition
to examining the extent of the multicollinearity between the QOL and MH variables, a
single entry multiple regression analysis was performed which included the QOL scales,
the GSI, and demographic variables. Due to the high correlations between MH subscales,
it was hoped that using the GSI instead of MH subscales would give a clearer picture of
the potential multicollinearity between MH and QOL while also giving a calculation of
the variance in CTN explained by the predictors. Ethnicity was dichotomized to
white/nonwhite based on the characteristics of the sample, and location of childhood
home was dichotomized to rural/nonrural based on the results of a previous ANOVAs.
With 167 participants analyzed for this regression, it was determined that adequate power
existed to account for the 10 predictor variables in the regression equation.
The model was found to meet all assumptions for performing regression. The
model was shown to have a significant fit for the data overall, R = 0.39; F(10, 166) =
4.13, p < .01. Table 11 displays the results of the multiple regression analysis predicting

56
Table 11
Multiple Regression: Predicting Overall Nature Relatedness with Demographic
Variables, QOL Variables, and GSI
Coefficientsa
────────────────────────
Unstandardized
Standardized
coefficients
coefficients
Colinearity statistics
─────────── ─────────── ───────────────
Variable
SE
p value Tolerance
VIF
(constant)
Sexb
1.25
0.65
.06
0.17
0.09 0.15
.05
.90
1.12
Age
0.03
0.01 0.29
.01
.91
1.11
Location of childhood homec -0.02
0.10 -0.02
.82
.94
1.07
Ethnicityd
-0.06
0.11 -0.04
.55
.92
1.08
SES
0.01
0.01 0.02
.84
.88
1.13
QOL physical
0.10
0.11 0.09
.36
.51
1.96
QOL psychological
0.31
0.10 0.35
.01
.39
2.56
QOL social relationships
-0.03
0.06 -0.05
.60
.63
1.56
QOL environment
-0.03
0.11 -0.02
.79
.53
1.90
GSI
0.01
0.01 0.24
.01
.53
1.90
a F= 4.13, R= 0.39, R2 = 0.15, p < 0.01.
b male = 0, female = 1.
c rural = 0, nonrural = 1.
d White =0, non-White = 1.
overall NR. The model with all 10 predictor variables accounts for approximately 15% of
the variance in nature relatedness for the sample (R2 = .15). However, the model only
accounts for 11% of the variance of the population (adjusted R2 = .11).
Previous research (Myers, 1990) indicated that predictor variables with a
tolerance statistic of less than 0.10 should be considered a significant risk for
multicollinearity. Similarly, predictor variables with a VIF statistic of 10 or greater also
indicate a strong risk for multicollinearity. For the current regression, tolerance levels

57
ranged from .39 to .94, with VIF statistics ranging from 1.07 to 2.56. Therefore,
multicollinearity was not deemed a concern for this particular regression and it is possible
to interpret the contributions of predictor variables.
Sex (t = 2.01, p = .05), age (t = 3.95, p = .01), psychological QOL (t = 3.08, p =
.01), and the GSI (t = 2.48, p = .01) all had had significant beta weights. No other
predictor variables demonstrated statistical significance.
To determine the contribution of all aspects of QOL and MH in the prediction of
CTN, a single entry multiple regression analysis was run with demographic (see Table
12), QOL subscales, and MH subscales as predictors. SES, Ethnicity, Social QOL, and
Environment QOL were removed as predictors due to their lack of correlation with CTN
variables, lack of previous literature demonstrating any relationship between these
variables and CTN, and very low beta weights in the previous regression. With 196
participants analyzed, it was determined that adequate power existed to account for the 14
predictor variables in the regression equation.
Again, the predictors were examined in light of their colinearity using the
standard of a tolerance level less than .10 and a VIF greater than 10 to indicate significant
multicollinearity in a predictor variable (Myers, 1990). For the current regression
analysis, tolerance levels ranged from .17 to .94 and VIF statistics ranged from 1.06 to
6.05. Therefore, multicollinearity was not deemed a concern for this regression equation.
Age (t = 4.24, p < .01), sex (t = 2.62, p = .01), psychological QOL (t = 3.17,
p < .01), anxiety (t = 2.00, p = .05), and Hostility (t = -1.95, p = .05) had significant beta
weights for regression. No other predictor variables demonstrated statistical significance.

58
Table 12
Multiple Regression: Predicting Overall Nature Relatedness with Demographic, QOL,
and Mental Health Variables
Coefficientsa
─────────────────────────
Unstandardized
coefficients
───────────
Standardized
coefficients
────────────
Variable
SE
p value
(constant)
1.58
0.55
.01
Sexb
0.21
0.08
0.18
.01
Age
0.03
0.01
0.28
.01
Location of childhood homec -0.09
0.09 -0.07
.33
QOL physical
0.01
0.10
0.01
.97
QOL psychological
0.28
0.09
0.33
.01
Somatization
0.01
0.01
0.02
.87
Obsessive-compulsive
0.01
0.01
0.13
.25
Interpersonal sensitivity
0.01
0.01
0.07
.58
Depression
-0.01
0.01 -0.14
.37
Anxiety
0.03
0.01
0.26
.05
Hostility
-0.03
0.02 -0.16
.05
Phobic anxiety
-0.03
0.02 -0.13
.15
Paranoid ideation
0.01
0.02
0.02
.82
Psychoticism
0.02
0.01
.16
.16
a F= 3.77, R= 0.46, R2 = 0.21, p < 0.01.
b male = 0, female = 1.
c rural = 0, nonrural = 1.
Colinearity statistics
─────────────
Tolerance
VIF
.82
1.22
.91
1.10
.94
1.06
.50
2.01
.38
2.67
.40
2.50
.31
3.18
.27
3.74
.17
6.05
.24
4.20
.60
1.67
.47
2.13
.42
2.38
.30
3.30
Based on previous significant correlations between the NR Experience scale and
measures of MH and QOL, another model was created to determine the ability of
variables to predict NR Experience. Variables were chosen based on previous research
linking experiences in nature with MH, QOL, and demographic variables as well as
previous significant relationships found in this study. The GSI was chosen instead of the
9 MH subscales due to concerns about possessing adequate power to perform the

59
regression. With 209 participants analyzed, it was determined that adequate power
existed to account for the 8 predictor variables in the regression equation.
Using a tolerance level of less than .10 and VIF statistics greater than 10 to
represent significant multicollinearity (Myers, 1990), the predictors were examined in
light of their collinearity. For the current regression, tolerance levels ranged from .47 to
.97 and VIF statistics ranged from 1.04 to 2.13. Therefore, despite correlations between
many predictor variables, multicollinearity was not deemed a concern for this regression
equation.
The model was found to meet all assumptions for performing regression. The
model was shown to have a significant fit for the data overall, R = 0.59; F(8, 208) =
13.35, p < .01. Table 13 displays the results of the multiple regression analysis predicting
NR Experience. The model with all 8 predictor variables accounted for approximately
35% of the variance in nature relatedness for the sample (R2 = .35). However, the model
only accounted for 32% of the variance of the population (adjusted R2 = .32). Age (t =
2.15, p = .03), Sex (t = -2.15, p = .03), Ethnicity (t = -3.21, p = .01), Location of
Childhood Home (t = -1.98, p = .05), and Amount of Exercise Outdoors (t = 7.62, p =
.01) had significant beta weights for regression. Psychological QOL approached
significance (t = 1.91, p = .06). No other predictor variables demonstrated statistical
significance.

60
Table 13
Multiple Regression: Predicting NR Experience with Demographic, QOL, and Mental
Health Variables
Coefficientsa
────────────────────────
Unstandardized
coefficients
───────────
Standardized
coefficients
───────────
Variable
SE
p value
(constant)
2.39
0.69
.01
Age
Sex b
0.02
0.01
0.13
.03
-0.21
0.10 -0.13
.03
Ethnicity
-0.38
0.12 -0.19
.01
Location of childhood home c -0.22
0.11 -0.12
.05
Exercise outdoors
0.33
0.04
0.46
.01
QOL physical
-0.03
0.12 -0.02
.81
QOL psychological
0.20
0.10
0. 16
.06
GSI
0.01
0.01
0.07
.42
a F= 13.35, R= 0.59, R2 = 0.35, p < 0.01
b male = 0, female = 1
c rural = 0, nonrural = 1
Colinearity statistics
─────────────
Tolerance
VIF
.97
1.04
.92
1.09
.92
1.09
.96
1.04
.90
1.11
.55
1.83
.47
2.13
.50
2.00

61
CHAPTER V
DISCUSSION
The present study aimed to determine the relationship between CTN as measured
by Nature Relatedness and three other areas: demographic characteristics of the sample
(Aim 1), QOL (Aim 2), and MH (Aim 3). In addition, the contribution of various
predictors to CTN, including aspects of QOL, MH and demographics, was investigated
(Aim 4). Drawing on the theoretical framework of biophilia (Kellert & Wilson, 1993;
Wilson, 1984) and ecopsychology (Buzzell & Chalquist, 2009; Roszak et al., 1995) as
well as previous work examining the construct of CTN (Mayer & Frantz, 2004; Nisbet et
al., 2009), it was predicted that QOL and MH would positively correlate with CTN and
that aspects of QOL, MH, and demographics would all contribute significantly to the
variance of CTN.
These hypotheses were all supported. CTN was found to be positively correlated
with numerous demographics including age, sex, GPA, pet ownership, and amount of
outdoor exercise. Regarding QOL, physical and psychological QOL were both found to
be correlated with aspects of CTN. CTN was also found to be associated with some
aspects of MH such as hostility, depression, and phobic anxiety. Additionally,
demographic, QOL, and MH variables were found to predict around one fifth of the
variance in overall CTN. Age, sex, psychological QOL, anxiety, and hostility were found
to be significant predictors in this model.
Knowledge of these relationships may be helpful in predicting factors related to
overall health and wellness. In addition, this knowledge may be used to promote future

62
positive health behaviors. These possibilities, a further examination of the results, as well
as limitations and potential implications of these findings will be discussed in more detail
in the following sections.
Demographics
The sample was evenly distributed by sex. In terms of age, the sample was young,
with 92% reporting an age under 30. This limited range may account for CTN’s low
correlations with age. While the majority of the population identified as being from a
suburban environment, those from urban and rural areas were also well represented. This
statistic is consistent with the population distribution of the geographic area from which
the students are drawn. It should also be noted that the strong ratings of spirituality
endorsed this sample of college students may limit generalizability.
Implications for Past Theory and Research
The theory and research of ecopsychology (Buzzell & Chalquist, 2009; Roszak et
al., 1995) suggested that our health and wellness as human beings is in some way related
to the health of the natural world and our ecosystem. It also stated that sentiments of CTN
are associated with positive outcomes in health and well-being. The current study
attempted to test this hypothesis of the linkage between sentiments of connectedness to
nature and outcomes of health, well-being, and QOL. The following sections will
examine the findings of the connection between CTN and well-being as broken down by
each specific hypothesis and also relate those findings to previous research in the field.

63
CTN and Demographics
It should be noted that the current sample (Table 4) reported significantly higher
mean scores for all three subscales and the overall scale when compared to the population
on which the norms for this measure were established (Nisbet et al., 2009). Perhaps this is
due to a social desirability effect and an understanding of the underlying hypotheses of
the study. Or it is possible that they expressed higher scores due to unique characteristics
of this sample such as abundant access to the outdoors and proximity to rural areas.
However, while differences between samples were statistically significant, the effect
sizes were small, indicating that the two samples’ qualities were comparable. Therefore,
it appears appropriate to apply findings derived from the normative sample for use in the
current sample.
Older individuals displayed higher ratings of nature relatedness and age
contributed significantly to the prediction of both overall CTN and NR experience. These
are novel findings not noted in previous studies of CTN that use the Nature Relatedness
Scale (Nisbet et al., 2009, 2010) or Connectedness to Nature Scale (Mayer & Frantz,
2004; Mayer et al., 2009). Because of the restricted age range of the sample (78% are 18-
22, 92% are under 30, and 99% are under 40), these findings should not be applied to
middle-aged or older adults.
Women were also found to endorse stronger ratings of CTN than men, and sex
was shown to be a significant predictor of both overall CTN and NR experience. Again,
this is a novel study not previously noted in the literature and could be associated with
gender instead of biological sex. Previous studies examining the new ecological

64
paradigm, a more cognitive measure of environmental beliefs, did report that women
displayed more positive attitude towards the environment than men (Mayer & Frantz,
2004; Zelezny, Chua, & Aldrich, 2000). Thus, findings regarding a sex difference in
measures relating to the natural world appear to be mixed. Since the sex difference in the
current study was even more pronounced when examining the NR Perspective scale than
the overall scale, this may suggest that women are more capable of understanding the
world from a non-human point of view. It is possible that women are more inclined
towards taking the perspective of animals, plants, and living beings besides humans. This
would be consistent with previous research noting gender differences for sympathetic and
empathetic responses towards people (Berg, Majdan, Berg, Veloski, & Hojat, 2011; Lee,
Gibbons, & Short, 2010) and animals (Angantyr, Eklund, & Hansen, 2011).
The finding that pet owners reported higher ratings of NR Perspective is
consistent with previous research (Nisbet et al., 2009). As this scale measures one’s sense
of humanity’s place in the broader ecosystem, it is not surprising that those who own pets
are also more aware of the place of human beings in a larger natural context. However,
this effect is very small, and of limited practical significance.
The relationship between exercise outdoors and NR as evidenced by both
correlations and through exercise outdoor’s significant prediction of NR Experience
suggests that more desire for contact with the natural world is associated with stronger
sentiments of CTN. This conclusion is particularly relevant to the place of humanity in
the global ecosystem and one’s desire for direct experiences in the natural world. This
finding is consistent with previous research demonstrating that more time spent in the

65
natural world is closely affiliated with sentiments of affinity towards the natural
environment (Kals, Schumacher, & Montada, 1999; Raudsepp, 2005). In addition, these
findings are consistent with the work of Kellert (2002), who indicated that direct contact
with nature through experiences such as time spent outdoors plays a significant role in
determining sentiments of CTN. This finding also serves to increase the construct validity
of the NR scale; it is expected that those who report spending more time outdoors would
also feel more connected to natural areas.
Similarly, the finding that rural individuals endorse stronger sentiments of NR
Experience is consistent with previous research (Klassen, 2010; Muller, Kals et al.,
2009). It is suggested that this may be due in large part to an increased level of exposure
to nature due to geography and lifestyle which is inherent in rural life. Or, it could be that
rural inhabitants place a higher value on nature for economic reasons. Further exploration
of the relationship between rural location and CTN would be useful.
Additionally, the results of the current study suggest that White individuals
demonstrate higher levels of one aspect of CTN, NR Experience, than non-White
individuals. Ethnicity was also shown to be a significant predictor of NR Experience.
This suggests that the non-White members of the sample are less inclined to value direct
experiences in the natural world as measured by the NR scale. This finding has not been
reported in previous research using the NR scale (Nisbet et al., 2009, 2010) or
Connectedness to Nature Scale (Mayer & Frantz, 2004; Mayer et al., 2009). One
possibility for this novel finding is that cultural differences between ethnicities may
account for a different valuation of experiences in the natural world. This would be

66
consistent with previous research linking differences in outdoor recreation preferences by
ethnicity (Carr & Williams, 1993; Walker, Deng, & Dieser, 2001). It is possible that
further exploration with a more diverse sample will reveal interesting features of the
relationship between CTN and ethnicity.
Based on the results of this sample, it appears that White individuals and women
report higher ratings of CTN. These are novel findings not appearing in previous
research. Older individuals may also endorse stronger sentiments of CTN, but the
sample’s small range limits the value of this finding. Supporting previous research, those
who exercise more outdoors and those from a rural background also endorse higher
ratings of CTN. Finally, no relationship between SES and spirituality was found in these
exploratory domains.
CTN and QOL
Ratings of QOL are in general similar between this sample and a normative
community sample (Hawthorne et al., 2006). However, it should be noted that the current
sample reported significantly higher ratings of physical and social QOL than the
normative sample. Since this is a young sample, it is generally expected that they are
likely to have fewer physical health problems than a sample from the general population.
Also, the social and collegial nature of the undergraduate experience could explain higher
ratings on social QOL. However, it should be noted that effect sizes for differences
between groups for all subscales were small. Therefore, it is reasonable to state that this
population, despite being slightly more physically healthy and social, is comparable to

67
the general population.
It appears that, for this sample, QOL has few direct relationships to
Connectedness to Nature. Based on these results, one’s sentiments about their built
environment and community as measured by environment QOL appear to be unrelated to
CTN. Previous literature has not examined this specific construct and its relationship to
CTN (Mayer & Frantz, 2004; Nisbet et al., 2009). However, research involving
participants from rural areas demonstrated that rural inhabitants reported stronger
sentiments of CTN than others (Klassen, 2010; Muller et al., 2009). Given that this rural/
nonrural difference was also found in the current study, it is likely that the Environment
QOL scale does not tap into the same domains which would distinguish rural and
nonrural participants. Previous research has also found that natural aspects of one’s
environment, such as plants and gardens, also influence QOL (Frumkin, 2001). Again,
questions from the WHOQOL-BREF do not directly address these natural features of
one’s environment so it is not possible to establish if the current findings support or
refute previous research. The findings of the current study do suggest that non-natural
aspects of one’s environment such as transportation and safety appear to be unrelated to
CTN. It is possible that if elements of one’s environment more closely related to nature
were examined, such as access to outdoors activities or the presence of parks and
gardens, then there may be more of a relationship found between environment and CTN.
The lack of statistically significant correlations between CTN and the Social
Relationships facet of QOL does not support previous research indicating that a sense of
community and strong interpersonal relationships can contribute to values of

68
environmentalism (Marcus et al., 2011). However, there is a difference between the
construct of environmentalism used in that previous research and the current construct of
CTN. While environmentalism only taps values and beliefs towards nature, CTN also
contains an emotional and experiential component. Therefore, while the current findings
do not fall in line with previous research, the construct measured was new in this
exploratory study and should not be considered a direct contradiction. Based on these
findings, it appears that the quality of one’s social relationships is not directly associated
with CTN.
In addition, one’s sense of satisfaction for their overall health appears to be
unrelated to overall CTN based on the results of this study. Similarly, physical QOL
appears unrelated to overall CTN. Since previous studies have found a relationship
between exposure to nature and physical health, this finding is unexpected and
contradicts previous studies. Previous research has concluded that experiences in nature
directly relate to benefits for one’s physical health (Chalquist, 2009; Frumkin, 2001), and
that exposure to nature also supports healing (Moore, 1981; Ulrich, 1984). Since it is
known that direct experiences in nature contribute significantly to CTN (Kellert, 2002),
this finding contrasts with previous literature. This discrepancy could be accounted for by
the operational definition of physical health as measured by the WHOQOL-BREF.
Perhaps the aspects of physical health that were measured such as one’s energy level,
sleep, and ability to move around are unrelated to CTN yet other aspects of physical
health may be related. And, while exposure to nature may be related to physical health,
based on the findings of this study it is not appropriate to draw a similar connection

69
between CTN and physical health. It is also possible that since this population is younger
and healthier than a normative sample the lack of findings may be due to a ceiling effect
which restricts the range of scores regarding physical health problems.
The small positive correlation between overall CTN and psychological QOL as
well as psychological QOL’s significant prediction of overall CTN suggests a
relationship between MH and CTN. Those with stronger sentiments of NR Experience
also endorse a higher level of psychological health. This relationship will be examined in
more detail in an upcoming section.
It is also important to note the significant positive relationship of NR experience
with physical QOL, psychological QOL, and general QOL. It appears that this particular
aspect of nature relatedness is associated with many aspects of QOL. Those who more
strongly value experiences and direct participation in the natural world also endorsed
stronger ratings for several facets of QOL. This is consistent with previous research
linking direct experiences in nature with increases in health and well-being (Chalquist,
2009; Frumkin, 2001; Kaplan & Kaplan, 1989; Serpell, 1991). While NR Experience is
not a direct measurement of one’s level of contact with the natural world, it does show
that those who are more interested in interacting directly with the natural world report a
higher QOL than those who are less interested. It appears that both the cognitive and
abstract aspects of CTN (NR perspective) and the personal aspects of CTN (NR self) are
not associated with QOL. Perhaps one’s QOL is more closely associated with
experiences and actions in nature than how one intellectualizes the natural world or sees
themselves fitting into the larger natural world. Future research could examine the

70
relationship between one’s specific nature-related behaviors and the NR Experience
scale.
Based on the results of this sample, the NR experience subscale is most closely
related to domains of QOL, especially for QOL’s overall, physical, and psychological
aspects. This supports previous research on the importance of direct experiences in nature
for the promotion of health and well-being. Overall CTN is largely unrelated to QOL
except in the psychological domain. The built environment and social relationships
subscales of QOL were found to be unrelated to CTN.
CTN and Mental Health
The descriptive statistics of the current sample for the SCL-90-R appeared similar
in many ways to the normative sample (Derogatis, 1994). Consequently, effect sizes
between the current and normative sample were all small. Since the normative and
current samples appear to be similar, it is appropriate to apply findings derived from the
normative sample for use in the current study.
It appears that NR Experience is the most related of the four NR scales to
psychological distress. Like NR Experience and QOL, this subscale appears to be more
related to health and wellness than other subscales or the overall score. As with the NR
scale and the WHOQOL-BREF, one’s sentiments towards directly interacting with the
natural world are more closely related to health outcomes than one’s personal sense of
place in the larger natural world or one’s sense of humanity’s place in the larger
ecosystem. This supports previous research linking direct experiences in nature with

71
gains in overall MH (Chalquist, 2009; Frumkin, 2001; Herzog & Strevey, 2008; Kaplan
& Kaplan, 1989). More specifically, the current findings support previous research that
contact with animals reduces stress (Siegel, 1990) and depression (Siegel et al., 1999),
and that contact with plants improves MH outcomes (Jarrot & Gigliotti, 2010; Rice et al.,
1998). Furthermore, the current findings regarding the importance of experiences in
nature for MH are in line with previous research on the restorative effects of the natural
world (Herzog et al., 1997, 2003) and the power of nature to reduce stress (Laumann et
al., 2001). In addition, the current study supports previous research regarding the
influence of experiences in nature to enhance well-being (Kaplan, 2001) and raise mood
(Rader, 2009). The connection between NR experience and MH found in the current
study is consistent with the available research connecting direct experiences in the natural
world with positive MH outcomes.
Those who reported stronger ratings of NR experience tended to also demonstrate
lower scores on the interpersonal sensitivity subscale. Therefore, those who expressed
more of a desire to engage in direct experiences in the natural world were less likely to
feel inadequate when compared to other people. Since no previous research has compared
CTN to interpersonal sensitivity as measured by the SCL-90-R, this finding should be
considered novel. While the correlation is low and the practicality of this finding is
limited, future research investigating the relationship between experiences in nature and
perceptions of social relationships may prove fruitful.
In addition, higher ratings of NR Experience are also associated with lower
reports of depressive symptoms. It appears that the desire to engage in direct contact with

72
the natural world is associated with fewer symptoms of depression. This falls in line with
previous research regarding direct experiences in nature and mood: rural inhabitants
experience fewer symptoms of depression (Weich et al., 2006) and ownership of pets (a
way of directly experiencing nature) is associated with decreases in depression (Siegel et
al., 1999). The current finding is also consonant with research demonstrating that
experiences in nature increase positive affect (Nisbet & Zelenski, 2011). Since the
correlation between NR experience and depression is weak, the practical significance of
this finding is limited. Future research should more closely examine the relationship
between experiences in nature and depression.
NR Experience was also found to be associated with less phobic anxiety, and
anxiety served as a significant predictor of NR experience. Since the natural world may
be a frightening place for many people, this finding could indicate that those who desire
experiences in nature are less fearful of nature’s potential dangers. The current finding is
also consistent with previous research documenting the stress-reducing impact of nature
(Laumann et al., 2001; Rader, 2009) and may also be related to research documenting the
reduction in sympathetic nervous system arousal which accompanies exposure to nature-
related stimuli (Fredrickson & Levenson, 1998; Fredrickson et al., 2000).
It is interesting to note the small yet statistically significant correlation between
NR perspective and somatization. Those who take in nature as part of their sense of self
are also more likely to report physical complaints. No previous research has documented
this specific finding but it is inconsistent with previous research demonstrating that
somatization is associated with less empathy (Bellet, 2003). Perhaps those who are

73
sensitive to the distress associated with the mistreatment of our ecosystem also are more
likely to express their own distress in physical ways. However, implications are limited
due to the small effect size of this finding. Future research would be useful in further
exploring this possible connection.
NR experience and overall NR were also associated with less Hostility in the
current study. Additionally, hostility was also shown to be a significant predictor of
overall NR. No previous research has documented these relationships. It appears that
those who feel more strongly connected to the natural world experience less anger,
aggression, and irritability. It could be that exposure to nature has a restorative effect on
MH and promotes positive subjective well-being as suggested by previous research
(Kaplan & Kaplan, 1989; Nisbet & Zelenski, 2011). Or, this finding could be accounted
for by the stress-reducing and restorative capacity of the natural world (Herzog et al.,
1997, 2003; Kaplan, 2001). However, these hypotheses should be tempered by the low
correlations and effect sizes between hostility and CTN. Still, this finding opens the door
to the possibility that experiences in the natural world may have a calming effect and
nature could be utilized as an intervention to work with anger.
In addition, it should be noted that none of the NR scales were directly correlated
with an overall measure of psychological distress: the Global Severity Index. However,
based on the results of multiple regression, the GSI was found to be a significant
contributor in the prediction of CTN. These somewhat contradictory findings are
interesting in light of previous literature reviews which mention the overall benefits of
exposure to nature for MH (Chalquist, 2009; Frumkin, 2001). It appears that although

74
there are certainly relationships between specific facets of MH and CTN, the connection
between MH and CTN at the broad, global level is more ambiguous and requires more
research to decipher.
Based on the data from this sample, one may conclude that CTN as a general,
overall construct shares few direct ties to MH. However, the NR Experience subscale,
which is more closely tied to an affinity for direct experiences in nature, was associated
with fewer symptoms of mental distress across numerous domains including depression,
hostility, and anxiety.
CTN and Predictors
QOL, MH, and demographic variables explain about 21% of the variance in
overall NR and 35% of the variance in NR experience. Since no previous research has
looked at CTN, MH, and QOL variables together, this method of analysis is novel in the
literature. Thus, it is difficult to compare this finding to any previous research. It can be
noted, however, that since the model only explains less than one quarter of the variance
in overall CTN, it appears that there are many more factors involved that contribute to
one’s sentiments of connectedness to the natural world than simply MH, QOL, and some
demographic variables. More specifically, previous research (Kellert, 2002) indicated that
direct exposure and contact with nature is likely to be a strong predictor of CTN.
Similarly, the larger amount of total variance explained for NR experience than overall
NR suggested that one’s desires for direct experiences in nature may be more important
in the prediction of health and wellness than more cognitive aspects of CTN. This is

75
supported by the significant contribution and relatively high beta weight of amount of
exercise outdoors. This would seem reasonable in light of previous research documenting
the importance of direct experiences in nature in the creation of a stronger relationship
with the natural world (Kellert, 2002). Future research should examine this possibility.
It appears that MH, QOL, and some demographic variables predict a small yet
significant amount of the variance in CTN. Although specific predictors were shown to
be significant in the prediction of CTN and multicollinearity was dismissed as a possible
concern, these findings should be interpreted with caution and hypotheses held tentatively
until the appearance of supporting research. In addition, beta weights form many
predictors are low, indicating relatively small contributions of individual predictors. More
research would be beneficial in attempts to identify other variables which may predict
CTN.
Limitations
The results and implications of this study depend on the efforts to minimize
potential threats to internal, external, statistical, and construct validity (Campbell &
Stanley, 1996). Construct validity was addressed by choosing measures which were able
to demonstrate a history of reliability, validity, and use in previous research. While the
WHOQOL-BREF and the SCL-90 measures can be considered to demonstrate strong
internal and external validity and extensive use in previous research, less information is
known about the NR Scale. While previous research has demonstrated the NR Scale’s
strong internal and construct validity, its use in research has been limited to only a few

76
studies with restricted populations (Nisbet et al., 2009, 2010; Nisbet & Zelenski, 2011).
Still, for reasons noted in earlier sections, it was decided that this measure represented the
best operational definition of CTN while still maintaining adequate validity.
In terms of statistical validity, efforts to control for potential Type I and Type II
errors were carried out by choosing an alpha level of .05 and then by conducting a priori
power analysis in order to select an adequate sample size. However, since multiple
correlations were run over the course of analysis, the rate of Type I error was greatly
increased. Therefore, it is likely that some correlations which were flagged as statistically
significant in this study are spurious. Still, because this study was intentionally framed as
exploratory research, the large amount of bivariate correlations is acceptable and
necessary.
Internal validity may be limited by participant expectancies. Although minimal
information regarding the study was presented, it is possible that participants were aware
of the experimenter’s hypotheses and research questions due to the overt nature of the
survey research.
While many significant correlations were found, it is important to note that almost
all could be classified as “weak” (r < 0.30). Thus, while statistically significant, by
definition these weak correlations mean that CTN could account for no more than 9% of
the variance in each aspect of MH or QOL (R2 < .09). Therefore, it is important
understand the limited practical significance of these findings. While these results may
certainly be useful in the support or refutation of previous research, it would be
premature to imply that these findings carry definitive practical meaning or clinically

77
significant effects.
It is possible that the restricted range of ages played a role as to why such low
correlations were found. Also, because most of the subscales for MH lacked many
participants who endorsed moderate or high scores of psychopathology, it is not possible
to draw conclusions for CTN and MH for individuals who endorse strong ratings of
psychopathology. This could also potentially limit the possibility of strong correlations
and effect sizes between CTN and MH.
External and population validity is limited by the characteristics of the sample. It
should be noted that this sample is largely one of convenience. Introductory psychology
students volunteered to participate in the study from a wide variety of research options,
and thus the sample is susceptible to selection bias. The sample was also composed of
predominately college-aged, white, religious individuals from the Intermountain West.
Even though participants represented a large and diverse section of the student body, not
all English classroom teachers volunteered their classes for participation and thus those
which chose to participate may not be representative of the larger introductory English or
USU populations. Therefore, generalization to the student body of this university as well
as external populations should be made with caution. Replication of this research with
other groups is needed to reconsider limits on generalization.
Also, since these data are correlational, it is not possible to make any inferences
regarding cause and effect of CTN and well-being. There is no way of knowing any path
of causation, or if there is potentially an unknown factor influencing both CTN and
health.

78
Implications
The goal of this study was to gain more information regarding the relationship
between CTN and QOL, MH, and demographic variables. This will provide useful
information to direct future research regarding efforts to increase overall levels of well-
being as well as potentially provide direction in the promotion of increases in CTN and
positive environmental behaviors. Based on the findings of this study, Overall CTN as
measured by the NR scale appears to have some small yet significantly correlated
relationships to measures of health and QOL. Considering the numerous factors which
influence MH and QOL, this finding appears reasonable. Based on the results of multiple
regression analysis, QOL, demographic, and MH variables still contribute significantly to
CTN. It appears that, while minor, there is a direct connection between health and
wellness with the concept of CTN.
One interesting finding concerned the important relationship of the NR
Experience scale with characteristics of health and QOL. It appears that the value of
desiring to directly engage with nature is more closely related to health outcomes than
one’s perceptions of humanity’s place in the natural world (NR perspective) or one’s
personal views of their own relationship with nature (NR self). This is consistent with
previous work demonstrating the importance of NR experience in the use of nature as a
restorative environment (Nisbet & Zelenski, 2011) and the role of direct experiences in
nature to improve cognition (Mayer et al., 2009). Based on the results of this study, NR
Experience and the desire for direct experiences in nature appears to be an important
element in the relationship of CTN and well-being.

79
In addition, differences in ethnicity and location of childhood home are associated
with NR experience but no other measures of NR. Thus, it is possible that the value given
to direct experiences in nature may vary in different groups.
Interventions designed to increase NR Experience, such as direct contact with the
natural world, may demonstrate usefulness in increasing MH and QOL. Or, perhaps those
who demonstrate higher levels of well-being are more interested in seeking experiences
in the natural world. Due to the correlational, cross-sectional design of this study, such
possibilities are only speculative.
Future Directions
Future studies could examine the possibility of manipulating CTN, more
specifically the NR Experience scale, which was found to be the most closely related to
well-being. This could be done directly through interventions in the nature or outdoor
activities or indirectly through the “greening” of communities by the placement of parks,
gardens, and other natural spaces. Since NR experience was related to MH, a closer
examination of variables which could serve as potential mediators to this connection
could be examined.
Given that the population was physically healthier than the normative sample for
the measure of physical QOL, future research could include a wider range of physical
QOL scores in order to see how CTN is related to health status. On a related note, it
would be interesting to examine CTN in the context of disability. Perhaps those of
different ability statuses have varying relationships with the natural world. Also, it may

80
be possible to design interventions involving CTN may be useful to improve physical
health and well-being.
It also may prove fruitful to further investigate the difference in CTN between
those from rural areas and those from nonrural areas to determine what specific factors of
rural lifestyle contribute to higher ratings of CTN.
Since hostility and anger appeared to be negatively related to CTN, it may be
interesting to further explore this relationship. This finding could be used in the creation
of nature-based interventions for those struggling with anger or interpersonal problems.
In addition, it would be useful to examine CTN in a more diverse sample.
Extending to a national or worldwide population may provide more information about
people’s relationships with the natural world and present a broader context for research
regarding CTN and well-being. A wider range of ages and ethnicities may increase the
capacity for generalization of these findings and potentially reveal any existing
differences in CTN based on those variables.
Similarly, it would be useful to include individuals with stronger ratings of
psychopathology and an endorsement of lower levels of QOL. This could potentially
serve to produce stronger correlations and effect sizes as well as indicate a higher degree
of practical significance for these findings.

81
REFERENCES
American Psychiatric Association. (2000). Diagnostic and statistical manual of mental
disorders (4th ed.). Washington, DC: Author.
Angantyr, M., Eklund, J., & Hansen, E. M. (2011). A comparison of empathy for humans
and empathy for animals. Anthrozoös, 24, 369-377.
Barros da Silva Lima, A., Fleck, M., Pechansky, F., de Boni, R., & Sukop, P. (2005).
Psychometric properties of the World Health Organization Quality of Life
instrument (WHOQOL-BREF) in alcoholic males: A pilot study. Quality of Life
Research, 14, 473-478.
Bellet, B. L. (2003, June). An investigation of personality factors in somatization and
hypochondriacal tendencies: A study of coping style, attachment, alexithymia and
empathy. Dissertation Abstracts International: Section B. Sciences and
Engineering, 63(12), 6085.
Bender, L. (producer), & Guggenheim, D. (director). (2006). An inconvenient truth
[motion picture]. Beverly Hills, CA: Lawrence Bender Productions.
Berg, K., Majdan, J. F., Berg, D., Veloski, J., & Hojat, M. (2011). Medical students’ self-
reported empathy and simulated patients’ assessments of student empathy: An
analysis by gender and ethnicity. Academic Medicine, 86, 984-988.
Bragg, E. A. (1996). Towards ecological self: Deep ecology meets constructionist self-
theory. Journal of Environmental Psychology, 16(2), 93-108.
Bray, J. H., Adams, G. J., Getz, J. G., & Baer, P. E. (2001). Developmental, family, and
ethnic in influences on adolescent alcohol usage: A growth curve approach.
Journal of Family Psychology, 15, 301-314.
Burns, G. W. (2008, November). Gross natural happiness: Can we have both
psychological and ecological wellbeing? Paper presented at the Fourth GNH
conference, Thimphu, Bhutan.
Buzzell, L., & Chalquist, C. (2009). Ecotherapy: Healing with nature in mind. San
Francisco, CA: Sierra Club.
Campbell, D. T., & Stanley, J. C. (1996). Experimental and quasi-experimental designs
for research. Chicago, IL: McNally.

82
Carek, P. J., Laibstain, S. E., & Care, S. M. (2011). Exercise for the treatment of
depression and anxiety. International Journal of Psychiatry in Medicine, 41(1),
15-28.
Carr, D. S., & Williams, D. R. (1993). Understanding the role of ethnicity in outdoor
recreation experiences. Journal of Leisure Research, 25(1), 22-38.
Carson, R. (1962). Silent spring. Cambridge, MA: Riverside.
Chalquist, C. (2009). Ecotherapy research and a psychology of homecoming. In L.
Buzzell & C. Chalquist (Eds.), Ecotherapy: Healing with nature in mind (pp. 69-
82). San Francisco, CA: Sierra Club.
Clayton, S. (2003). Environmental identity: A conceptual and operational definition. In S.
Clayton & C. Opotow (Eds.), Identity and the natural environment: The
psychological significance of nature (pp. 45-65). Cambridge, MA: MIT Press.
Clean Air Act of 1963, U.S Code 42 C.F.R. § 7401. (1963).
Conn, S. A. (1998). Living in the earth: Ecopsychology, health and psychotherapy. The
Humanistic Psychologist, 26(1-3), 179-198.
Derogatis, L. R. (1994). SCL-90-R administration, scoring, and procedures manual (3rd
ed.). Minneapolis, MN: National Computer Systems.
Derogatis, L. R. (2011). Symptom Checklist-90-Revised. Retrieved from http://psychcorp.
pearsonassessments.com/HAIWEB/Cultures/en-us/Productdetail.htm?
Pid=PAg514
Dunlap, R. E., & VanLiere, K. D. (1978). The new environmental paradigm: A proposed
measuring instrument and preliminary results. The Journal of Environmental
Education, 9, 10-19.
Dunlap, R. E., Van Liere, K. D., Mertig, A. G., & Jones, R. E. (2000). Measuring
endorsement of the new ecological paradigm: A revised NEP scale. Journal of
Social Issues, 56, 425-442.
Eaton, W. W., Kessler, R. C., Wittchen, H. U., & Magee, W. J. (1994). Panic and panic
disorder in the United States. The American Journal of Psychiatry, 151, 413-420.
Eisenberg, D., Hunt, J., Speer, N., & Zivin, K. (2011). Mental health service utilization
among college students in the United States. Journal of Nervous & Mental
Disease, 199, 301-308.

83
Endangered Species Act, 16 U.S.C. § 1531 (1973).
Evans, D. R., & Cope, W. E. (1989). Manual for the quality of life questionnaire.
Toronto, Ontario, Canada: Multi-Health Systems.
Feral, C. H. (1998). The connectedness model and optimal development: Is
ecopsychology the answer to emotional well-being? The Humanistic
Psychologist, 26, 243-274.
Franklin, J., Markarian, M., Frances, R. J., Miller, S. I., & Mack, A. H. (2005). Substance
abuse in minority populations. In R. J. Frances, S. I. Miller, & A. H. Mack (Eds.),
Clinical textbook of addictive disorders (3rd ed., pp. 321-339). New York, NY:
Guilford.
Fredrickson, B. L., & Levenson, R. W. (1998). Positive emotions speed recovery from
the cardiovascular sequelae of negative emotions. Cognition & Emotion, 12(2),
191-220.
Fredrickson, B. L., Mancuso, R. A., Branigan, C., & Tugade, M. M. (2000). The undoing
effect of positive emotions. Motivation & Emotion, 24(4), 237-258.
Frumkin, H. (2001). Beyond toxicity: Human health and the natural environment.
American Journal of Preventive Medicine, 20(3), 234-240.
Garratt, A. M., Ruta, D. A., Abdalla, M. I., Buckingham, J. K., & Russell, I. T. (1993).
The SF 36 health survey questionnaire: an outcome measure suitable for routine
use within the NHS? British Medical Journal, 306, 1440-1444.
Goodwin, R. D., Faravelli, C., Rosi, S., Cosci, F., Truglia, E., de Graaf, R., & Wittchen,
H. U. (2005). The epidemiology of panic disorder and agoraphobia in Europe.
European Neuropsychopharmacology, 15(4), 435-443.
Greenway, R. (1995). The wilderness effect and ecopsychology. In T. Roszak, M. E.
Gomes & A. D. Kanner (Eds.), Ecopsychology: Restoring the earth, healing the
mind (pp. 122-135). San Francisco, CA: Sierra Club Books.
Hawthorne, G., Herman, H., & Murphy, B. (2006). Interpreting the WHOQOL-BREF:
Preliminary population norms and effect sizes. Social Indicators Research, 77(1),
37-59.
Herzog, T. R., Black, A. M., Fountaine, K. A., & Knotts, D. J. (1997). Reflection and
attentional recovery as distinctive benefits of restorative environments. Journal of
Environmental Psychology, 17(2), 165-170.

84
Herzog, T. R., Maguire, C. P., & Nebel, M. B. (2003). Assessing the restorative
components of environments. Journal of Environmental Psychology, 23(2), 159-
170.
Herzog, T. R., & Strevey, S. J. (2008). Contact with nature, sense of humor, and
psychological well-being. Environment & Behavior, 40, 747-776.
Hinds, J., & Sparks, P. (2009). Investigating environmental identity, well-being, and
meaning. Ecopsychology, 1(4), 181-186.
Horowitz, L. M., Rosenberg, S. E., Baer, B. A., Ureno, G., & Villasenor, V. S. (1988).
Inventory of interpersonal problems: Psychometric properties and clinical
applications. Journal of Consulting & Clinical Psychology, 56, 885-892.
Howard, G. S. (1997). Ecological psychology: Creating a more earth-friendly human
nature. Notre Dame, IN: University of Notre Dame Press.
Huang, B., Grant, B. F., Dawson, D. A., Stinson, F. S., Chou, S. P., Saha, T. D., …
Pickering, R. P. (2006). Race-ethnicity and the prevalence and co-occurrence of
Diagnostic and Statistical Manual of Mental Disorders, Fourth Edition, alcohol
and drug use disorders and Axis I and II disorders: United States, 2001 to 2002.
Comprehensive Psychiatry, 47, 252-257.
Huang, I. C., Wu, A. W., & Frangakis, C. (2006). Do the SF-36 and WHOQOL-BREF
measure the same constructs? Evidence from the Taiwan population. Quality of
Life Research: An International Journal of Quality of Life Aspects of Treatment,
Care & Rehabilitation, 15(1), 15-24.
Jarrott, S. E., & Gigliotti, C. M. (2010). Comparing responses to horticultural-based and
traditional activities in dementia care programs. American Journal of Alzheimer's
Disease & Other Dementias, 25, 657-665.
Kaplan, R. (2001). The nature of the view from home: Psychological benefits.
Environment & Behavior, 33, 507-542.
Kaplan, R., & Kaplan, S. (1989). The experience of nature: A psychological perspective.
New York, NY: Cambridge University Press.
Kals, E., Schumacher, D., & Montada, L. (1999). Emotional affinity towards nature as a
motivational basis to protect nature. Environment & Behavior, 31(2), 178-202.
Kellert, S. R. (1993). The biological basis for human values of nature. In S. R. Kellert &
E. O. Wilson (Eds.), The biophilia hypothesis (pp. 31-41). Washington, DC:
Island Press.

85
Kellert, S. R. (2002). Experiencing nature: affective, cognitive, and evaluative
development in children. In P. H. Kahn & S. R. Kellert (Eds.), Children & nature
(pp. 117-152). Cambridge, MA: MIT Press.
Kellert, S. R., & Wilson, E. O. (1993). The biophilia hypothesis. Washington, DC: Island
Press.
Kessler, R. C., Berglund, P., Demler, O., Jin, R., Merikangas, K. R., & Walters, E. E.
(2005). Lifetime prevalence and age-of-onset distributions of DSM-IV disorders
in the National Comorbidity Survey Replication. Archives of General Psychiatry,
62, 593-602.
Klassen, M. (2010). Connectedness to nature: Comparing rural and urban youths'
relationships with nature (Unpublished master’s thesis). Royal Roads University,
Victoria, British Columbia, Canada.
Kosidou, K., Dalman, C., Lundberg, M., Hallqvist, J., Isacsson, G., & Magnusson, C.
(2011). Socioeconomic status and risk of psychological distress and depression in
the Stockholm Public Health Cohort: A population-based study. Journal of
Affective Disorders, 134, 160-167.
LaDuke, W. (2005). Recovering the sacred: the power of naming and claiming.
Cambridge, MA: South End.
Laumann, K., Garling, T., & Stormark, K. M. (2001). Rating scale measures of
restorative components of environments. Journal of Environmental Psychology,
21(1), 31-44.
Lee, S. A., Gibbons, J. A., & Short, S. D. (2010). Sympathetic reactions to the bait dog in
a film of dog fighting: The influence of personality and gender. Society &
Animals: Journal of Human-Animal Studies, 18(2), 107-125.
Leopold, A. (1949). A sand county almanac and sketches here and there. New York, NY:
Oxford University Press.
Liu, Q.-W., Xiao, S.-Y., Cao, H., Xu, H.-L., Zhou, L., & Luo, D. (2009). Relationship
between personality characteristics and quality of life (QOL) in college students
with different extent of internet use. Chinese Mental Health Journal, 23(2), 138-
142.
Louv, R. (2008). Last child in the woods: Saving our children from nature-deficit
disorder. Chapel Hill, NC: Algonquin.

86
Louv, R. (2012). The nature principle: Reconnecting with life in a virtual age. Chapel
Hill, NC: Algonquin.
Lowry, C. A., Hollis, J. H., de Vries, A., Pan, B., Brunet, L. R., Hunt, J. R., … Lightman,
S. L. (2007). Identification of an immune-responsive mesolimbocortical
serotonergic system: Potential role in regulation of emotional behavior.
Neuroscience, 146(2), 756-772.
Lyons, G. C. B., Deane, F. P., Caputi, P., & Kelly, P. J. (2011). Spirituality and the
treatment of substance use disorders: An exploration of forgiveness, resentment
and purpose in life. Addiction Research & Theory, 19, 459-469.
Marcus, B. J., Omoto, A. M., & Winter, P. L. (2011). Environmentalism and community:
Connections and implications for social action. Ecopsychology, 3(1), 1-14.
Mayer, F. S., & Frantz, C. M. (2004). The connectedness to nature scale: A measure of
individuals' feeling in community with nature. Journal of Environmental
Psychology, 24, 503-515.
Mayer, F. S., Frantz, C. M., Bruehlman-Senecal, E., & Dolliver, K. (2009). Why is nature
beneficial? The role of connectedness to nature. Environment & Behavior, 41,
607-643.
McKibben, B. (2006). The end of nature. New York, NY: Random House.
McKibben, B. (2008). Deep economy: Economics as if the world mattered. New York,
NY: St. Martin's Griffin.
Meineri, S. B., Martin, A. L., & Grandjean, I. (2010). The combined effect of the foot-in-
the-door technique and the but you are free technique: An evaluation on the
selective sorting of household wastes. Ecopsychology, 2(4), 231-237.
Moore, E. O. (1981). A prison environment's effect on health care service demands.
Journal of Environmental Systems, 11, 17-34.
Mota-Pereira, J., Silverio, J., Carvalho, S., Ribeiro, J. C., Fonte, D., & Ramos, J. (2011).
Moderate exercise improves depression parameters in treatment-resistant patients
with major depressive disorder. Journal of Psychiatric Research, 45, 1005-1011.
Muller, M. M., Kals, E., & Pansa, R. (2009). Adolescents’ emotional affinity toward
nature: A cross-societal study. The Journal of Developmental Processes, 4(1), 59-
69.

87
Mullersdorf, M., Granstrom, F., Sahlqvist, L., & Tillgren, P. (2010). Aspects of health,
physical/leisure activities, work and socio-demographics associated with pet
ownership in Sweden. Scandinavian Journal of Public Health, 38(1), 53-63.
Myers, R. (1990). Classical and modern regression with applications (2nd ed.). Boston,
MA: Duxbury.
National Environmental Policy Act of 1969, U.S. Code 42 C.F.R. § 4321 (1969).
Nisbet, E. K., & Zelenski, J. M. (2011). Underestimating nearby nature: Affective
forecasting errors obscure the happy path to sustainability. Psychological Science,
22, 1101-1106.
Nisbet, E. K., Zelenski, J. M., & Murphy, S. A. (2009). The Nature Relatedness Scale:
linking individuals' connection with nature to environmental concern and
behavior. Environment & Behavior, 41, 715-740.
Nisbet, E. K., Zelenski, J., & Murphy, S. (2010). Happiness is in our nature: Exploring
nature relatedness as a contributor to subjective well-being. Journal of Happiness
Studies, 12, 303-322.
Palma-Coca, O., Hernandez-Serrato, M., Villalobos-Hernandez, A., Unikel-Santoncini,
C., Olaiz-Fernandez, G., & Bojorquez-Chapela, I. (2011). Association of
socioeconomic status, problem behaviors, and disordered eating in Mexican
adolescents: Results of the Mexican National Health and Nutrition Survey 2006.
Journal of Adolescent Health, 49, 400-406.
Parslow, R. A., Jorm, A. F., Christensen, H., Rodgers, B., & Jacomb, P. (2005). Pet
ownership and health in older adults: Findings from a survey of 2,551
community-based australians aged 60-64. Gerontology, 51(1), 40-47.
Perrin, J. L., & Benassi, V. A. (2009). The connectedness to nature scale: A measure of
emotional connection to nature? Journal of Environmental Psychology, 29, 434-
440.
Rader, S. (2009). Ecopsychology revealed: An empirical look at the benefits of nature
experience for human beings and the world (Unpublished doctoral dissertation).
Alliant International University, Los Angeles, CA.
Raudsepp, M. (2005). Emotional connection to nature: Its socio-psychological correlates
and associations with pro-environmental attitudes and behavior. In B. Martens &
A. G. Keul (Eds.), Designing social innovation: Planning, building, evaluating
(pp. 83-91). Kirkland, WA: Hogrefe & Huber.

88
Rice, J. S., Remy, L. L., Whittlesey, L. A., Simson, S. P., & Straus, M. C. (1998).
Substance abuse, offender rehabilitation, and horticultural therapy practice. In
Horticulture as therapy: Principles and practice (pp. 257-284). New York, NY:
Haworth.
Roszak, T., Gomes, M. E., & Kanner, A. D. (1995). Ecopsychology: Restoring the earth,
healing the mind. San Francisco, CA: Sierra Club Books.
Russell, K. (2003). An assessment of outcomes in outdoor behavioral healthcare
treatment. Child & Youth Care Forum, 32, 355-381.
Russell, K. (2005). Two years later: A qualitative assessment of youth well-being and the
role of aftercare in outdoor behavioral healthcare treatment. Child & Youth Care
Forum, 34, 209-239.
Russell, K. C. (2010). An exploratory study of a wilderness adventure program for young
offenders. Ecopsychology, 2(4), 221-229.
Russell, K. C., & Phillips-Miller, D. (2002). Perspectives on the wilderness therapy
process and its relation to outcome. Child & Youth Care Forum, 31, 415-437.
Schultz, P. W. (2000). Empathizing with nature: The effects of perspective taking on
concern for environmental issues. Journal of Social Issues, 56, 391-406.
Schultz, P. W. (2001). The structure of environmental concern: Concern for self, other
people, and the biosphere. Journal of Environmental Psychology, 21, 327-339.
Schultz, P. W. (2002). Inclusion with nature: The psychology of human-nature relations.
In P. Schmuck & P. W. Schultz (Eds.), Psychology of sustainable development
(pp. 61-78). Dordrecht, The Netherlands: Kluwer Academic Publishers.
Serpell, J. (1991). Beneficial effects of pet ownership on some aspects of human health
and behaviour. Journal of the Royal Society of Medicine, 84, 717-720.
Siegel, J. M. (1990). Stressful life events and use of physician services among the elderly:
The moderating role of pet ownership. Journal of Personality & Social
Psychology, 58(6), 1081-1086.
Siegel, J. M., Angulo, F. J., Detels, R., Wesch, J., & Mullen, A. (1999). AIDS diagnosis
and depression in the Multicenter AIDS Cohort Study: The ameliorating impact
of pet ownership. AIDS Care, 11(2), 157-170.

89
von Steinbachel, N., Lischetzke, T., Gurny, M., & Eid, M. (2006). Assessing qualify of
life in older people: Psychometric properties of the WHOQOL-BREF. European
Journal of Ageing, 3(2), 116-122.
Stern, P. C., & Dietz, T. (1994). The value basis of environmental concern. Journal of
Social Issues, 50(3), 65-84.
Strohle, A. (2009). Physical activity, exercise, depression and anxiety disorders. Journal
of Neural Transmission, 116(6), 777-784.
Thompson, S. C. G., & Barton, M. A. (1994). Ecocentric and anthropocentric attitudes
toward the environment. Journal of Environmental Psychology, 14(2), 149-157.
Trompenaars, F., Masthoff, E., Heck, G., Hodiamont, P., & Vries, J. (2005). Content
validity, construct validity, and reliability of the WHOQOL-BREF in a population
of Dutch adult psychiatric outpatients. Quality of Life Research, 14(1), 151-160.
Trompenaars, F. J., Masthoff, E. D., Van Heck, G. L., Hodiamont, P. P., & De Vries, J.
(2006). Relationship between mood related disorders and quality of life in a
population of Dutch adult psychiatric outpatients. Depression & Anxiety 23, 353-
363.
Turner-Bowker, D. M., Bartley, P. J., & Ware, J. E. J. (2002). SF-36® Health Survey &
“SF” bibliography: Third Edition (1988-2000). Lincoln, RI: QualityMetric.
Ulrich, R. S. (1984). View through a window may influence recovery from surgery.
Science, 224, 420-421.
Ventegodt, S. R., Flensborg-Madsen, T., Andersen, N. J. R., Nielsen, M., Mohammed,
M., & Merrick, J. (2005). Global quality of life (QOL), health and ability are
primarily determined by our consciousness. Research findings from Denmark
1991-2004. Social Indicators Research, 71(1), 87-122.
Walker, G. J., Deng, J., & Dieser, R. B. (2001). Ethnicity, acculturation, self-construal,
and motivations for outdoor recreation. Leisure Sciences, 23(4), 263-283.
Wang, W.-C., Kao, C.-H., Huan, T.-C., & Wu, C.-C. (2011). Free time management
contributes to better quality of life: A study of undergraduate students in Taiwan.
Journal of Happiness Studies, 12, 561-573.
Waraich, P., Goldner, E. M., Somers, J. M., & Hsu, L. (2004). Prevalence and incidence
studies of mood disorders: A systematic review of the literature. The Canadian
Journal of Psychiatry / La Revue canadienne de psychiatrie, 49(2), 124-138.

90
Ware, J. E., Jr., & Sherbourne, C. D. (1992). The MOS 36-item short-form health survey
(SF-36). I. Conceptual framework and item selection. Medical Care, 30, 473-483.
Weich, S., Twigg, L., & Lewis, G. (2006). Rural/non-rural differences in rates of
common mental disorders in Britain: Prospective multilevel cohort study. British
Journal of Psychiatry, 188(1), 51-57.
WHOQOL Group, The. (1998). The World Health Organization Quality of Life
Assessment (WHOQOL): Development and general psychometric properties.
Social Science Medicine, 46, 1569-1585.
Wilson, E. O. (1984). Biophilia: The human bond with other species. Cambridge, MA:
Harvard University Press.
World Health Organization. (1993). Study protocol for the World Health Organization
project to develop a Quality of Life assessment instrument (WHOQOL). Geneva,
Switzerland: Author.
World Health Organization. (1997). WHOQOL: Measuring quality of life. Retrieved from
http://www.who.int/mental_health/media/68.pdf
World Health Organization. (2011). Mental health evidence and research. Retrieved
from http://www.who.int/mental_health/resources/evidence_research/en/
index.html
Zelezny, L. C., Chua, P., & Aldrich, C. (2000). Elaborating on gender differences in
environmentalism. Journal of Social Issues, 56, 443-457.

91
APPENDICES

92
Appendix A
Letter of Information

93
LETTER OF INFORMATION
Attitudes Toward Nature and Well-Being
Introduction/ Purpose Peter Tauber along with Professor Gayle Morse in the
Department of Psychology at Utah State University is conducting a research study to find
out more about attitudes related to connectedness to nature and well-being. You have
been asked to take part because of your current enrollment in this course (PSY 1010,
ENGL 1010, or FCHD 2400). There will be approximately 250 participants at this site.
There will be approximately 250 total participants in this research.
Procedures If you agree to participate in this research study, you will be asked to
complete the attached survey about your attitudes toward nature, quality of life, and well-
being. You may answer only the questions you feel comfortable answering, and you may
stop at any time. There is no penalty for withdrawing. Please do not put your name or
any other identifying information on the survey. The survey should take
approximately 20 to 30 minutes to complete. When the survey is complete, please return
it to the designated administrator.
Risks The risks involved in your participation in this research are no greater than what
you may experience in everyday life. There may be some discomfort answering some of
the survey questions. These surveys ask questions about some demographic
characteristics such as age, education, and strength of spiritual beliefs. Another survey
has questions related to quality of life and another asks questions about general
psychological well-being related to connectedness to nature. If you feel uncomfortable
with these questions at any time you may withdraw participation.
Benefits As a participant, you may derive an immediate benefit from an increased level
of self-awareness regarding your own attitudes and well-being. Or, there may be no
immediate direct benefit to you. The investigator will benefit from an increased
awareness of the relationship between peoples’ attitudes and levels of well-being.
Additionally, this research will serve to contribute towards the researcher’s professional
goals. In the future, this information may be used directly or indirectly to improve
individuals’ well-being.
Payment/Compensation If you are a student of Psychology 1010, you will receive
course credit for your participation. Students of ENGL 1010 and FCHD 2400 receive
course credit at the discretion of their instructor.
Explanation & offer to answer questions This letter of information serves as a brief
explanation of this study. However, if you have any questions or research-related
problems, you may reach Peter Tauber at (435) 797- 1466 or
peter.tauber@aggiemail.usu.edu

94
Voluntary nature of participation and right to withdraw without consequence
Participation in research is entirely voluntary. You may refuse to participate or withdraw
at any time without consequence or loss of benefits. You may be withdrawn from this
study without your consent by the investigator if it appears that the study is causing you
physical, mental, or emotional harm. If you withdraw before the study’s completion, you
will still receive credit for your participation.
Confidentiality This is an anonymous survey. Research records will be kept confidential,
consistent with federal and state regulations. Records will be maintained in a locked file
in a locked room.
IRB Approval Statement The Institutional Review Board for the protection of human
participants at Utah State University has approved this research study. If you have any
questions or concerns about your rights or a research-related injury and would like to
contact someone other than the research team, you may contact the IRB Administrator at
(435) 797-0567 or email irb@usu.edu to obtain information or to offer input.
Copy of Letter of Information If you would like a copy of this Letter of Information for
your records, you may keep this copy.
Investigator Statement “Through this letter, the research study has been explained to the
individual, including the nature and purpose and the possible risks and benefits associated
with taking part in this research study. Any questions that have been raised have been
answered.”
Signature of Researcher(s)
_______________________________
Gayle Morse
Principal Investigator
(435)797-5547
Gayle.Morse@usu.edu
______________________________
Peter Tauber
Student Researcher
(435)797-1466
peter.tauber@aggiemail.usu.edu

95
Appendix B
Demographic Questionnaire

96
Demographic Questionnaire
1. How old are you today (years)? ___________
2. What is your Sex? (circle one)
0 = Male
1 = Female
3. How would you classify the area where you were raised as a child? (circle one)
1 = Rural
2 = Suburban
3 = Urban
4. How would you classify your ethnicity? (circle all that apply)
1 = American Indian or Alaska Native
2 = Asian/Asian American
3 = Black/ African American
4 = Hispanic
5 = Native Hawaiian or Other Pacific Islander
6 = White
8 = Other (specify)_____________________
5. Are you currently employed? (circle one)
1 = Yes, full-time 2 = Yes, part-time
3 = Yes, Seasonally
4 = No, I choose not to work at this time 5 = No, I cannot find suitable employment
6 = No, I am retired
6. What is your parents’ combined annual income? (circle one)
1 = $15k or less 2 = $15k-$25k
3 = $25k-$35k
4 = $35k-$45k
5 = $45k-$55k 6 = $55k- $65k
7 = $65k- $75k
8 = $75k- $100k
9 = $100k +
7. How would you classify your religious beliefs? ________________________
8. How much do your spiritual and/or religious beliefs influence your daily life?
1
2
3
4
5
Not at all
Somewhat
Extremely
9. How often do you exercise in a natural setting?
1
2
3
4
5
Never
Sometimes
Very Often
10. How often do you exercise in general?
1
2
3
Never
Sometimes
4
5
Very Often
11. Are you a dog owner?
Yes
No
12. Do you own any pet at all?
Yes
No
13. Who is your instructor for this class? _____________________

97
Appendix C
Nature Relatedness Scale
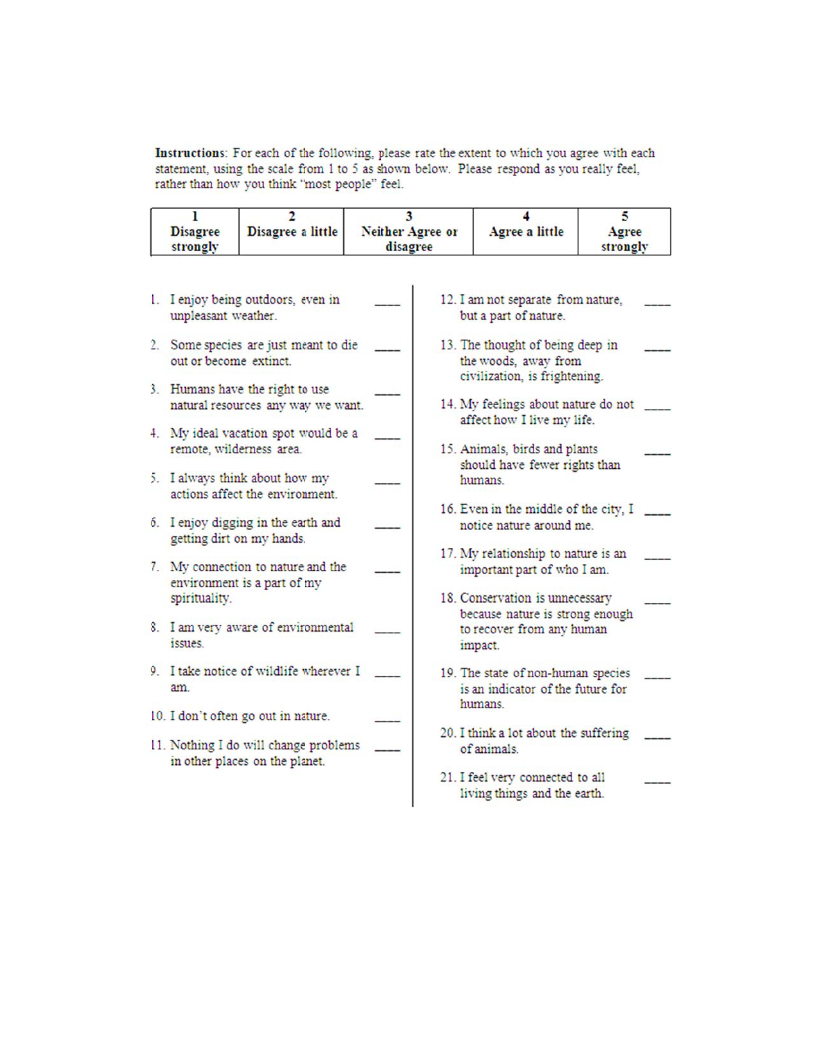
98

99
Appendix D
WHOQOL-BREF
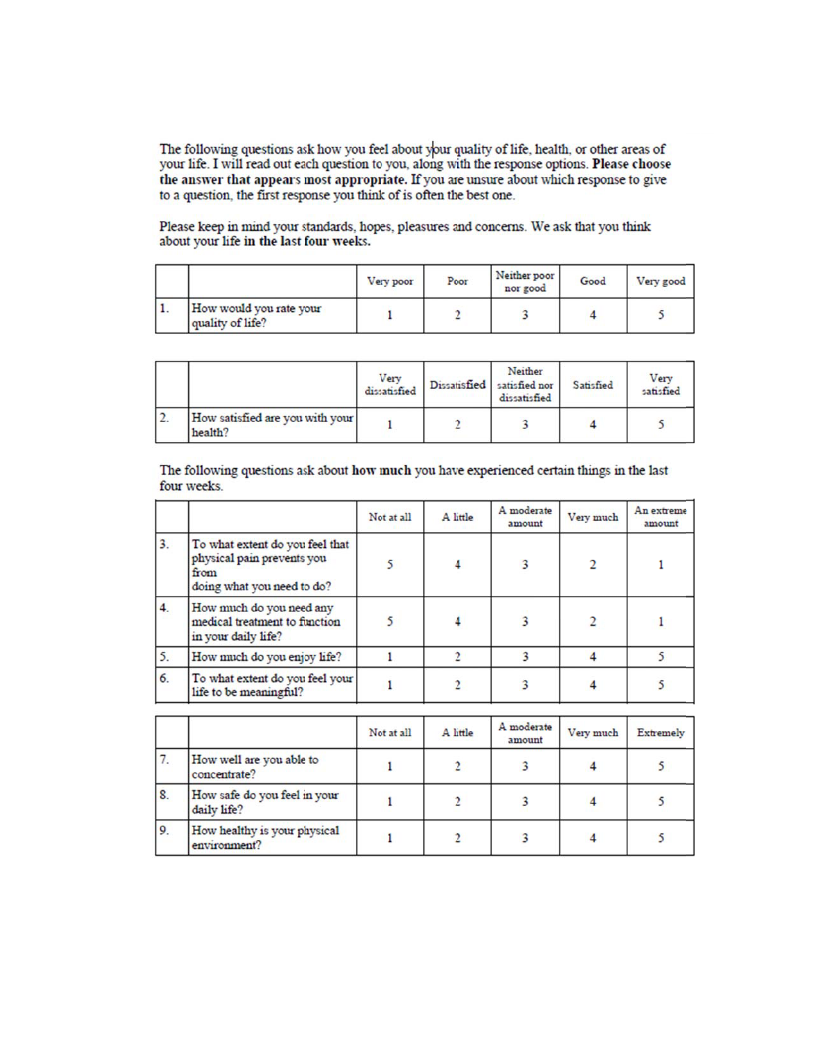
100
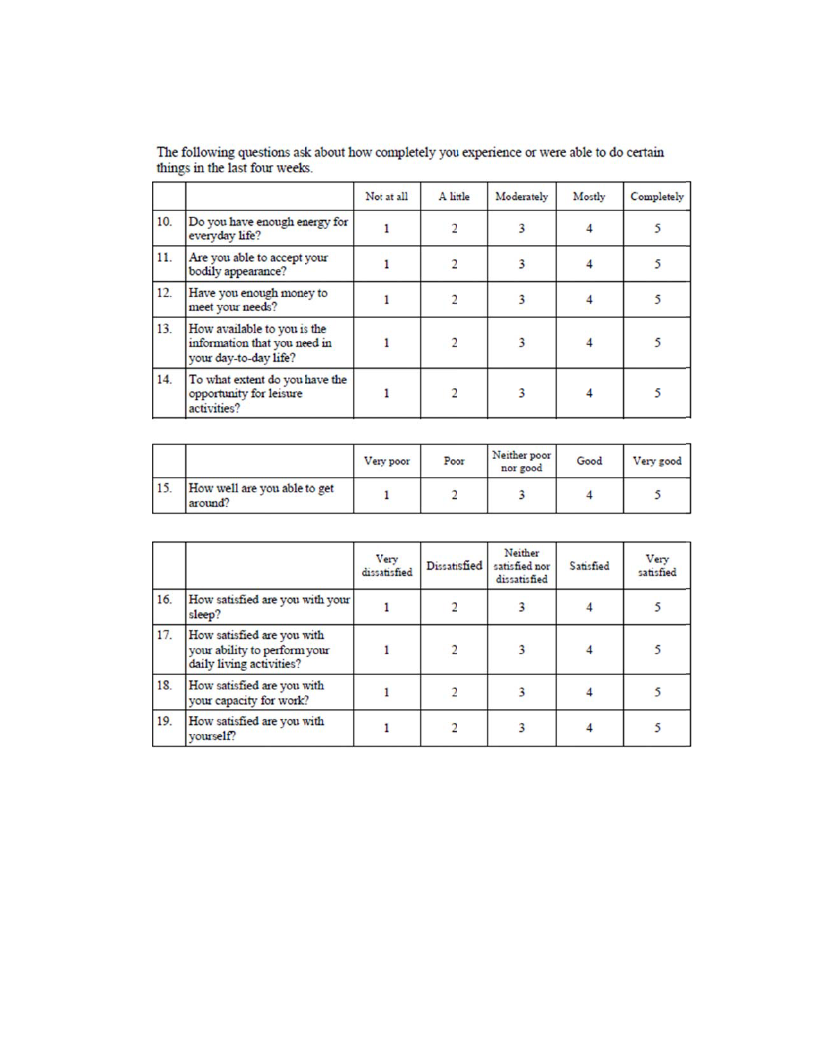
101
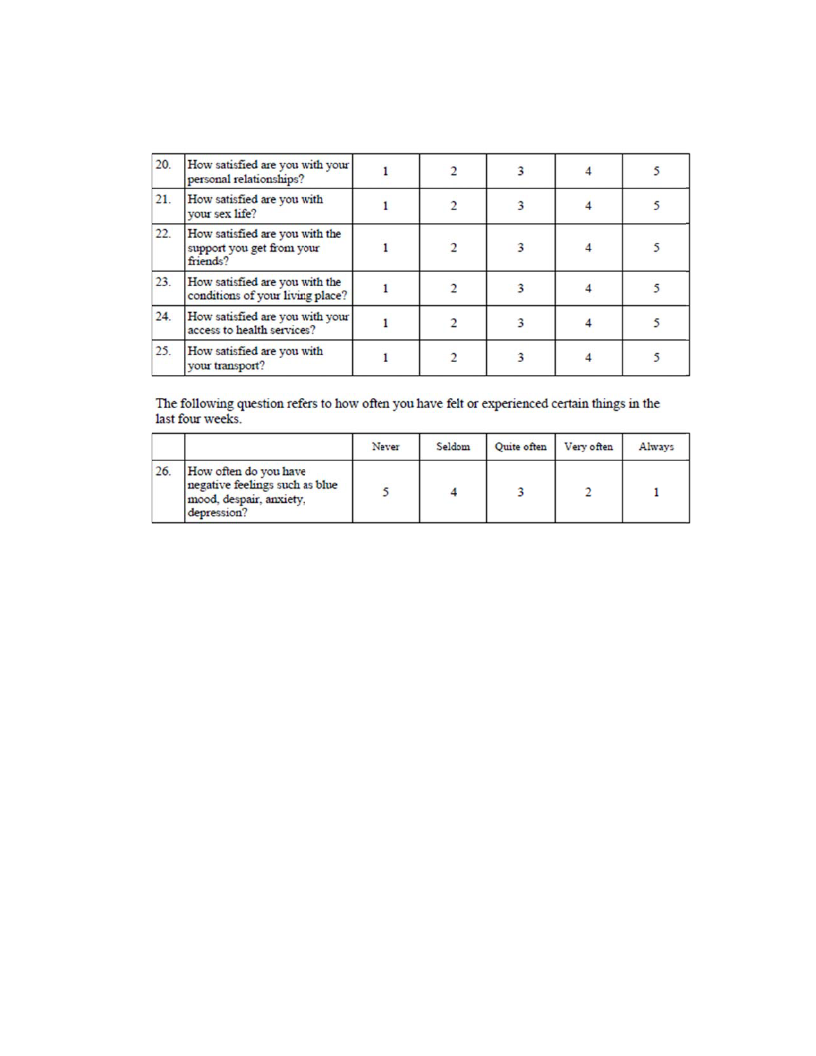
102

103
Appendix E
Histograms for Distribution of NR Scale Scores
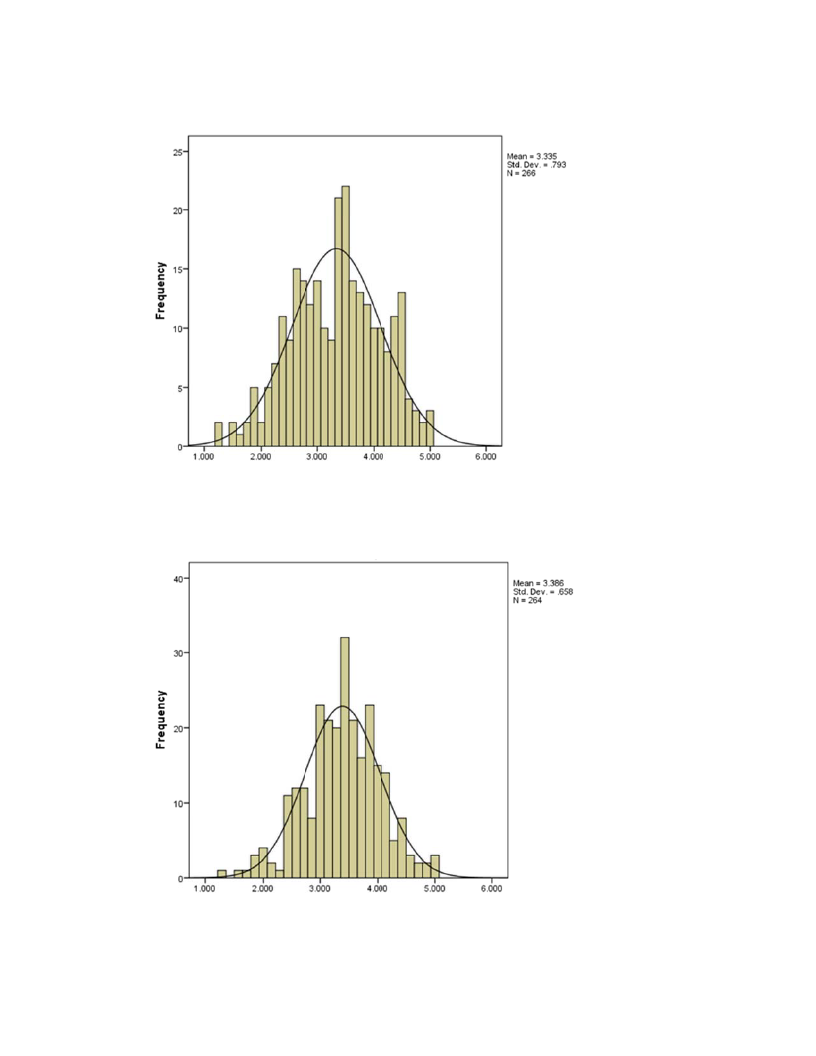
104
Figure E-1. Distribution of NR “self” scale scores.
Figure E-2. Distribution of NR “perspective” scale scores.
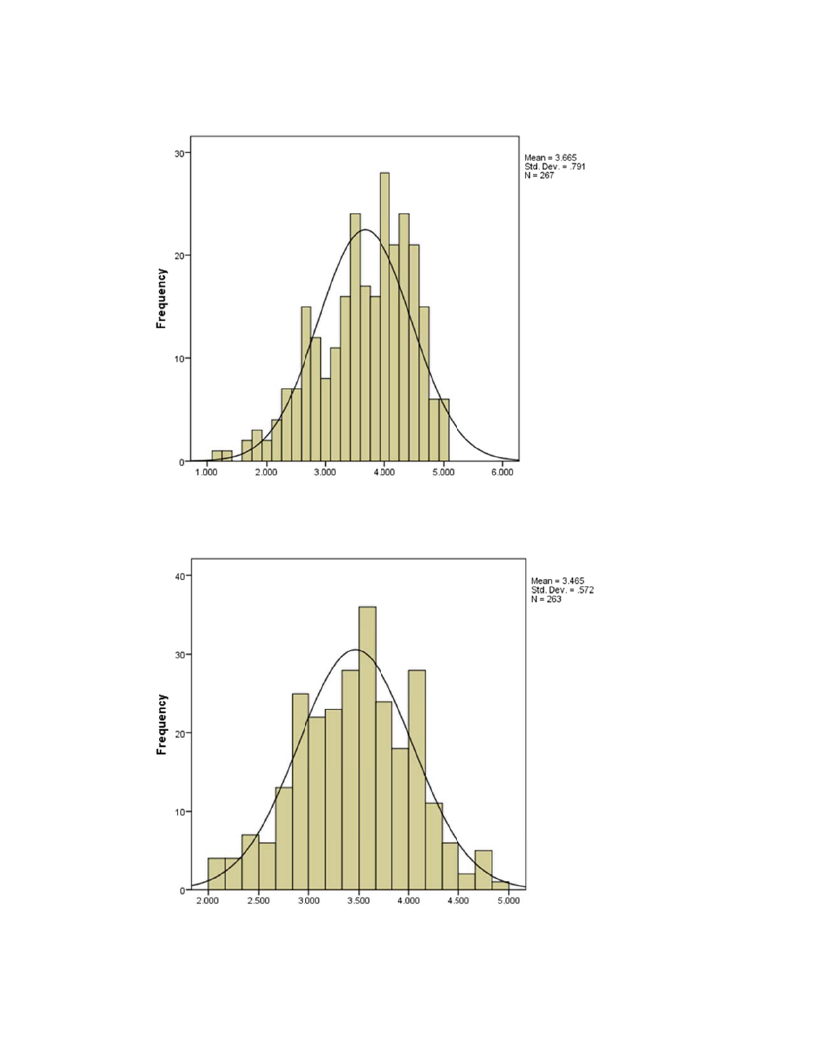
105
Figure E-3. Distribution of NR “experience” scale scores.
Figure E-4. Distribution of NR “overall” scale scores.

106
Appendix F
Histograms for Distribution of WHOQOL Scale Scores
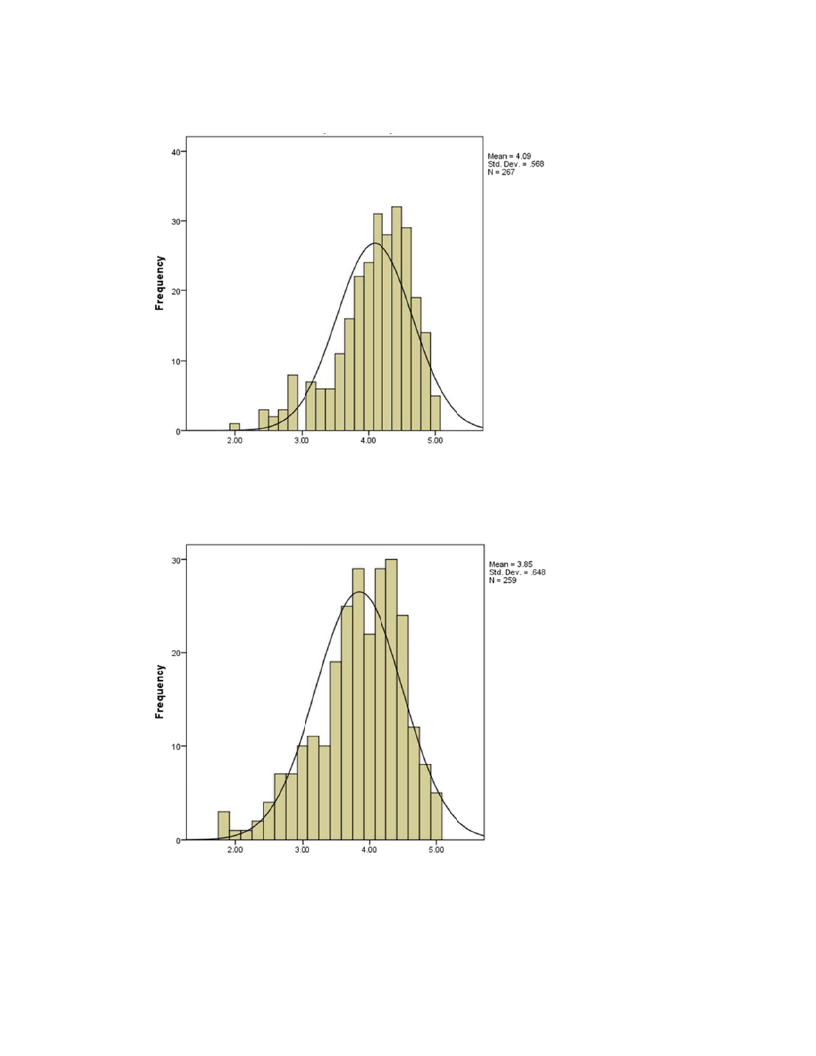
107
Figure F-1. Distribution of WHOQOL “physical” scale scores.
Figure F-2. Distribution of WHOQOL “psychological” scale scores.
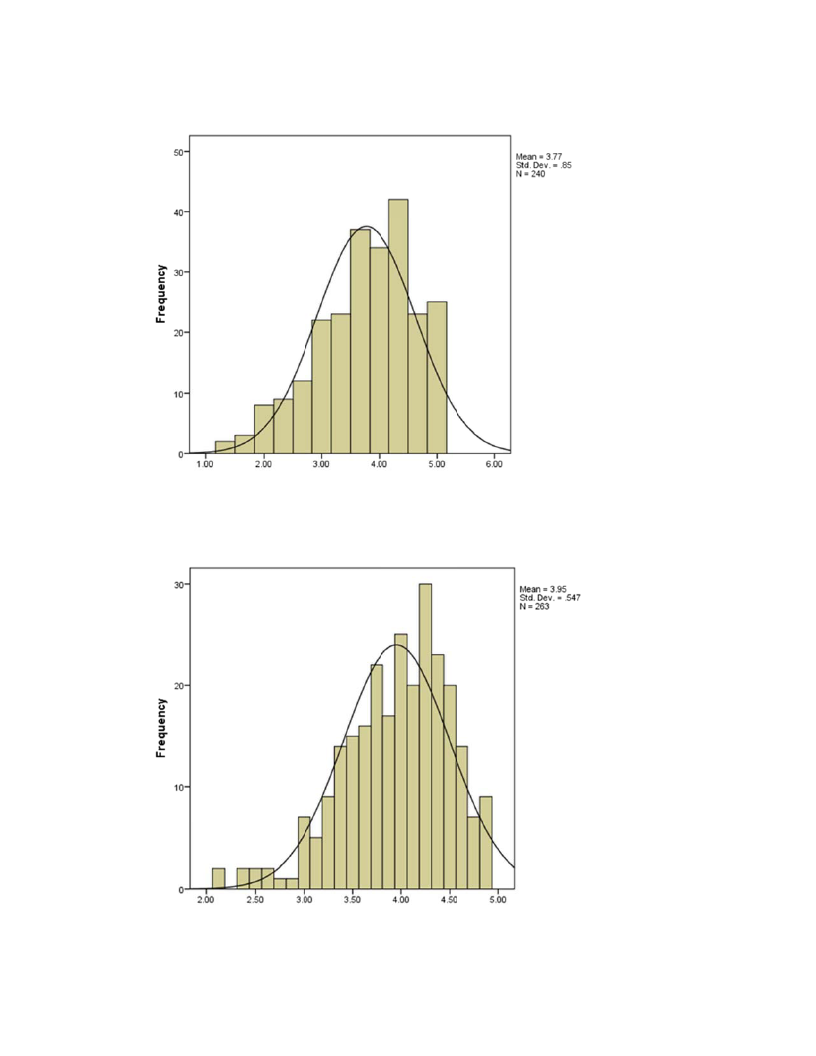
108
Figure F-3. Distribution of WHOQOL “social relationships” scale scores.
Figure F-4. Distribution of WHOQOL “environment” scale scores.
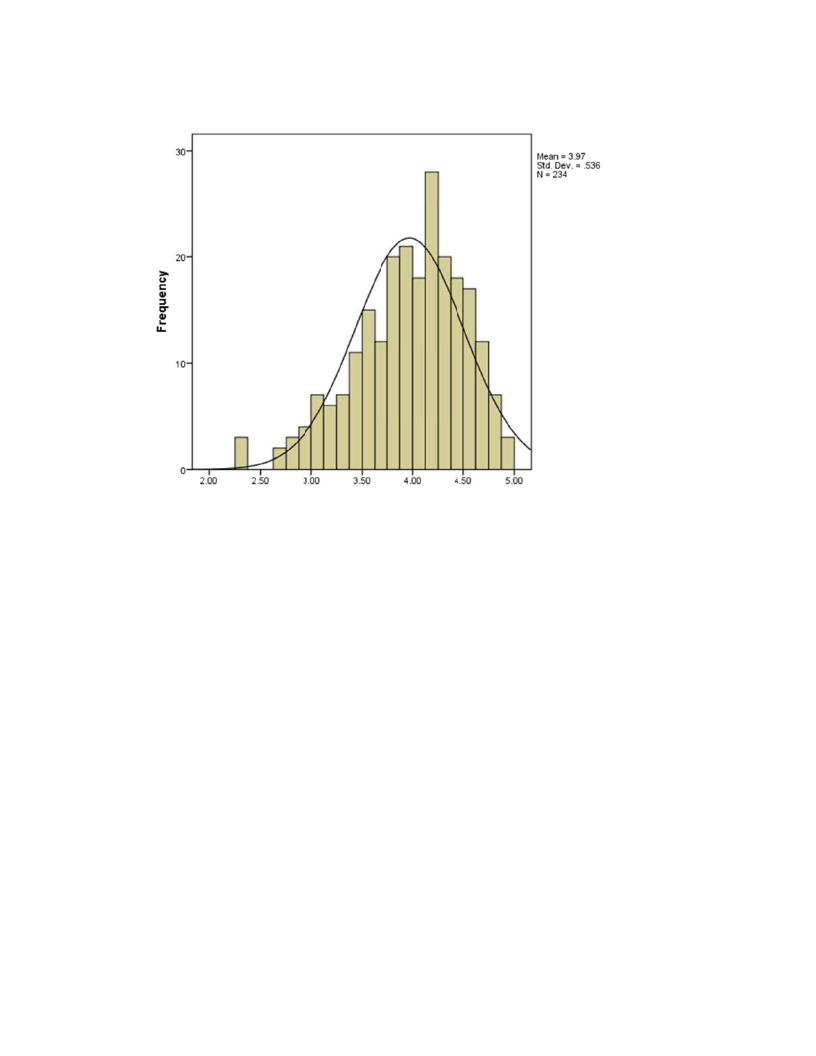
109
Figure F-5. Distribution of WHOQOL “overall” scale scores.

110
Appendix G
Histograms for Distribution of SCL-90 Scale Scores
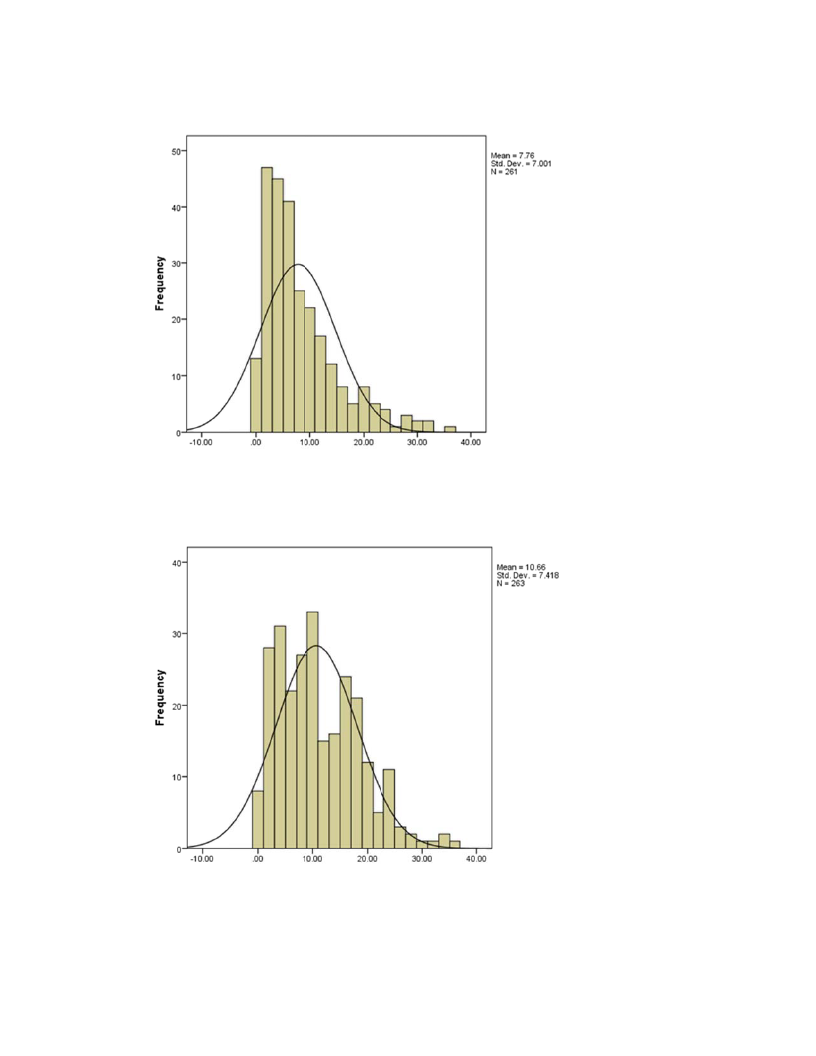
111
Figure G-1. Distribution of SCL-90 “somatization” scale scores.
Figure G-2. Distribution of SCL-90 “obsessive-compulsive” scale scores.
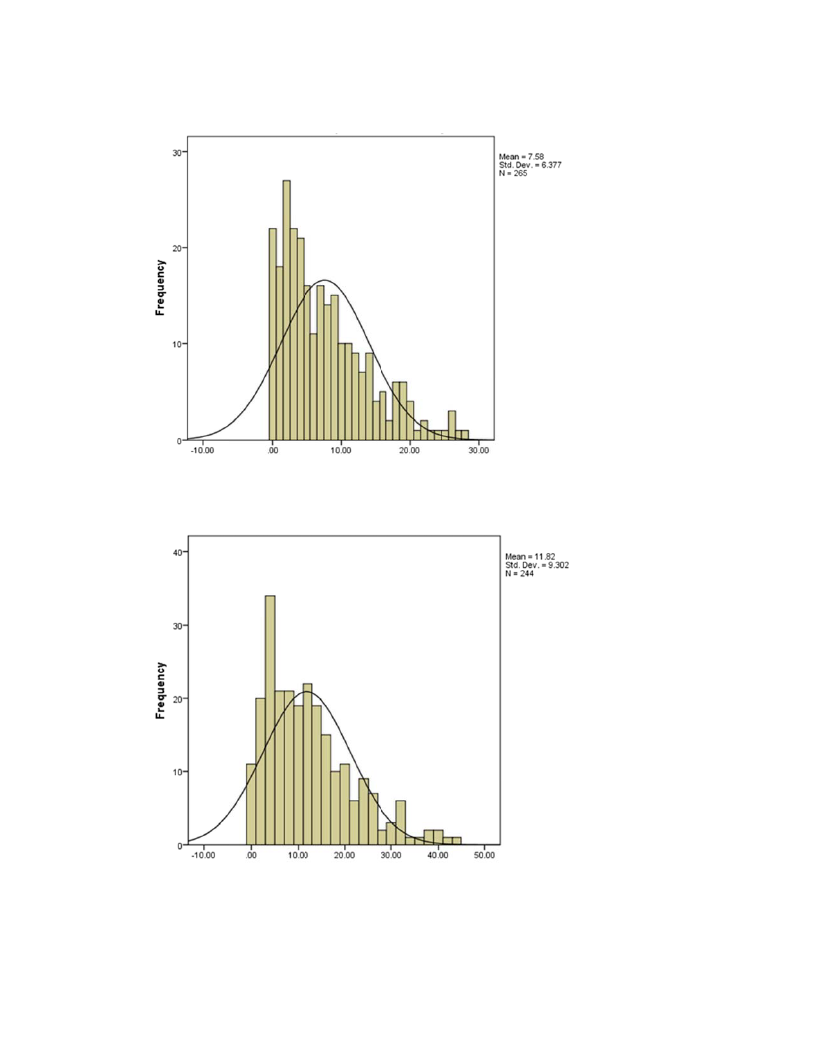
112
Figure G-3. Distribution of SCL-90 “interpersonal sensitivity” scale scores.
Figure G-4. Distribution of SCL-90 “depression” scale scores.
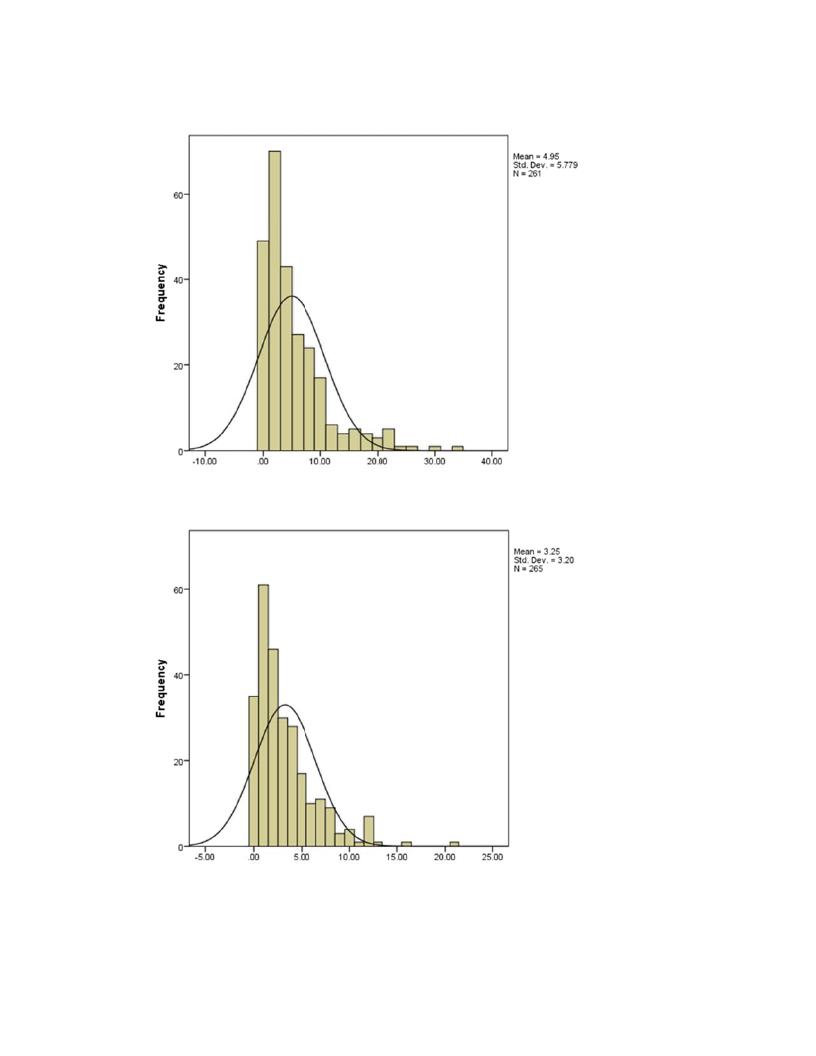
113
Figure G-5. Distribution of SCL-90 “anxiety” scale scores.
Figure G-6. Distribution of SCL-90 “hostility” scale scores.
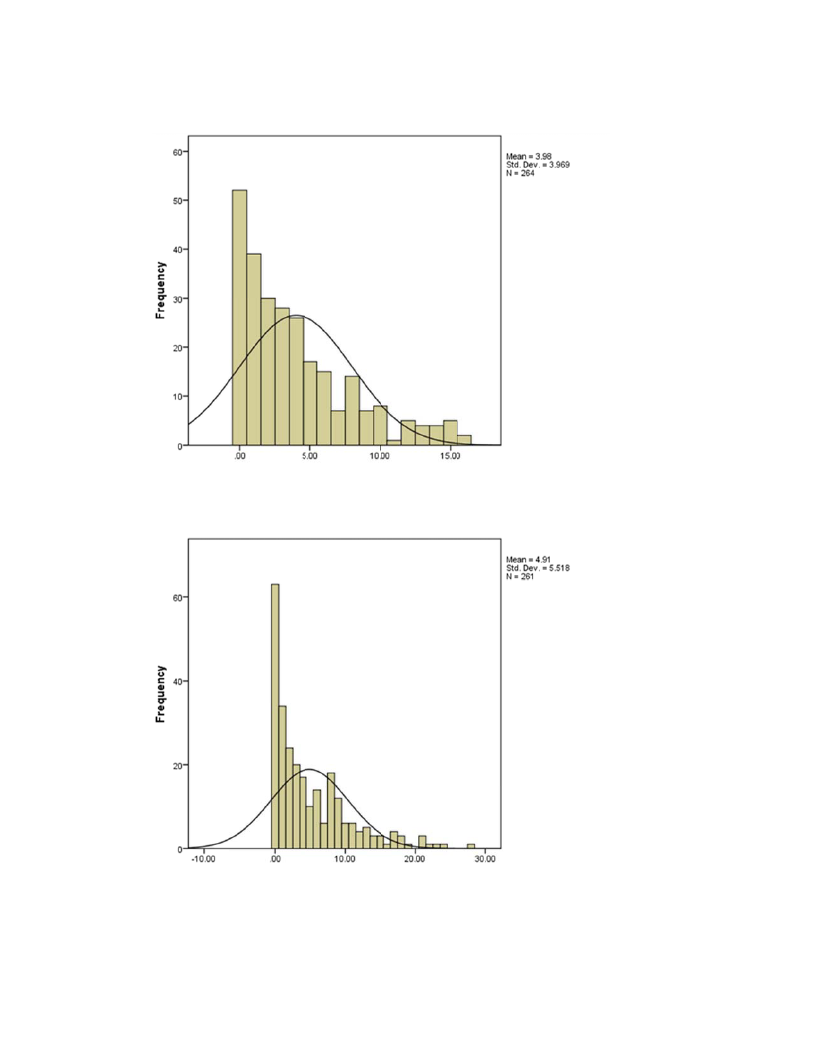
114
Figure G-7. Distribution of SCL-90 “paranoid ideation” scale scores.
Figure G-8. Distribution of SCL-90 “psychoticism” scale scores.
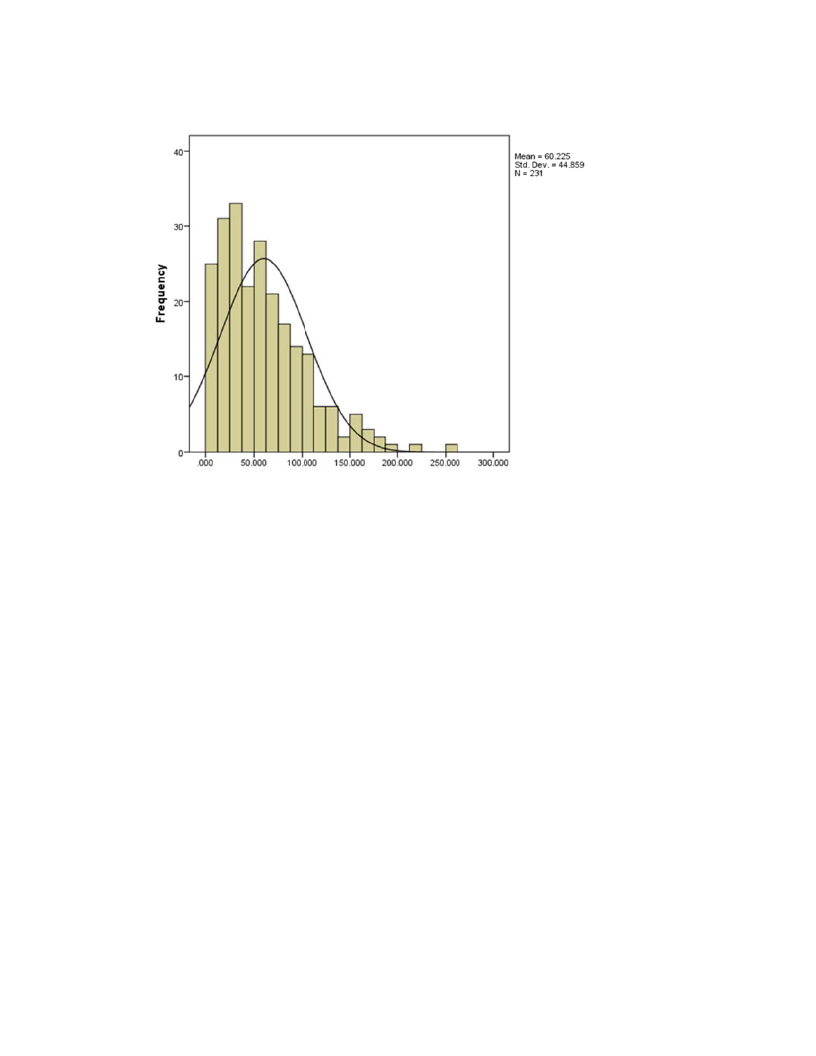
115
Figure G-9. Distribution of SCL-90 “global severity index” scale scores.