

International Journal of
Environmental Research
and Public Health
Article
Temporal and Spatial Variability of Volatile Organic
Compounds in the Forest Atmosphere
Francesco Meneguzzo 1,2,* , Lorenzo Albanese 1, Giorgio Bartolini 3 and Federica Zabini 1,*
1 Institute for Bioeconomy, National Research Council, 10 Via Madonna del Piano,
I-50019 Sesto Fiorentino (FI), Italy; lorenzo.albanese@ibe.cnr.it
2 “Fiorenzo Gei” Scientific Committee, Italian Alpine Club, 2 Via del Mezzetta, I-50135 Firenze (FI), Italy
3 Laboratory of Monitoring and Environmental Modelling for the Sustainable Development (LaMMA
Consortium), Via Madonna del Piano 10, 50019 Sesto Fiorentino, Italy; bartolini@lamma.rete.toscana.it
* Correspondence: francesco.meneguzzo@ibe.cnr.it (F.M.); federica.zabini@ibe.cnr.it (F.Z.);
Tel.: +39-392-985-0002 (F.M.); +39-333-379-2947 (F.Z.)
Received: 20 November 2019; Accepted: 3 December 2019; Published: 5 December 2019
Abstract: The healing effects of the forest are increasingly being valued for their contribution to
human psychological and physiological health, motivating further advances aimed at improving
knowledge of relevant forest resources. Biogenic volatile organic compounds, emitted by the plants
and accumulating in the forest atmosphere, are essential contributors to the healing effects of the
forest, and represent the focus of this study. Using a photoionization detector, we investigated the
high frequency variability, in time and space, of the concentration of total volatile organic compounds
on a hilly site as well as along forest paths and long hiking trails in the Italian northern Apennines. The
scale of concentration variability was found to be comparable to absolute concentration levels within
time scales of less than one hour and spatial scales of several hundred meters. During daylight hours,
on clear and calm days, the concentration peaked from noon to early afternoon, followed by early
morning, with the lowest levels in the late afternoon. These results were related to meteorological
variables including the atmospheric vertical stability profile. Moreover, preliminary evidence pointed
to higher concentrations of volatile organic compounds in forests dominated by conifer trees in
comparison to pure beech forests.
Keywords: bioactive compounds; forest air; forest bathing; forest therapy; hiking trails; human
health; monoterpenes; stress; volatile organic compounds
1. Introduction
In recent years, attention has continued to grow with respect to the use of the forest environment
for health purposes [1]. Plenty of recent evidence supports the value attributed to forest bathing, or
forest therapy, derived from the Japanese Shinrin-Yoku, a kind of forest recreation traditionally practiced
for improving physical and mental health and as a remedy for stress [2].
Significant positive effects on mental health, especially in people with depressive tendencies,
were demonstrated by psychological analyses and physiological measurements, showing remarkable
improvements in mood and depressive symptoms [3–5], a decrease in anxiety and stress levels [6–8],
and a decreased risk of psychosocial stress-related diseases [9–11]. On the physiological side, the forest
environment showed anti-hypertensive effects [10,12,13], promoted the regularization of the heart rate
variability [14–16], increased the numerosity and activity of human natural killer cells [17–19], and
induced the decrease of the blood glucose levels in diabetic patients [20].
Based on the above-mentioned health effects, forest therapy has been attributed a specific
role in medical prevention. Healthcare programs based on forest therapy have been developed in
Int. J. Environ. Res. Public Health 2019, 16, 4915; doi:10.3390/ijerph16244915
www.mdpi.com/journal/ijerph

Int. J. Environ. Res. Public Health 2019, 16, 4915
2 of 24
some countries [21] and have recently been recommended on a large scale, with a sound economic
foundation [22].
Among several factors able to trigger physiological activation in the forest environment, the
inhalation of aromatic volatile substances, i.e., biogenic volatile organic compounds (BVOCs), plays an
important role [17]. BVOCs, as low-molecular-weight compounds [23]„ are emitted by plant parts
above and below the ground, as well as by leaf litter, soil microbes, and insects, and show important
functions for protection, defense, and communication among plants as well as between plants and
other organisms [24]. All plant organs from flowers to roots can generate and release BVOCs [25], with
leaves generally producing the highest emission rates [26].
Volatile terpenes represent most of the BVOC emissions in the forest environment, such as
isoprene (which accounts for about 50% of the global emitted BVOCs per year), and monoterpenes
(MTs, consisting of two isoprene units and accounting for about 15%) [27]. Thus, isoprene and MTs
represent the major components of forest aerosols [26].
Based on decades of studies, reliable catalogues of the BVOC emission potential of leaves and
needles of major European forest tree species are nowadays available. Notably, trees able to store MTs,
such as conifer species, are not necessarily the highest potential emitters, with deciduous trees typical
of mountainous forests in European temperate areas, such as beech (Fagus sylvatica) and chestnut
(Castanea sativa), potentially greatly exceeding widespread conifer species such as Norway spruce (Picea
abies) and silver fir (Abies alba) [28]. However, some studies showed that conifers can be important
emitters of their respective typical MTs, among which α-pinene and d-limonene often stand out, which
are endowed with recognized and important biological activities [29].
Beyond the large differences among forest tree species, the study of the variability of BVOC
emission rates is hindered by their high reactivity with other compounds in the atmosphere, and by
the high variability of biosynthesis and emission mechanisms, leading to remarkable intraspecific
differences in terpene emission with regard to both total emissions and chemical profile [30]. Emission
rates from leaves depend on several factors, such as physiological (age and developmental stage of plant)
and physicochemical aspects (i.e., related to temperature, stomatal openness, and leaf structure) [31].
Temperature and light (radiation) were shown to be key environmental mechanisms for the
synthesis and emission of BVOCs. Generally, isoprene emission is high dependent on light as well
as on temperature due to its high volatility [31]. MT emission may show different sensitivity to light
and temperature, also depending on the presence or absence of storage structures [32]. In plants with
BVOC storage compartments, the emissions are basically temperature-dependent because temperature
is able to volatilize compounds from stored pools, whereas in plants not storing BVOCs the emission
rate is light and temperature-dependent [33,34]. Temperature variability affects also the VOC fluxes
from the forest floor [35].
A recent study performed by Korea’s National Center for Forest Therapy focused on the variability
of BVOCs concentration in the atmosphere of a Pinus densiflora forest, on a fixed site, during daylight
hours (one-hour measurements starting at 08:00 am, 12:00 pm, and 17:00 pm), and once a month for a
year [36]. The study was motivated by the consideration of BVOCs as an important resource in forest
therapy due to their wide-spectrum healing effects, and was carried out by means of absorbent tubes
and subsequent desorption and gas chromatographic analysis.
A remarkable seasonal variability was found, with the concentration of total BVOCs being highest
in summer, followed by spring and fall, and lowest in winter. In summer, the relative concentration of
α-pinene was also the highest, showing that not only total BVOCs but also individual components may
change seasonally. On a daily basis, BVOC concentrations were found to increase from 08:00–09:00 am
to 12:00–13:00 pm, and again, marginally, up to 17:00 pm, in contrast to previous studies which found
higher concentrations at sunrise and sunset. However, admittedly, the discrete sampling prevented
drawing definitive conclusions.
This study presents the results of a few high-frequency monitoring campaigns of total volatile
organic compound (TVOC) concentrations both on fixed sites and along paths (a forest path and

Int. J. Environ. Res. Public Health 2019, 16, 4915
3 of 24
few hiking trails) far from anthropogenic sources, with each campaign carried out for several hours
during daylight. Beyond the representativeness of the measurements of TVOCs with regard to
BVOCs, such relative remoteness was deemed to minimize the reaction of terpenes with anthropogenic
pollutants that, in contaminated environments such as urban forests, might enhance photochemical
pollution [30], possibly offsetting the BVOC-related health benefits. No other previous studies
investigated the variability of the concentration of TVOCs or BVOCs, in the forest air with such
temporal and spatial detail, let alone along long paths (tens of km), spanning different elevations,
climates, and forest compositions.
2. Materials and Methods
2.1. Measurement of Volatile Organic Compounds
TVOCs in the forest atmosphere were measured by means of a portable (0.72 kg) photoionization
detector (PID, model Tiger VOC detector, Ion Science Ltd., Fowlmere, Royston, UK), with detection
limits from 0.001 ppm (1 ppb) to 20,000 ppb. The PID was equipped with a pump, aspiring the
ambient air at a rate of 220 mL/min, and an ultraviolet, 10.6 eV lamp allowing the ionization of organic
substances in the aspired air, including all the MTs found in BVOCs. The resulting electric current
flowing between two electrodes was measured and amplified, and transformed into a concentration
level of the ionized substance or group of substances.
Factory calibration was performed at the temperature of 21.5 ± 0.1 ◦C and atmospheric pressure
with respect to the substance isobutylene, with an estimated measurement uncertainty of ±2%. The
concentration of other substances was derived after the application of a response factor that, for TVOC,
was equal to 1. While practically immediate, this detection method did not allow the identification
of single compounds in TVOCs, which would require a gas chromatograph. This issue is discussed
further in Section 4.
2.2. Study Sites and Weather Stations
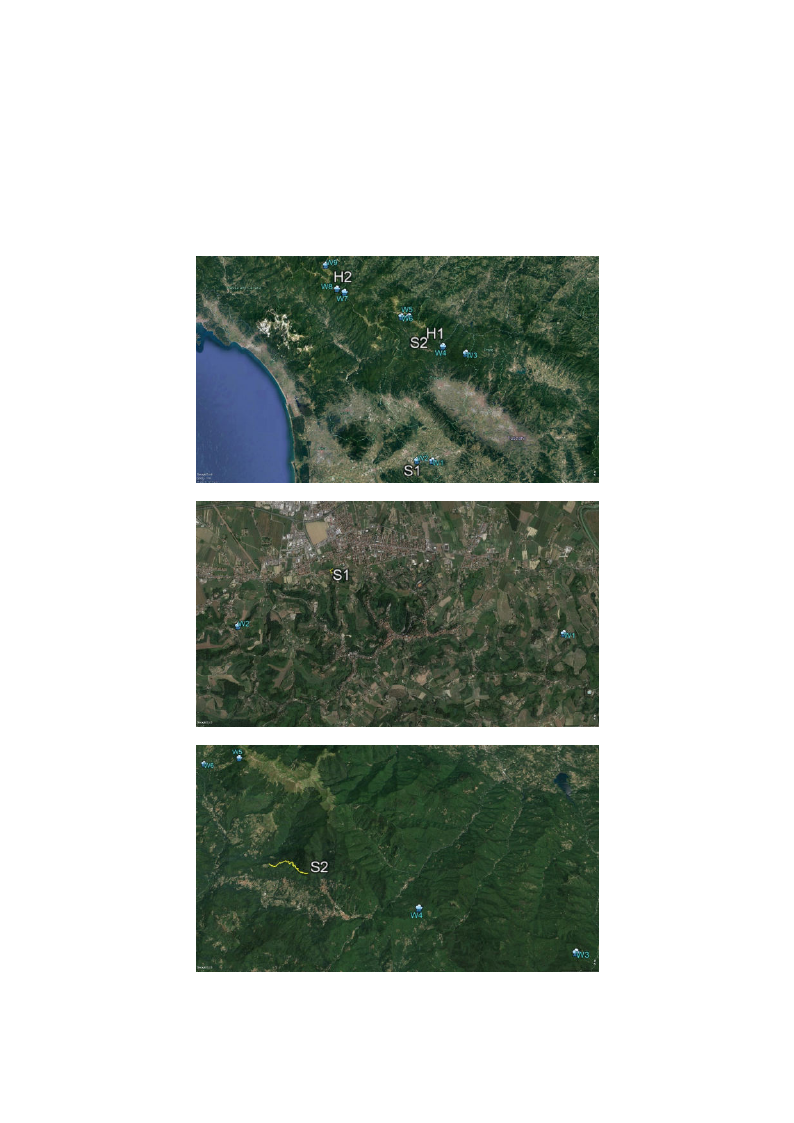
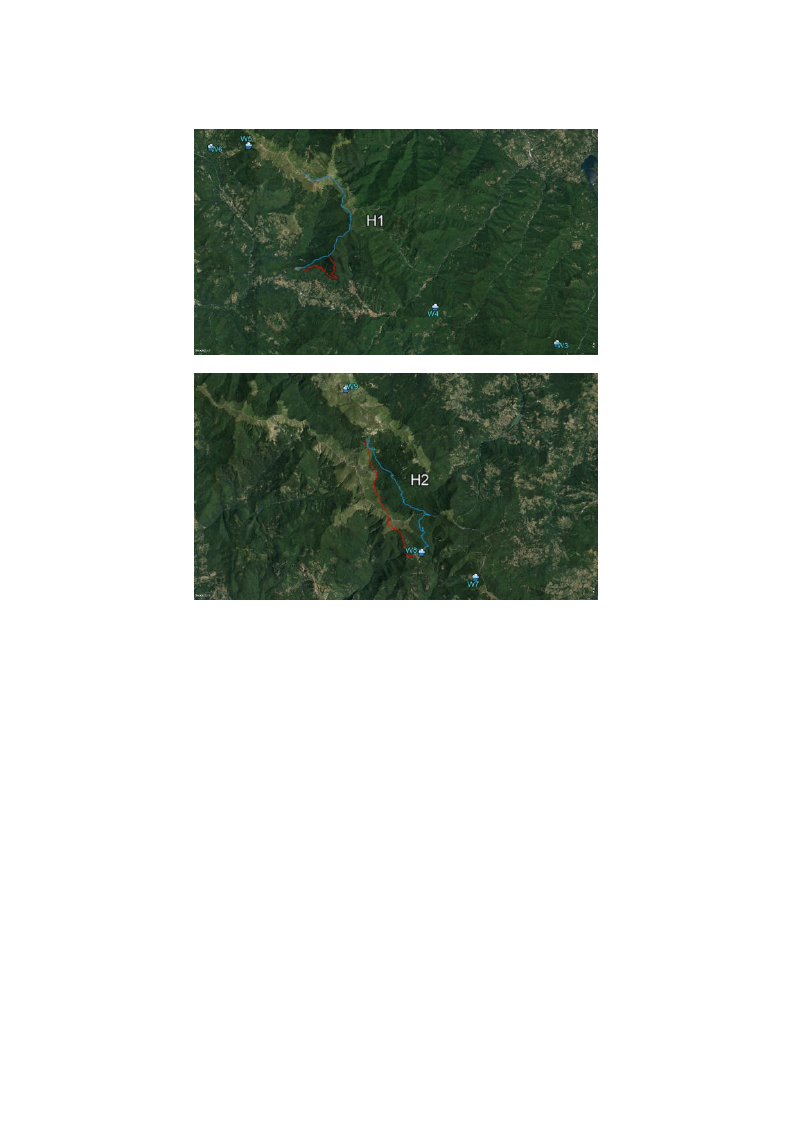
Figure 1a shows the location of the study sites in a wide geographical context, across Tuscany and
the Emilia-Romagna regions, Italy, labeled as S1 (hilly site), S2 (forest path), and H1 and H2 (hiking
trails). The considered weather stations (W1 to W9) are represented too. The study areas are shown
in detail in Figure 1b–e, with the forest path (S2) shown in yellow, and the hiking trails (H1 and H2)
represented by red and blue lines.
Table 1 shows the list of the study sites and the weather stations, along with the respective
geographical coordinates (for weather stations), elevation, and data collected.
Table 1. List of study sites and weather stations.
ID
Type
Lat
Lon
Elevation
Data
S1 1
Hilly site
43◦41 21.16
10◦50 08.38
61 m a.s.l.
TVOC
W1
Weather station 43◦40 48.00 N 10◦53 00.40 E
117 m a.s.l.
W, GR 4
W2
Weather station 43◦40 48.00 N 10◦49 00.80 E
102 m a.s.l.
T
S2 2
Forest path
960–1150 m a.s.l.
TVOC
H1 2
Hiking trail
960–1855 m a.s.l.
TVOC
W3
Weather station 44◦01 12.00 N 11◦01 00.80 E
950 m a.s.l.
GR
W4
Weather station 44◦02 24.00 N 10◦55 00.20 E
785 m a.s.l.
W
W5
Weather station 44◦07 48.00 N 10◦46 00.80 E
1716 m a.s.l.
T, W, RH
W6
Weather station 44◦07 48.00 N 10◦44 00.40 E
1000 m a.s.l.
T
H2 3
Hiking trail
1312–1816 m a.s.l.
TVOC
W7
Weather station 44◦12 00.00 N 10◦29 00.40 E
1637 m a.s.l.
T, W, GR
W8
Weather station 44◦12 36.00 N 10◦27 00.00 E
1297 m a.s.l.
T
W9
Weather station 44◦16 55.56 N 10◦24 00.10 E
2057 m a.s.l.
T, W
1 Meteorological data from weather stations W1 and W2. 2 Meteorological data from weather stations W3, W4,
W5, and W6. 3 Meteorological data from weather stations W7, W8, and W9. 4 Meteorological data abbreviations
and units: T, air temperature 2 m above ground (◦C); W, wind intensity 10 m above ground (ms−1); RH, relative
humidity 2 m above ground (%); GR, global radiation (Wm−2); TVOC, total volatile organic compound (mg/kg).
Int. J. Environ. Res. Public Health 2019, 16, 4915
4 of 24
All weather data were collected every 15 min and consisted of the respective averages over
the previous 15 min. The weather stations W1 to W8 belonged to the monitoring network of the
Regional Functional Center for Weather—Hydrological Monitoring, Tuscany, Italy (http://cfr.toscana.it/).
Weather station W9 belonged to the monitoring network of the “Reggio Emilia Meteo” association
(http://www.reggioemiliameteo.it/), and the respective data (temperature and wind) were retrieved
from the public web site.
(a)
(b)
(c)
Figure 1. Cont.
Int. J. Environ. Res. Public Health 2019, 16, 4915
5 of 24
(d)
(e)
Figure 1. (a) Study sites (S1, S2, H1, and H2), and weather stations (W1 to W9), in a wide geographical
context (central and northern Tuscany, Italy). (b) Detail over the (hilly) study site S1. (c) Detail over
the study site S2, with the forest path represented by a yellow line. (d) Detail over the study site H1.
(e) Detail over the study site H2. The hiking trails H1 and H2 are represented by red and blue lines.
2.3. TVOC, Geographical, and Meteorological Data: Measurement, Logging and Merging
The measurement sessions on the fixed site S1 were carried out with PID pump placed 1.2 ± 0.1 m
above the ground, with such height corresponding approximately to the height of the nose of a 1.75-m
tall person sitting on a chair. The measurement sessions along pathways (S2, H1, and H2) were carried
out with the PID fixed on the backpack. The pump was again placed 1.2 ± 0.1 m above the ground,
and the paths were always traveled on foot, in order to avoid any contamination from engine exhaust
gases. However, most of the routes could not be traveled by other means.
The PID logged data every 2 s, with each data string consisting of the time of measurement and
TVOC concentration level in ppm unit (mg/kg). For each measurement session, the lowest detected
concentration (which could be positive or negative, due to the factory calibration used), was subtracted
from all the other data, in order to remove, as much as possible, background TVOC concentration
level. Such background level likely included BVOCs too, and thus resulting TVOC concentration levels
could be considered as lower estimates of the actual BVOC concentration levels, especially due to the
remoteness of the considered sites from any anthropogenic source.
While in principle changes of the levels of anthropogenic VOCs during time spans of a few hours
could not be ruled out, for example due to changes in the atmospheric vertical stability or to changes
in the emission rates from anthropogenic sources, the above-mentioned remoteness should keep such

Int. J. Environ. Res. Public Health 2019, 16, 4915
6 of 24
uncertainty at comparatively low levels. This topic is further discussed in Section 4. Finally, since
this study aimed at a preliminary assessment of the relative variability in time and space of BVOC
concentration levels within the forest atmosphere, the accurate assessment of the respective absolute
concentration levels remains outside the scope.
Limited to the measurements along pathways, continuous geographic localization was performed
by means of Global Positioning System (GPS) software installed in a commercial smartphone (Open
GPX Tracker, https://apps.apple.com/it/app/open-gpx-tracker/id984503772), with data logging every
7 s, including the time of measurement, latitude, and longitude. The height above sea level (a.s.l.)
was assigned to each geographical point, based on the dataset of the National Aeronautics and Space
Administration, Shuttle Radar Topography Mission (NASA’s SRTM), 30-m horizontal resolution, by
means of an online conversion software (GPS Visualizer, https://www.gpsvisualizer.com/convert_input).
The PID and the smartphone were synchronized, and then TVOC and geographical data were merged
based on the respective measurement times, with TVOC data interpolated to the time points of the
GPS data.
In order to assign to each TVOC data point, at any time, a complete set of meteorological data
(temperature, global radiation, and wind intensity), the data collected at the weather stations were
interpolated as follows. At local elevations below or above the range of elevations of the considered
stations, the air temperature measured at the nearest weather station was interpolated based on the local
elevation, according to the standard vertical gradient in the lower troposphere of −0.6 ◦C/100 m [37].
Otherwise, a linear interpolation to the local elevation was performed, based on data collected at the
weather stations located at the closest elevations below and above the local one.
The wind intensity was linearly interpolated to the local elevation, based on two of the weather
stations located at elevations closest the local one. Global radiation data were available only at a single
weather station for each study site. However, due to the observed low-level cloudiness around the
ridge along the H1 hiking trail, the global radiation data at elevations above 1600 m a.s.l. were corrected
to random levels between 0 and 100 Wm−2—a range representative of cloudy conditions—whenever
the relative humidity at the weather station W5 was at the level of 95% or above. While this was a
somehow arbitrary choice, adopted for representation purposes, the correction was imposed by the
relative remoteness of the weather station W5 (measuring the global radiation), its location far below
the mountain ridge, and the local character of the cloudiness over the ridge itself. Moreover, knowing
the exact level of the radiation below 100 Wm−2 was practically useless for the purposes of this study.
3. Results
3.1. Hilly Site
3.1.1. Clear and Calm Days
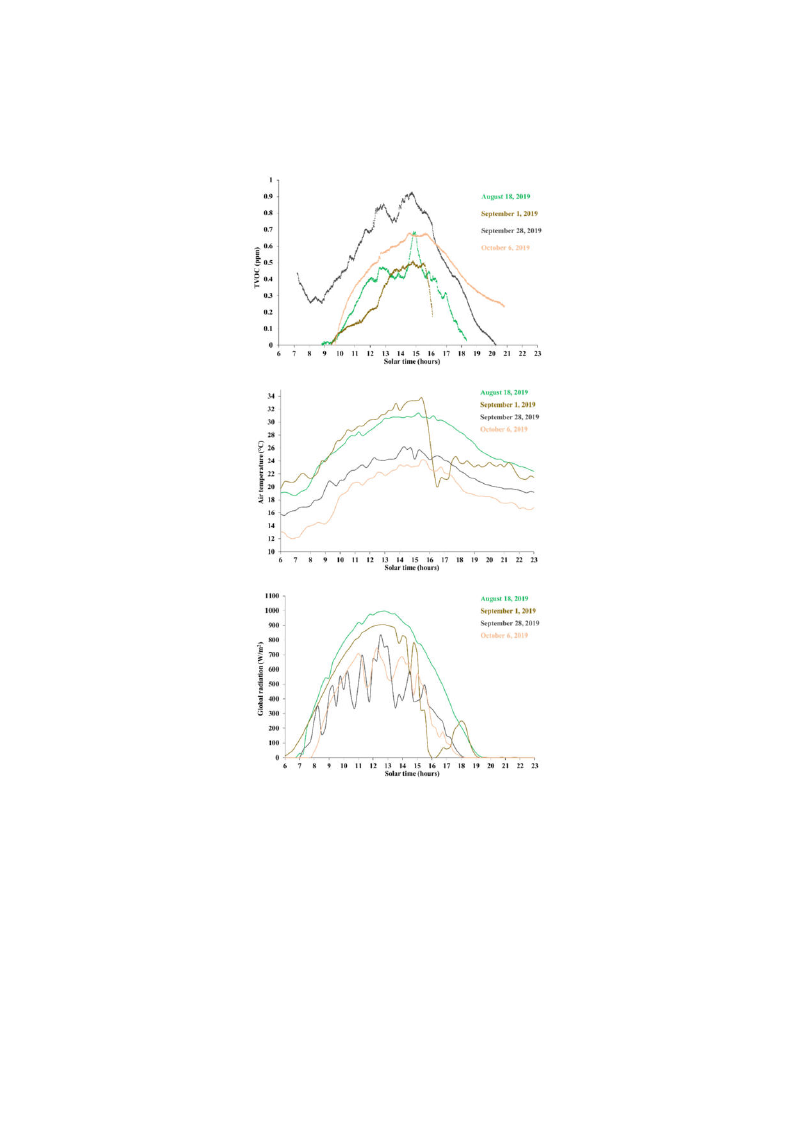
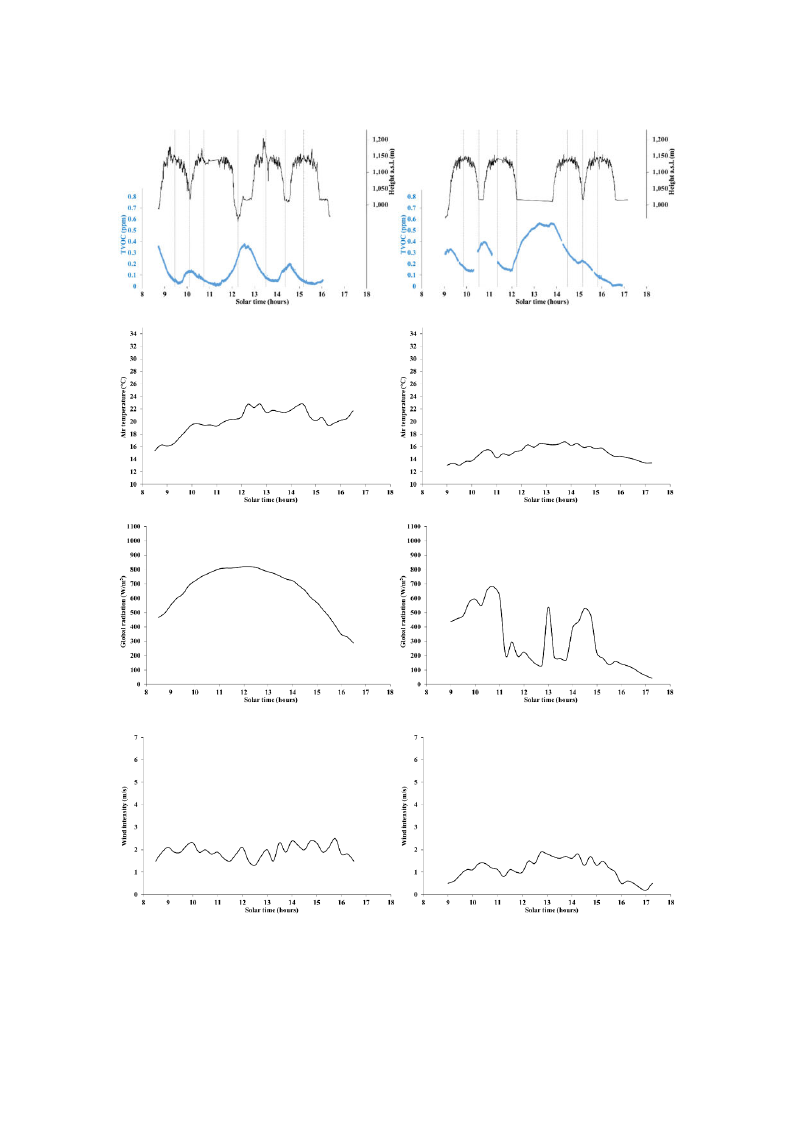
Figure 2a–c shows TVOC concentration and weather data series for the hilly site, labeled as site S1
in Table 1, during days with generally clear skies, low wind (average wind intensity over 15 min lower
than 3 m/s), and relatively high temperatures. TVOC concentration, temperature, and global radiation
are shown in Figure 2a–c, respectively.
The relative changes of TVOC concentration, during any given day, spanned from 0.5 to more
than 0.9 ppm, i.e., around the magnitude of the highest concentration levels commonly observed in the
forest air [29]. During any given day, TVOC relative concentration appeared to peak during the time
period 13:00–14:00 pm to 16:00 pm solar time, seemingly following the peak air temperature which lags
behind peak radiation rather than global radiation itself. However, dependence of TVOC concentration
on radiation could not be ruled out, for example due to the accumulation and persistence of MTs in
the lower atmosphere. Forest in site S1 was locally dominated by both evergreen trees (storing MTs)
such as cypress and eucalyptus and deciduous trees such as oak and poplar, suggesting dependence
on both temperature and radiation [32]. However, looking at different days, no evidence arose with
Int. J. Environ. Res. Public Health 2019, 16, 4915
7 of 24
respect to a monotonic relationship between the maximum amplitude of the daily concentration cycle
and the peak temperature.
(a)
(b)
(c)
Figure 2. Data on site S1 during generally clear and calm days. (a) Total volatile organic compound
(TVOC) concentration; (b) Air temperature; (c) Global radiation.
Radiation played a more remarkable role in late afternoon (approximately, after 16:00 pm), when
air temperature decreased slowly and was still relatively higher than in the morning, while TVOC
concentration dropped much faster than the respective rate of increase observed in the morning. Likely,
emissions from deciduous trees dropped quickly with the vanishing radiation. This could be confirmed
based on the event that occurred on 1 September 2019, when the sudden drop in TVOC concentration,
starting around 15:30 pm, followed the fast decrease of global radiation (related to a sudden storm
approaching the site), with a short delay (about 30 min). The air temperature dropped too, down
to approximately the levels shown in the same time period during the days of 28 September and
6 October, when TVOC concentrations did not drop significantly.

Int. J. Environ. Res. Public Health 2019, 16, 4915
8 of 24
Another important factor contributing to the falling concentration in late afternoon might be the
effect of the lowering of radiation levels on the atmospheric vertical stability, especially during clear
and calm days, and thus on the diffusivity of aerial substances down to the ground. This topic will be
discussed further in Section 4.
Finally, on 28 September 2019, the initial TVOC concentrations (around 07:00 am) were relatively
higher than subsequent levels, until about 10:00 am, despite lower radiation and air temperature.
This behavior could be suggestive of some relationship between TVOC concentrations and other
atmospheric properties, such as the atmospheric vertical stability, which will be discussed further in
Section 4.
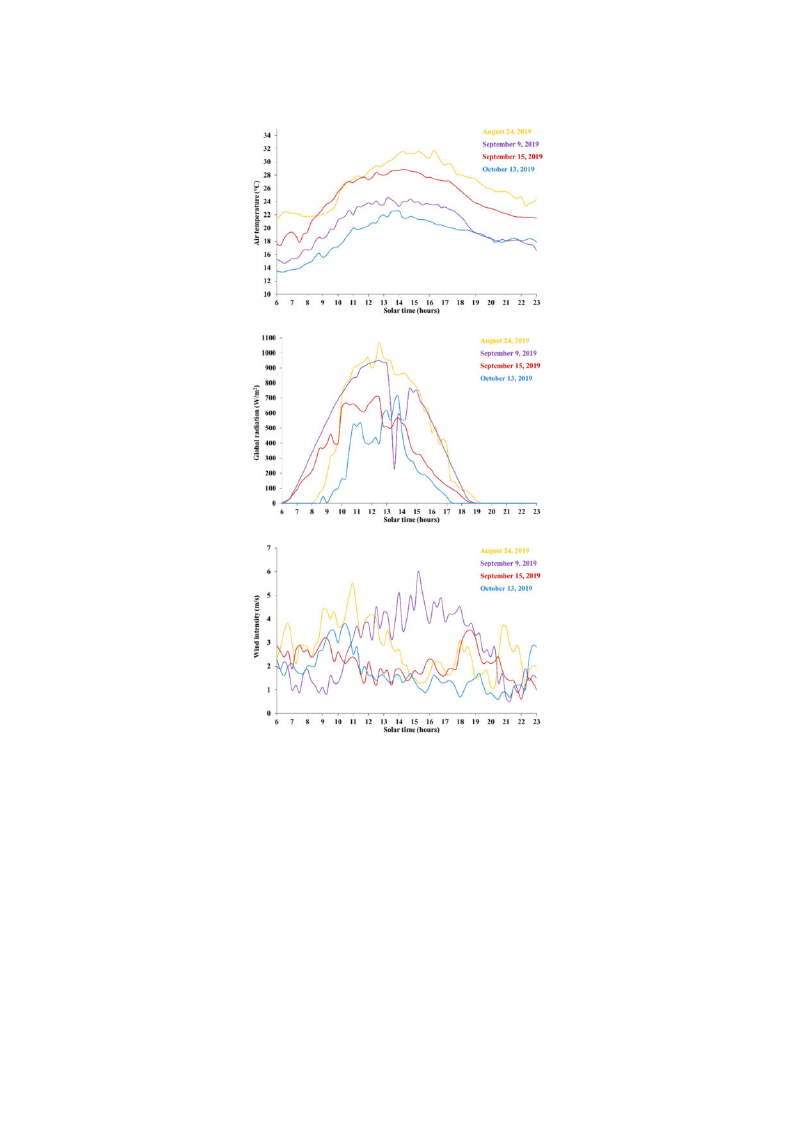
3.1.2. Other Days
Figure 3a–d shows TVOC concentration and weather data series for the hilly site, labeled
as site S1 in Table 1, during days with generally cloudy skies, lower temperatures, or relatively
sustained wind. TVOC concentration, temperature, global radiation, and wind intensity are shown in
Figure 3a–d, respectively.
The relative changes of TVOC concentration, during any given day, did not exceed 0.5 ppm, i.e.,
substantially less than on clear and calm days. The global radiation was not much lower than in the
clear days, although generally more irregular. The air temperature was generally lower, which—along
with frequent drops in radiation—could explain the generally lower levels of the amplitude of TVOC
concentration cycles.
On 24 August 2019, the delayed peak in the air temperature, around 16:00 pm, was associated
with the peak in TVOC concentration, which could have been favored also by the decreasing wind
intensity and the relatively high radiation levels. On 9 September, the sudden radiation drops after
about 13:00 pm and the simultaneous increase in the wind intensity could have been the drivers of
TVOC concentration decline after a weak peak around 10:00 am, when the wind was low and the
radiation already sufficiently high.
Over two days, 9 September and 15 September, with measurements beginning early enough
in the morning when there was sufficient radiation (contrary to other days) and the wind was low,
TVOC concentration was higher in the early morning (07:00–08:00 am) than in the following few
hours. Again, this evidence possibly points to a relationship between TVOC concentration and the
vertical atmospheric stability, which was already noted in Section 3.1.1 and will be discussed further in
Section 4.
On the other hand, TVOC concentrations appeared to fall generally less steeply in the afternoon
than in the clear and calm days considered in Section 3.1.1. Since the solar radiation affects the
atmospheric vertical stability more substantially during clear and calm days, this behavior could be
again suggestive of an important role played by the atmospheric vertical stability. This topic will be
discussed further in Section 4.
(a)
Figure 3. Cont.
Int. J. Environ. Res. Public Health 2019, 16, 4915
9 of 24
(b)
(c)
(d)
Figure 3. Data on site S1 during generally cloudy, colder, or windy days. (a) TVOC concentration;
(b) Air temperature; (c) Global radiation; (d) Wind intensity.
3.2. Forest Path
Figure 4a–d shows TVOC concentration and weather data series for the forest path, labeled as
site S2 in Table 1, measured on 11 September 2019. Figure 4e–h shows the same quantities for site S2,
measured on 5 October 2019.
Int. J. Environ. Res. Public Health 2019, 16, 4915
10 of 24
(a)
(e)
(b)
(f)
(c)
(g)
(d)
(h)
Figure 4. Data along forest path S2 on 11 September 2019. (a) Elevation and TVOC concentration;
(b) Air temperature; (c) Global radiation; (d) Wind intensity. On 5 October 2019: (e) Elevation and
TVOC concentration; (f) Air temperature; (g) Global radiation; (h) Wind intensity.

Int. J. Environ. Res. Public Health 2019, 16, 4915
11 of 24
Based on weather data, shown in Figure 4b–d, 11 September 2019 was a clear and calm day,
with very low wind; air temperatures were in the range 16 to 23 ◦C. The cyclical trend of TVOC
concentration, with local peaks around the lowest elevation of the forest path, and local minimums at
the highest part of the path, points to a remarkable spatial variability, with a maximum amplitude
around 0.4 ppm. Such variability could be related to either the air temperature (decreasing with the
elevation at any fixed time), or the plant species and status, soil emissions, and so on.
The above-mentioned peaks occurred at very different levels. In particular, TVOC concentration
peaks were substantially higher in the early morning (before 09:00 am) and just after 12:00 pm, than
around 10:00 am, 14:30 pm, and 16:00 pm. Similar to the behavior observed in Section 3.1, temperature
could have driven up TVOC emissions and concentrations during the hottest few hours of the day,
while the radiation-driven atmospheric vertical stability could have affected TVOC concentration
levels near the ground in early morning (increase) and late afternoon (decrease).
Based on weather data, shown in Figure 4f–h, 5 October 2019, was a calm day with very low
wind, but with alternation of cloudiness and sunny spells, as apparent in the radiation data. The air
temperatures ranged from about 13 to 17 ◦C and no rain was observed during the day.
A cyclical trend of TVOC concentration appeared again in Figure 4e, qualitatively very similar
to that observed in Figure 4a, with local peaks around the lowest elevation of the forest path, local
minimums at the highest part of the path, and maximum amplitude around 0.55 ppm. Such greater
amplitude could have been due to the wild changes in radiation.
The absolute peak in TVOC concentration was again observed in early afternoon, in particular
between 12:40 and 14:00 pm, during a prolonged stop at the lowest site of the route. Interestingly,
TVOC concentration increased by more than 0.25 ppm since the arrival at the lowest site, possibly
following the sudden spike in radiation, with air temperatures around the peak of day. The second
peak in radiation occurred around the highest elevation site of the route (around 14:30 pm), and could
have helped to retain a relatively high concentration level. The subsequent fast drop in radiation could
explain the substantial absence of further peaks at the lowest site.
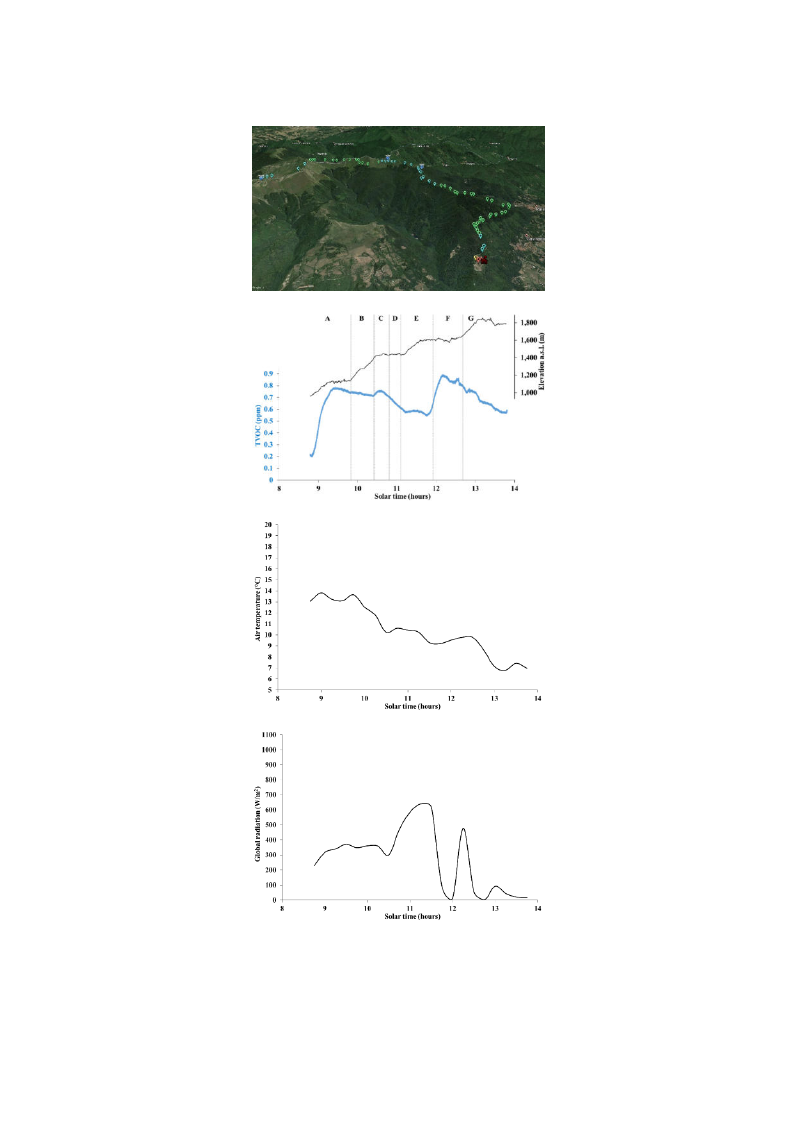
3.3. Hiking Trails
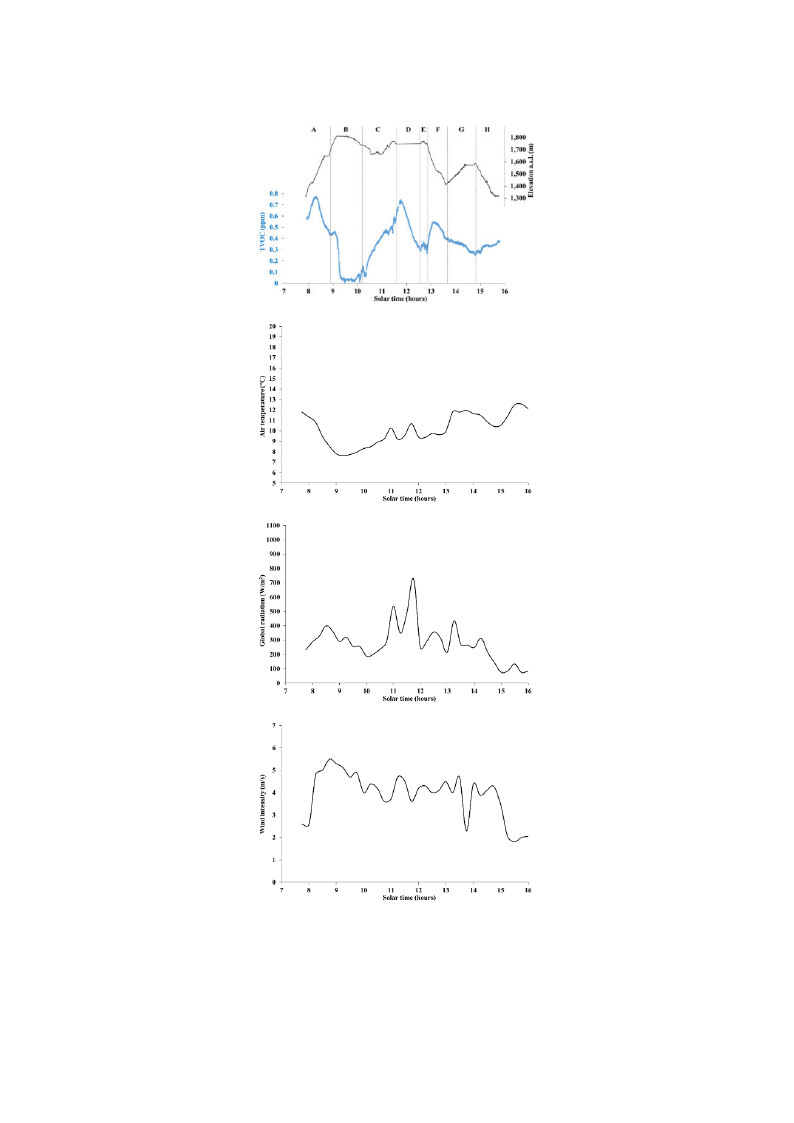
Figure 5a–e shows TVOC concentration (both superimposed on a topographic map and as a chart)
and weather data series for the uphill part of the hiking trail labeled as H1 in Table 1, as measured on
12 October 2019. The lowest TVOC concentration level in Figure 5b is above zero because the offset
was computed over the whole day, i.e., over the entire hiking trail, including the downhill part, which
is described below. The first part of the route, labeled as A in Figure 5b, coincided with the forest path
(site S2 in Table 1) analyzed in Section 3.2.
TVOC concentration increased by nearly 0.6 ppm along part A of the route (forest path, site S2 in
Table 1, with dominance of chestnut, ash, black pine, and silver fir trees), approximately from 09:00 to
09:45 am, which occurred with low wind, relatively high air temperatures, and moderate radiation.
This situation could have mimicked early morning conditions in summer.
Along part B of the route, steeply rising from about 1150 to 1450 m a.s.l., and mostly dominated
by beech and silver fir trees, TVOC concentration remained at comparatively high levels. From
approximately 09:45 to 10:30 am, the global radiation was still moderate, the air temperature decreased
by about 3 ◦C, and the wind intensity was still low, similarly to part A of the route. The subsequent
small local peak in TVOC concentration, along part C of the route, occurred along with a local minimum
of both radiation and air temperature, possibly reinforcing the hypothesis that early morning-like
vertical atmospheric stability could favor relatively high TVOC concentrations near the ground. This
hypothesis will be discussed further in Section 4. In addition, the change in the composition of the
forest vegetation, with beech becoming dominant over fir trees, could have played a role.
Int. J. Environ. Res. Public Health 2019, 16, 4915
(a)
(b)
(c)
(d)
Figure 5. Cont.
12 of 24

Int. J. Environ. Res. Public Health 2019, 16, 4915
13 of 24
(e)
Figure 5. Data along the uphill part of the hiking trail H1 on 12 October 2019. (a) TVOC concentration
classes on a topographical map (red, 0–0.225 ppm; yellow, 0.225–0.450 ppm; blue, 0.450–0.675 ppm;
green, 0.675–0.892 ppm), with the red colored house representing the site “Pian dei Termini”, and the
symbols with blue shield surmounted by an eagle representing mountain refuges, managed by the
Italian Alpine Club; (b) Elevation and TVOC concentration; (c) Air temperature; (d) Global radiation;
(e) Wind intensity.
Along parts D and E of the route, with elevation eventually reaching about 1600 m a.s.l. and the
trail emerging outside a pure beech forest and reaching a mountain grassland, TVOC concentration
gradually dropped to a minimum. During these parts of the route (from around 10:45 to 11:45 am),
the wind intensity increased as the mountain ridge was approached, the radiation reached the daily
peak (over 600 Wm−2), and the air temperature changed slightly. Although the relatively high
radiation levels should have favored the BVOC emissions from beeches, the neutral to unstable vertical
atmospheric profile could have diluted the VOCs across a deeper atmospheric layer, thus lowering
TVOC concentrations near the ground. Moreover, the change from mixed beech–fir tree forest to pure
beech forest could have contributed to the observed drop under the specific meteorological conditions.
The absolute peak in TVOC concentration, observed along part F of the route (from around 12:00
to 12:45 pm), is harder to explain. Most of the route crossed a mountain grassland, only occasionally
reentering the forest; air temperature did not change remarkably, while radiation oscillated wildly
between nearly zero (ridge inside low clouds) and almost 500 Wm−2. Notably, the southwesterly
wind intensity increased up to the daily maximum of 5 ms−1, which might suggest the advection of
BVOCs from the nearby forest and the respective accumulation near the ground on the upwind side
of the ridge. The same factors could also explain why TVOC concentration dropped by only about
0.3 ppm, well below what one could have expected, along part G of the route (12:45 to 13:45 pm),
entirely developing around the ridge and on mountain grasslands, with very low radiation and air
temperatures at the da− ily minimum (around 7 ◦C).
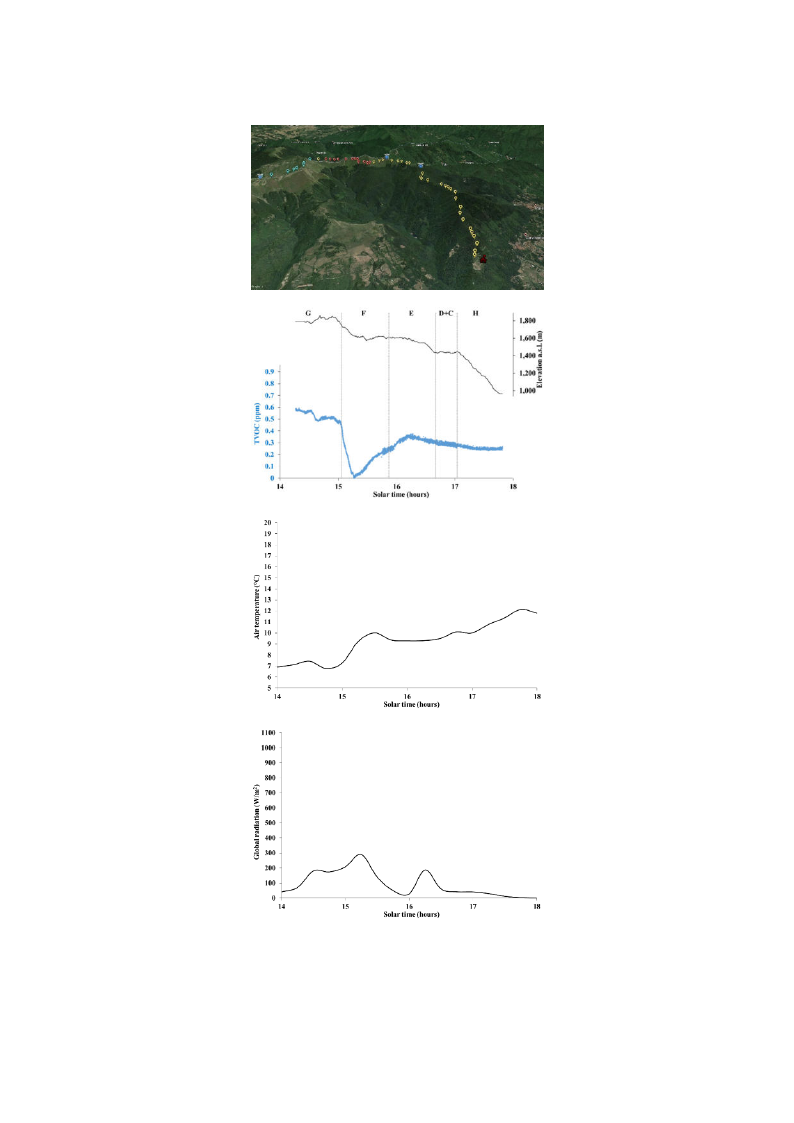
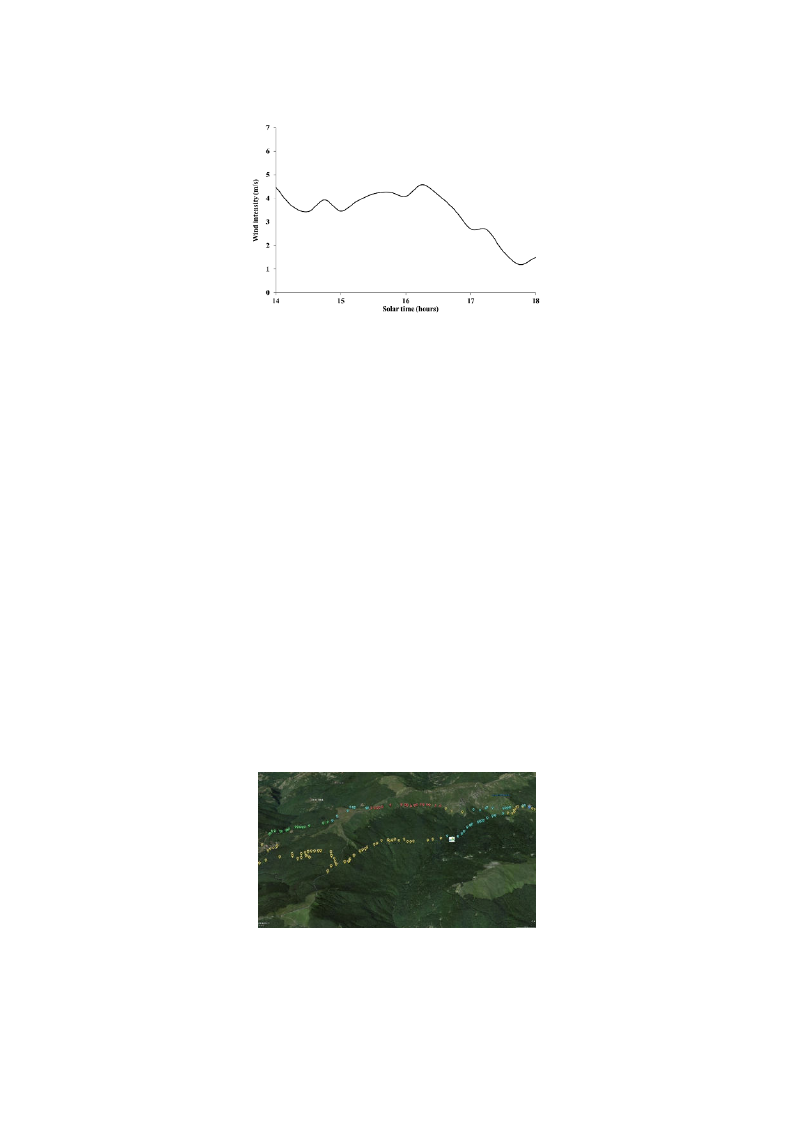
Figure 6a–e shows TVOC concentration (both superimposed on a topographic map and represented
as a chart along with the local elevation) and weather data series for the downhill part of the hiking
trail labeled as H1 in Table 1, again measured on 12 October 2019. The latter part of this route was
slightly different from the uphill path, while eventually getting to the same site, and is labeled with a
different letter (H).
−
−
Int. J. Environ. Res. Public Health 2019, 16, 4915
(a)
(b)
(c)
(d)
Figure 6. Cont.
14 of 24
Int. J. Environ. Res. Public Health 2019, 16, 4915
15 of 24
(e)
Figure 6. Data along the downhill part of the hiking trail H1 on 12 October 2019. (a) TVOC concentration
classes on a topographical map (red, 0–0.225 ppm; yellow, 0.225–0.450 ppm; blue, 0.450–0.675 ppm;
green, 0.675–0.892 ppm), with the red colored house representing the site “Pian dei Termini”, and the
symbols with blue shield surmounted by an eagle representing mountain refuges, managed by the
Italian Alpine Club; (b) Elevation and TVOC concentration; (c) Air temperature; (d) Global radiation;
(e) Wind intensity.
TVOC concentrations along most of the downhill route were much lower than along the uphill
route, which is apparent after comparing the maps in Figures 5a and 6a. This comes as little surprise
because air temperatures were generally lower and global radiation even more so due to increased
cloudiness and the progression of time in the afternoon. The lower part of the downhill route (parts E,
D+C, and H in Figure 6b) could have been deeply affected by the changed conditions, with TVOC
concentration levels lower by 0.25 to 0.45 ppm in comparison with the uphill route.
The absolute minimum in TVOC concentration levels in part F of the downhill route shown in
Figure 6b and corresponding to the red colored tags in Figure 6a is especially suggestive. Such levels
were as much as nearly 0.9 ppm lower than the levels observed along the same part of the route just 3 h
earlier. Indeed, this part crossed mainly mountain grasslands, and most of observed VOCs were likely
to be the result of the advection from the nearby forest. With lower radiation and somewhat lower
wind intensity, likely both BVOC emissions from forest trees and the respective advection decreased,
resulting in remarkably lower TVOC concentrations.
Figure 7a–e shows TVOC concentration, both superimposed on a topographic map and represented
as a chart along with the local elevation, and weather data series for the ring-shaped hiking trail labeled
as H2 in Table 1, measured on 29 September 2019.
(a)
Figure 7. Cont.
Int. J. Environ. Res. Public Health 2019, 16, 4915
16 of 24
(b)
(c)
(d)
(e)
Figure 7. Data along the hiking trail H2 on 29 September 2019. (a) TVOC concentration classes
on a topographical map (red, 0–0.194 ppm; yellow, 0.194–0.388 ppm; blue, 0.388–0.582 ppm; green,
0.582–0.776 ppm), with the square symbol with white background representing the “Segheria” refuge,
managed by the Tuscan-Emilian Apennine National Park, and the symbol with blue shield surmounted
by an eagle representing the “C. Battisti” refuge, managed by the Italian Alpine Club; (b) Elevation and
TVOC concentration; (c) Air temperature; (d) Global radiation; (e) Wind intensity.

Int. J. Environ. Res. Public Health 2019, 16, 4915
17 of 24
TVOC concentration levels oscillated with a maximum amplitude greater than 0.75 ppm along
the ring-shaped route. The highest peak occurred along the part of the route labeled as A in Figure 7b,
in early morning (08:00 to 08:40 am) at elevations of 1400 to 1550 m a.s.l., in a mixed beech–fir trees
forest with both silver firs and Douglas firs. Weather conditions were characterized by moderate global
radiation (300–400 Wm−2), relatively low temperature (9–11 ◦C), and wind intensity (3 to 4.5 ms−1),
likely leading to a shallow neutral to unstable vertical atmospheric profile.
Subsequently, part B of the route (08:45 to 10:15 am) developed across mountain grasslands at
higher elevations (from more than 1800 to about 1750 m a.s.l.), with lower temperatures (about 8 ◦C),
lower radiation levels (200–300 Wm−2), and stronger wind (up to 5.5 ms−1). TVOC concentration levels
dropped to a prolonged absolute minimum, starting from the ridge and further along the leeward
side (the wind was blowing from the south-west). Likely, no effective advection of VOCs occurred
from forests located at least 200 m below the ridge, and constituted (on the windward side) by pure
beech stands.
Along part C (10:15 to 11:30 am) at elevations between 1650 and 1750 m a.s.l., alternately crossing
grasslands and forest stands with both beech and fir trees, TVOC concentrations gradually increased,
eventually by nearly as much as 0.6 ppm, possibly in response to both the presence of tree vegetation
and increased radiation, with the latter reaching about 500 Wm−2. At about 11:30 am–12:30 pm (part
D), TVOC concentration measurements were taken at a fixed point (“C. Battisti” refuge, managed by
the Italian Alpine Club) at the elevation of 1765 m a.s.l., immersed in a mixed beech–fir tree forest.
TVOC concentrations initially increased by further 0.1 ppm, later dropping steeply by as much as
0.45 ppm. The reason of such decline in TVOC concentration may have been the trend in radiation,
initially increasing up to more than 700 Wm−2 and later dropping to an average of 350 Wm−2.
During part E of the route (12:30 to 12:50 pm), developed on the ridge covered by a grassland at
elevations around 1780 m a.s.l., TVOC concentrations remained stationary around a local minimum.
Later, they increased remarkably by about 0.25 ppm at the local peak during the descent across a
historic forest (“Abetina Reale”) dominated by silver fir trees, along with beeches and Norway spruce
(Part F, 12:50 to 13:40 pm), down to about 1400 m a.s.l. (location of the “Segheria” refuge, managed by
the Tuscan-Emilian Apennine National Park). While slightly stronger radiation (up to about 440 Wm−2)
and relatively higher temperature (up to about 12 ◦C) could not be ruled out, the forest vegetation
was likely the main driver for local BVOC emissions and, consequently, increased concentrations near
the ground.
Finally, a forest path crossed a pure beech forest in parts G and H of the route (ascent to the ridge
at the elevation of 1570 m a.s.l., and descent to the starting point of the trail, respectively). Decreasing
radiation levels or the forest composition, or both, could have contributed to relatively lower TVOC
concentrations (about 0.2 ppm below the local peak observed in the “Abetina Reale” forest).
4. Discussion
The meaningfulness of this study and the related findings relies upon the representativeness
of TVOC concentrations measured by means of a PID with respect to the biogenic components
(BVOC). Since the components of the detected TVOCs were not analyzed in any study sites and
paths, in principle their origin was unknown, i.e., they could be either biogenic or anthropogenic, or
both. However, the remoteness of the areas into consideration from anthropogenic sources, as well
as the adoption of a variable offset concentration level equal to the absolute minimum during any
measurement day, with respect to which all the other data were referred, should have minimized the
chance of substantial contributions of anthropogenic sources to reported TVOC concentration data.
Based on the above, in the following, unless explicitly specified, the volatile organic compounds under
consideration will be referred to as BVOCs.
The first and basic findings of this study concerned the remarkable variability of BVOC
concentrations in time and space, both on fixed sites and along paths, as well as in different environments,
i.e., low hill, mid-mountain sites and mountain sites up to over the upper limit of tree vegetation.
Int. J. Environ. Res. Public Health 2019, 16, 4915
18 of 24
Indeed, within the same day, relative changes of BVOC concentration commonly exceeded 0.5 ppm,
often even reaching levels as high as 0.9 ppm, on the order of magnitude of the highest concentration
levels observed in the forest air, i.e., around 1 ppm [29]. Such changes occurred within time scales as
short as a few tens of minutes, and within distances of the order of several hundred meters along paths
and hiking trails.
The takeaway message from these findings is that, as far as BVOCs are considered an essential
resource contributing to the forest healing effects, forest therapists and forest bathers should carefully
choose the right times and forest sites and paths even on clear and calm days. Hikers could incorporate
this information into their walking plans in order to benefit from BVOC inhalation along with the
advantages derived from the physical exercise.
Building a comprehensive quantitative model for BVOC concentration as a function of time of the
day and meteorological data, even on a single site and for clear and calm days, would require much
more extensive and continuous measurements. As well, the seasonality of emission rates from plants
and soil should be included, in turn depending on the specific forest composition. The structure and
the hourly evolution of the atmospheric boundary layer, including its vertical stratification, should be
accurately represented too. The climatology of BVOC concentrations along a path would be even more
challenging, due to changing forest composition and exposure of the path. On the other hand, mapping
BVOC concentration near the ground is just in its infancy, and the road ahead is still very long.
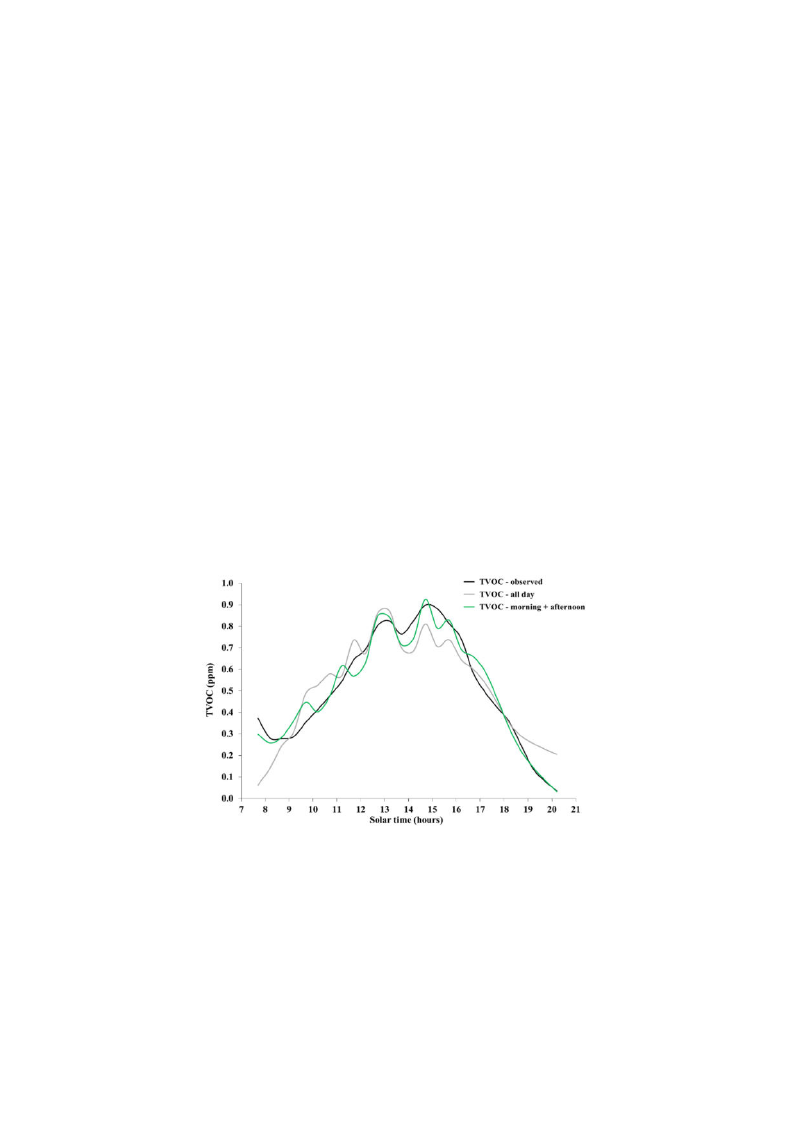
However, some insight could be gained, limited to a single day and on a fixed site. Based on
data collected on site S1 during 28 September 2019, shown in Figure 2a–e and endowed with the
largest daily coverage, the series of 30-min average concentrations of volatile organic compounds was
linearly regressed against air temperature and global radiation. Such regression was carried out both
during the whole period of measurements, and separately for the morning (07:30 am to 12:30 pm) and
afternoon (12:30 to 20:30 pm). The results are shown in Figure 8.
Figure 8. Observed and modeled concentration of volatile organic compounds on site S1 on 28 September
2019. The black line (TVOC—observed) represents the observed concentration. The gray line (TVOC—all
day) represents the result of multiple regression over the whole period of measurements. The green
line (TVOC—morning + afternoon) represents the result with regressions performed separately for
morning and afternoon.
Apparently, the likely, subtle effects produced by the lowest radiation levels in early morning
and late afternoon were represented much more accurately by the separate regressions performed for
morning and afternoon. In addition, the peak concentration, observed around 15:00 pm, was better
represented too, although marginally.
−

Int. J. Environ. Res. Public Health 2019, 16, 4915
19 of 24
Equations (1) and (2) show the regression equations for morning and afternoon, respectively:
TVOC = −1.14 + 0.09·T − 0.0005·R,
(1)
TVOC = −2.2−6 + 0.11·T + 0.0005·R,
(2)
where TVOC is concentration (ppm), T is temperature (◦C), and R is radiation (Wm−2). −
Equations (1) and (2) explained 82% and 97% of the variance, respectively, and were both significant
at the 1% level, based on the F statistics. While the dependence of concentration on temperature was
quite similar, the dependence on radiation was opposite, being negative in the morning and positive
in the afternoon. Likely, this reflects the fact that temperature was the main forcing for emissions
from plants [33,34], as well as from soil [35], while radiation drove the evolution of the atmospheric
boundary layer [38]. The following is a preliminary explanation of these results.
In the morning, temperature rises rapidly, stimulating higher emissions, while the increase in
radiation deepens the ground-based boundary layer, through which the emitted compounds are
diluted, thus counteracting the effect of increasing emissions with regard to ground concentration.
In early morning, the shallow boundary layer leads to relatively higher concentration despite the low
emission levels. In the afternoon, declining radiation eventually determines a ground-based stable
atmospheric layer, in turn surmounted by a residual mixing layer [38], thus hindering the accumulation
of volatile organic compounds near the ground, despite relatively high emission rates driven by slowly
decreasing temperature.
In an attempt to generalize the above-discussed findings, Figure 9 shows a simple conceptual
model, applicable to clear and calm days.
FFiigguurree 99.. CCoonncceeppttuuaall mmooddeell ooff bbiiooggeenniicc vvoollaattiillee oorrggaanniicc ccoommppoouunndd ((BBVVOOCC)) rreellaattiivvee ccoonncceennttrraattiioonn aatt
different times during daylight hours, on clear and calm days. The horizontal bars in shades of gray
represent stable atmospheric layers. The curved lines in blue represent mixed layers. Curved lines in
green represent BVOC emissions from trees and soil, with lengths indicatives of the respective emission
rates. The east (E) and west (W) are indicated. Elements of the picture are not to scale.
Cloudiness prevents most of the solar radiation from reaching the ground and the tree foliage,
primarily leading to reduced BVOC emissions, as well as to the limitation of atmospheric vertical
mixing, with the latter hindering the ground accumulation of BVOCs early in the morning while
attenuating the vertical dilution around noon in comparison with clear conditions. Overall, based on
the results presented in Section 3, cloud cover seems to lead to lower BVOC concentrations near the
ground. Strong winds drive remarkable horizontal advection of substances in the atmosphere, which
can unpredictably lead to higher or lower BVOC local concentrations near the ground, depending on

Int. J. Environ. Res. Public Health 2019, 16, 4915
20 of 24
the presence, composition, and emission rates of forest stands on the windward side, as well as on other
uncontrollable factors such as turbulence, leeward wakes, and other disturbances to the atmospheric
vertical mixing.
Within the level of significance allowed by the measurement campaigns carried out on a limited
sample of natural areas in central Italy, over a few days during less than three months between August
and October in a single year, and referring to the only daylight hours, some interpretation and a few
preliminary guidelines can be summarized as follows:
• Early in the morning, the soil heats up due to the emerging solar radiation, and a strong mixed
layer develops and grows in the atmosphere just above the ground, leading to a shallow unstable
boundary layer. Although BVOC emissions from trees are still limited by low levels of radiation
and temperature, BVOCs diffuse within a limited vertical layer and can accumulate near the
ground, up to relatively high concentration levels. Early morning could to be a relatively good
time for the contribution of BVOCs to forest healing effects.
• Mid-morning, the atmospheric mixed layer grows rapidly in depth, driven by the increasing
radiation, while BVOC emissions are still moderate. As a result, BVOCs diffuse within a relatively
deep vertical layer and their accumulation near the ground can temporarily decrease in comparison
to early morning. Mid-morning could be a relatively disadvantaged time.
• In the hours just after noon, with solar radiation and air temperature around their peaks, BVOC
emissions peak too, leading to the highest concentrations near the ground despite the high dilution
rate of BVOCs within the deep atmospheric mixed layer. The middle of the day, and early
afternoon could be the best time for the contribution of BVOCs to forest healing effects, provided
that other factors, such as those defining the bioclimatic comfort, are at acceptable levels.
• Late in the afternoon, with vanishing solar radiation, a stable atmospheric layer develops just
above the ground, leading to a shallow stable layer with very limited vertical mixing, in turn
surmounted by a residual mixing layer. The combination of declining BVOC emissions, due to low
radiation levels and falling temperature, and the inhibition of their mixing from elevated sources
(tree foliage) down to the ground, can lead to the lowest concentration levels. Late afternoon
could be the most disadvantageous time for the contribution of BVOCs to forest healing effects.
• With regard to BVOC inhalation, during clear and calm days, a preliminary planning suggestion
for hikers can be issued that forest trails should be preferably traveled in early morning and from
noon to early afternoon, rather than in mid-morning and late afternoon. Depending on hiking
miles, the latter periods could be used to rest at mountain refuges, or to walk through areas devoid
of forest vegetation.
• Cloudy or windy days appear less suitable at any time to enjoy the BVOC-related forest healing
effects due to generally lower and largely unpredictable concentration levels, adding this flaw to
the generally lower level of comfort.
• Based on the results of this study, and under the specific meteorological conditions, conifer trees
seemed to be more efficient with regard to BVOC concentrations in the forest air, at least in
comparison with beech trees (the most widespread tree in Italy, concentrated in mountainous
areas and especially in the Apennines, particularly at elevations above 1200 m). Thus, when
different alternatives are available, pure fir or mixed beech-fir forests could be preferred over pure
beech forests. However, the evidence was quite limited, and the above statement might not apply
to different deciduous tree species, which are widespread at lower elevations.
The presented findings are partially contrasting with results recently obtained in Korea, where peak
BVOC concentrations were found around 17:00 pm, and the lowest in the early morning [36]. However,
different sampling frequencies, forest environments and latitudes seriously limit the meaningfulness
of a comparison between the two studies. To the authors’ best knowledge, no other studies to date
match the requirements for a meaningful comparison.

Int. J. Environ. Res. Public Health 2019, 16, 4915
21 of 24
The advantages of using a PID for the measurement the concentrations of volatile organic
compounds in forest air consist of the very high measurement and logging frequency (2 s), allowing
to detect changes in real time on fixed sites, and about every 2 m along paths. The portability of the
instrument, as well as the low cost of measurements represent further advantages. The results of this
study demonstrate that high frequency measurements are needed in order to capture the substantial
variability of BVOC concentrations in forest air, occurring within a few tents of minutes and several
hundred meters.
The main and substantial disadvantage consists of the unselective measurements, which leave
unknown the composition of the detected compounds and their safe attribution to plant emissions.
The detection of the specific composition of volatile organic compounds, enabling their attribution
to biogenic or anthropogenic sources and thus providing a more accurate representation of BVOC
concentration, with an analysis of possible changes in time and space of the composition of BVOCs in
the forest air, would require completely different devices. For example, absorbent tubes that must be
deployed at least in triplicate at any point of measurement, require at least 60 min for any absorption
session, and must be thermally desorbed offline [36].
The application of methods aimed at detecting the specific components of BVOCs, like the one
mentioned above, would be practically unfeasible in the case of paths and hiking trails. However,
a recommended direction for future research with respect to the characterization of forest sites and
paths in terms of BVOC concentrations concerns the coupling of a high-frequency PID with analytical
devices, such as absorbent tubes, in order to calibrate the PID-based measurements at selected sites.
This direction aims at defining the relative contribution of biogenic compounds to the total
concentration of volatile organic compounds, and likely even more importantly the detailed composition
of BVOCs, which could change with season, time of day, weather conditions, composition of the forest,
and soil conditions [36]. Due to the remarkable specialization of different components of BVOCs with
regard to their biological activities [39], the functionality, or healing effectivity, of a forest site or path
would require the knowledge of the concentration not only of total BVOCs, but also of the relative
abundance of their most active constituents, and the respective variability in time and space.
Additional recommendations for further research can be summarized as follows:
• Beyond the quantities considered in this study, other meteorological disturbances such as drought
and accumulated rain in previous days should be taken into account.
• BVOC concentration daily cycles in different seasons, such as spring, early summer, late autumn,
and winter, should be investigated, also aimed at building up comprehensive year-long models.
• Instead of data from sparse weather stations whose interpolation could lead to remarkable
uncertainties, the use of high-resolution, gridded meteorological data over the geographical
domain into consideration is recommended, for example extracted from reanalyses or very
short-term forecasts generated by high-resolution mesoscale atmospheric models.
• A substantial amount of research is needed in order to score different tree types and forest
compositions with regard to their effect on the variability of BVOC concentrations in the forest air,
including the dependence on season and weather conditions, as well as accounting for emissions
from both plants and soil.
This study should be considered as a starting point, and possibly as a methodological reference, for
further investigation and research, following the above-listed recommendations. However, the basic
finding and its consequences appear indisputable: as long as BVOCs are considered as an essential
resource contributing to forest healing effects, detailed knowledge of the respective concentration
patterns in forest air and careful planning of practices are needed in order to substantially optimize the
benefits for human mental and physiological health.

Int. J. Environ. Res. Public Health 2019, 16, 4915
22 of 24
5. Conclusions
Knowledge of the variability of BVOC concentrations in forest air could contribute to the
optimization of forest healing effects. In particular, it could assist in planning forest therapy sessions
and practices, and allow hikers to benefit more greatly from their walking along forest and mountain
trails. For the first time, this study demonstrated that the variability scale of BVOC concentrations
could be comparable to the absolute concentration levels within time scales of less than one hour and
spatial scales of several hundred meters.
These results were achieved by using a photoionization detector that, while not allowing the
detection of individual components, allowed high-frequency measurements both on fixed sites and
along paths. The remoteness of the study areas from anthropogenic sources, along with suitable data
processing, reasonably ensured the representativeness of the measurements of the total concentration
of volatile organic compounds with regard to the biogenic ones.
Based on empirical evidence, limited quantitative relationships, and a conceptual model,
provisional guidelines have been formulated about the evolution of BVOC concentrations during
daylight hours, suggesting the likelihood of peak BVOC concentration during few hours after noon, a
secondary peak in early morning, and lowest concentration in late afternoon during clear and calm
days. In addition, a very preliminary conclusion was drafted that conifer trees are more efficient than
beeches with regard to BVOC concentration in forest air.
Author Contributions: Conceptualization, F.Z. and F.M.; methodology, F.M., F.Z., and L.A.; software, F.M., L.A.,
and G.B.; validation, F.M., L.A., and G.B.; formal analysis, F.M.; investigation, F.M. and L.A.; resources, F.M.; data
curation, L.A., G.B., and F.M.; writing—original draft preparation, F.Z. and F.M.; writing—review and editing,
F.Z., F.M., and G.B.; visualization, F.M. and L.A.; supervision, F.M. and F.Z.; project administration, F.Z. and F.M.;
funding acquisition, F.M. and F.Z.
Funding: Author F.M. received partial funding for this research from the Central Scientific Committee of the Italian
Alpine Club (CSC-CAI), project “The hidden treasure of conifers in the Tuscan-Emilian Apennines” (RiForest).
Acknowledgments: Massimo Albertazzi (Ion Science Italia S.r.l.) and Davide Comastri (Comastri Distribution
S.r.l.) are gratefully acknowledged for the granting of the Tiger VOC detector. Giuliano Cervi, Sonia Cuseri,
Giancarlo Tellini, Francesco Mantelli, Evelin Franceschini, and Marco Guiducci (Italian Alpine Club) are gratefully
acknowledged for very useful suggestions and invaluable logistic support during the measurement campaigns.
The authors are indebted to Francesco Becheri (“Pian dei Termini” farmer and psychotherapist, Italy) and Maurizio
Droli (University of Udine, Italy), who introduced the forest therapy and forest bathing concepts in Italy and
shared their brilliant ideas with us, as well as to Andrea Piotti (Institute of Biosciences and Bioresources, National
Research Council, Italy), who, with his team, is revolutionizing knowledge of the origin and real value of coniferous
forests in the Italian Apennines.
Conflicts of Interest: The authors declare no conflict of interest.
References
1. Bowler, D.E.; Buyung-Ali, L.M.; Knight, T.M.; Pullin, A.S. A systematic review of evidence for the added
benefits to health of exposure to natural environments. BMC Public Health 2010, 10, 456. [CrossRef]
2. Song, C.; Ikei, H.; Miyazaki, Y. Physiological effects of nature therapy: A review of the research in Japan. Int.
J. Environ. Res. Public Health 2016, 13, 781. [CrossRef] [PubMed]
3. Lee, I.; Choi, H.; Bang, K.S.; Kim, S.; Song, M.K.; Lee, B. Effects of forest therapy on depressive symptoms
among adults: A systematic review. Int. J. Environ. Res. Public Health 2017, 14, 321. [CrossRef] [PubMed]
4. Furuyashiki, A.; Tabuchi, K.; Norikoshi, K.; Kobayashi, T.; Oriyama, S. A comparative study of the
physiological and psychological effects of forest bathing (Shinrin-yoku) on working age people with and
without depressive tendencies. Environ. Health Prev. Med. 2019, 24, 46. [CrossRef] [PubMed]
5. Im, S.; Choi, H.; Jeon, Y.-H.; Song, M.-K.; Kim, W.; Woo, J.-M.; Im, S.G.; Choi, H.; Jeon, Y.-H.; Song, M.-K.;
et al. Comparison of effect of two-hour exposure to forest and urban environments on cytokine, anti-oxidant,
and stress levels in young adults. Int. J. Environ. Res. Public Health 2016, 13, 625. [CrossRef]
6. Chun, M.H.; Chang, M.C.; Lee, S.J. The effects of forest therapy on depression and anxiety in patients with
chronic stroke. Int. J. Neurosci. 2017, 127, 199–203. [CrossRef]

Int. J. Environ. Res. Public Health 2019, 16, 4915
23 of 24
7. Hansen, M.M.; Jones, R.; Tocchini, K. Shinrin-yoku (Forest bathing) and nature therapy: A state-of-the-art
review. Int. J. Environ. Res. Public Health 2017, 14, 851. [CrossRef]
8. Morita, E.; Fukuda, S.; Nagano, J.; Hamajima, N.; Yamamoto, H.; Iwai, Y.; Nakashima, T.; Ohira, H.;
Shirakawa, T. Psychological effects of forest environments on healthy adults: Shinrin-yoku (forest-air bathing,
walking) as a possible method of stress reduction. Public Health 2007, 121, 54–63. [CrossRef]
9. Farrow, M.R.; Washburn, K. A review of field experiments on the effect of forest bathing on anxiety and heart
rate variability. Glob. Adv. Health Med. 2019, 8. [CrossRef]
10. Ochiai, H.; Ikei, H.; Song, C.; Kobayashi, M.; Takamatsu, A.; Miura, T.; Kagawa, T.; Li, Q.; Kumeda, S.; Imai, M.;
et al. Physiological and psychological effects of forest therapy on middle-aged males with high-normal
blood pressure. Int. J. Environ. Res. Public Health 2015, 12, 2532. [CrossRef]
11. Oh, B.; Lee, K.J.; Zaslawski, C.; Yeung, A.; Rosenthal, D.; Larkey, L.; Back, M. Health and well-being benefits
of spending time in forests: Systematic review. Environ. Health Prev. Med. 2017, 22, 71. [CrossRef] [PubMed]
12. Ideno, Y.; Hayashi, K.; Abe, Y.; Ueda, K.; Iso, H.; Noda, M.; Lee, J.S.; Suzuki, S. Blood pressure-lowering
effect of Shinrin-yoku (Forest bathing): A systematic review and meta-analysis. BMC Complement. Altern.
Med. 2017, 17, 1–12. [CrossRef] [PubMed]
13. Bielinis, E.; Bielinis, L.; Krupin´ ska-Szeluga, S.; Łukowski, A.; Takayama, N. The effects of a short forest
recreation program on physiological and psychological relaxation in young polish adults. Forests 2019, 10, 34.
[CrossRef]
14. Ochiai, H.; Ikei, H.; Song, C.; Kobayashi, M.; Miura, T.; Kagawa, T.; Li, Q.; Kumeda, S.; Imai, M.; Miyazaki, Y.
Physiological and psychological effects of a forest therapy program on middle-aged females. Int. J. Environ.
Res. Public Health 2015, 12, 4984. [CrossRef] [PubMed]
15. Park, B.J.; Tsunetsugu, Y.; Kasetani, T.; Kagawa, T.; Miyazaki, Y. The physiological effects of Shinrin-yoku
(taking in the forest atmosphere or forest bathing): Evidence from field experiments in 24 forests across
Japan. Environ. Health Prev. Med. 2010, 15, 18–26. [CrossRef] [PubMed]
16. Yu, C.P.; Lin, C.M.; Tsai, M.J.; Tsai, Y.C.; Chen, C.Y. Effects of short forest bathing program on autonomic
nervous system activity and mood states in middle-aged and elderly individuals. Int. J. Environ. Res. Public
Health 2017, 14, 897. [CrossRef]
17. Li, Q.; Kobayashi, M.; Wakayama, Y.; Inagaki, H.; Katsumata, M.; Hirata, Y.; Hirata, K.; Shimizu, T.;
Kawada, T.; Park, B.J.; et al. Effect of phytoncide from trees on human natural killer cell function. Int. J.
Immunopathol. Pharmacol. 2009, 22, 951–959. [CrossRef]
18. Li, Q. Effect of forest bathing trips on human immune function. Environ. Health Prev. Med. 2010, 15, 9–17.
[CrossRef]
19. Seo, S.C.; Park, S.J.; Park, C.W.; Yoon, W.S.; Choung, J.T.; Yoo, Y. Clinical and immunological effects of a forest
trip in children with asthma and atopic dermatitis. Iran. J. Allergy, Asthma Immunol. 2015, 14, 28–36.
20. Ohtsuka, Y.; Yabunaka, N.; Takayama, S. Shinrin-yoku (forest-air bathing and walking) effectively decreases
blood glucose levels in diabetic patients. Int. J. Biometeorol. 1998, 41, 125–127. [CrossRef]
21. Bang, K.S.; Kim, S.; Song, M.K.; Kang, K.I.; Jeong, Y. The effects of a health promotion program using urban
forests and nursing student mentors on the perceived and psychological health of elementary school children
in vulnerable populations. Int. J. Environ. Res. Public Health 2018, 15, 1977. [CrossRef] [PubMed]
22. Buckley, R.; Brough, P.; Hague, L.; Chauvenet, A.; Fleming, C.; Roche, E.; Sofija, E.; Harris, N. Economic
value of protected areas via visitor mental health. Nat. Commun. 2019, 10, 5005. [CrossRef] [PubMed]
23. Dudareva, N.; Negre, F.; Nagegowda, D.A.; Orlova, I. Plant volatiles: Recent advances and future perspectives.
CRC Crit Rev. Plant Sci. 2006, 25, 417–440. [CrossRef]
24. Peñuelas, J.; Staudt, M. BVOCs and global change. Trends Plant Sci. 2010, 15, 133–144. [CrossRef] [PubMed]
25. Loreto, F.; Dicke, M.; Schnitzler, J.P.; Turlings, T.C.J. Plant volatiles and the environment. Plant Cell Environ.
2014, 37, 1905–1908. [CrossRef]
26. Laothawornkitkul, J.; Taylor, J.E.; Paul, N.D.; Hewitt, C.N. Biogenic volatile organic compounds in the Earth
system. New Phytol. 2009, 183, 27–51. [CrossRef]
27. Guenther, A.B.; Jiang, X.; Heald, C.L.; Sakulyanontvittaya, T.; Duhl, T.; Emmons, L.K.; Wang, X. The model of
emissions of gases and aerosols from nature version 2.1 (MEGAN2.1): An extended and updated framework
for modeling biogenic emissions. Geosci. Model Dev. 2012, 5, 1471–1492. [CrossRef]

Int. J. Environ. Res. Public Health 2019, 16, 4915
24 of 24
28. Šimpraga, M.; Ghimire, R.P.; Van Der Straeten, D.; Blande, J.D.; Kasurinen, A.; Sorvari, J.; Holopainen, T.;
Adriaenssens, S.; Holopainen, J.K.; Kivimäenpää, M. Unravelling the functions of biogenic volatiles in boreal
and temperate forest ecosystems. Eur. J. For. Res. 2019. [CrossRef]
29. Sumitomo, K.; Akutsu, H.; Fukuyama, S.; Minoshima, A.; Kukita, S.; Yamamura, Y.; Sato, Y.; Hayasaka, T.;
Osanai, S.; Funakoshi, H.; et al. Conifer-Derived monoterpenes and forest walking. Mass Spectrom. 2015, 4,
A0042. [CrossRef]
30. Loreto, F.; Bagnoli, F.; Fineschi, S. One species, many terpenes: Matching chemical and biological diversity.
Trends Plant Sci. 2009, 14, 416–420. [CrossRef]
31. Niinemets, Ü.; Loreto, F.; Reichstein, M. Physiological and physicochemical controls on foliar volatile organic
compound emissions. Trends Plant Sci. 2004, 9, 180–186. [CrossRef] [PubMed]
32. Loreto, F.; Schnitzler, J.P. Abiotic stresses and induced BVOCs. Trends Plant Sci. 2010, 15, 154–166. [CrossRef]
[PubMed]
33. Tingey, D.T.; Manning, M.; Grothaus, L.C.; Burns, W.F. Influence of light and temperature on isoprene
emission rates from slash pine. Physiol. Plant 1980, 65, 797–801. [CrossRef] [PubMed]
34. Staudt, M.; Bourgeois, I.; Al Halabi, R.; Song, W.; Williams, J. New insights into the parametrization of
temperature and light responses of mono - and sesquiterpene emissions from Aleppo pine and rosemary.
Atmos. Environ. 2017, 152, 212–221. [CrossRef]
35. Mäki, M.; Aalto, J.; Hellén, H.; Pihlatie, M.; Bäck, J. Interannual and seasonal dynamics of volatile organic
compound fluxes from the boreal forest floor. Front. Plant Sci. 2019, 10, 1–14. [CrossRef]
36. Park, J.H.; Park, S.H.; Lee, H.J.; Kang, J.W.; Lee, K.M.; Yeon, P.S. Study on NVOCs concentration characteristics
by season, time and climatic factors: Focused on pinus densiflora forest in national center for forest therapy.
J. People Plants Environ. 2018, 21, 403–409. [CrossRef]
37. Zängl, G. An improved method for computing horizontal diffusion in a sigma-coordinate model and its
application to simulations over mountainous topography. Mon. Weather Rev. 2002, 130, 1423–1432. [CrossRef]
38. Stull, R.B. An Introduction to Boundary Layer Meteorology; Springer: Dordrecht, The Netherlands, 1988;
ISBN 978-90-277-2769-5.
39. Cho, K.S.; Lim, Y.-R.; Lee, K.; Lee, J.; Lee, J.H.; Lee, I.-S. Terpenes from forests and human health. Toxicol. Res.
2017, 33, 97–106. [CrossRef]
© 2019 by the authors. Licensee MDPI, Basel, Switzerland. This article is an open access
article distributed under the terms and conditions of the Creative Commons Attribution
(CC BY) license (http://creativecommons.org/licenses/by/4.0/).