

International Journal of
Environmental Research
and Public Health
Article
The Effects of a Campus Forest-Walking Program on
Undergraduate and Graduate Students’ Physical and
Psychological Health
Kyung-Sook Bang 1 , Insook Lee 1, Sungjae Kim 1, Chun Soo Lim 2, Hee-Kyung Joh 3,4,5,
Bum-Jin Park 6 and Min Kyung Song 7,*
1 College of Nursing, The Research Institute of Nursing Science, Seoul National University, Seoul 03080,
Korea; ksbang@snu.ac.kr (K.-S.B.); lisook@snu.ac.kr (I.L.); sungjae@snu.ac.kr (S.K.)
2 Department of Internal Medicine, Seoul National University College of Medicine, Seoul 03080, Korea;
cslimjy@snu.ac.kr
3 Department of Medicine, Seoul National University College of Medicine, Seoul 03080, Korea;
hkjoh@snu.ac.kr
4 Department of Family Medicine, Seoul National University Health Service Center, Seoul 08826, Korea
5 Department of Family Medicine, Seoul National University Hospital, Seoul 03080, Korea
6 Department of Environment and Forest Resources, College of Agriculture and Life Sciences,
Chungnam National University, Daejeon 34134, Korea; bjpark@cnu.ac.kr
7 College of Nursing, Seoul National University, Seoul 03080, Korea
* Correspondence: mk0408@snu.ac.kr; Tel.: +82-2-740-8467
Academic Editors: William C. Sullivan and Chun-Yen Chang
Received: 25 April 2017; Accepted: 30 June 2017; Published: 5 July 2017
Abstract: We conducted a campus forest-walking program targeting university and graduate
students during their lunchtime and examined the physical and psychological effects of the
program. We utilized a quasi-experimental design with a control group and a pretest–posttest
design. Forty-seven men (M = 25.5 ± 3.8 years) and 52 women (M = 23.3 ± 4.3 years) volunteered to
participate (experimental group n = 51, control group n = 48). The intervention group participated
in campus forest-walking program once a week for six weeks; they were also asked to walk once a
week additionally on an individual basis. Additionally, participants received one lecture on stress
management. Post-tests were conducted both just after the program ended and three months after.
A chi-square test, t-test, and repeated measures analysis of variance were used to evaluate the effects
of the program. Health promoting behaviors (F = 7.27, p = 0.001, ES = 0.27) and parasympathetic
nerve activity (F = 3.69, p = 0.027, ES = 0.20) significantly increased and depression (F = 3.15, p = 0.045,
ES = 0.18) significantly decreased in the experimental group after the intervention compared to the
control group. In conclusion, using the campus walking program to target students during their
lunchtime is an efficient strategy to promote their physical and psychological health.
Keywords: forests; walking; health promotion; body composition; depression; college students
1. Introduction
One of the most important public health problems today is individuals’ lack of physical activity [1].
The World Health Organization has recommended that adults aged 18–64 years should do at least
150 min of moderate-intensity aerobic physical activity or at least 75 min of vigorous-intensity aerobic
physical activity or an equivalent combination of moderate- and vigorous-intensity activity throughout
the week [2]. The benefits of physical activity include lowering the rates of all-cause mortality, coronary
heart disease, high blood pressure, stroke, type-2 diabetes, metabolic syndrome, and depression [3].
Int. J. Environ. Res. Public Health 2017, 14, 728; doi:10.3390/ijerph14070728
www.mdpi.com/journal/ijerph

Int. J. Environ. Res. Public Health 2017, 14, 728
2 of 13
The college years are a time of transition from adolescence to adulthood [4], and usually involve
students obtaining independence from their parents. The college years are also a crucial time for health
promotion, disease prevention, and forming lifestyle patterns for later life [5,6]. College students
are hopefully of optimal health and well-being; however, they are exposed to several health risk
factors including irregular sleep patterns, personal relationship changes, overdrinking, and academic
pressures [7], and they experience a large amount of stress, anxiety, and depression [8]. According to
repeated previous studies, approximately 50% of college students experience significant levels of
stress, anxiety, or depression, or both [9]. A study of 5245 Chinese university students found that
older students were sensitive to depression compared to younger students because older students
face more stressful events, such as employment, economic, graduation, and marriage pressures [10].
Moreover, students with mental health problems show poor relationships with other students, low
grade averages, low rates of graduation, and a high incidence of suicide or self-harm behavior [11,12].
In addition, many students are at an elevated risk of metabolic syndrome caused by a lack of exercise
and excessive drinking [13]. Therefore, the mental health of college students including stress, anxiety,
and depression and their exercise habits are significant issues.
Although there has been a growing interest in health promotion, it is not easy for university
students to maintain an appropriate level of physical activity because their academic responsibilities
are often recognized as being more important. Lunchtime is a common ‘break’ for college students,
and partaking in physical activity during lunchtime may help increase overall activity levels [14].
Walking is a universal, convenient, familiar, and free-form physical activity that has diverse health
benefits and a low injury risk [15]. Recently, more people have become interested in health habits
such as maintaining a healthy diet, exercising, and partaking in outdoor activities. Walking improves
several markers of cardiovascular risk, including aerobic capacity, systolic and diastolic blood pressure,
waist circumference, body fat percentage, and body mass index [16].
Walking in the forest has especially been found to have more positive effects on physical and
psychological health than walking in the city [17,18]. The natural environment is increasingly
recognized as an effective counter to urban stress [19]. Higher accessibility to parks or forests is
associated with higher happiness and a better mood as well as less stress, anger, and depression [20].
Many studies have examined the effect of this ‘forest therapy’ on human health. They have
revealed many beneficial effects such as lowering blood pressure in hypertension patients, decreasing
sympathetic nerve activity, enhancing parasympathetic nerve activity, and the activation of natural
killer cells [21–24]. Forest walking has also been shown to significantly increase people’s positive
emotions and decrease their negative emotions compared with activities in urban areas [25,26].
This study utilized the Information–Motivation–Behavioral skills (IMB) model to design the
intervention to promote physical and mental health. The IMB model has received considerable
attention because it not only provides a relatively simple explanation for complex health behaviors,
but also identifies constructs (including information, motivation, and behavioral skills) that are needed
for successful self-management or adherence [27]. The IMB model, proposed by Fisher and Fisher
to explain human immunodeficiency virus (HIV) related behaviors, recognizes three constructs:
information, motivation, and behavioral skills as specific individual determinants of behavior and
behavioral change [28,29]. According to this theory, changing not only the physical environment, but
also attitudes and behaviors toward health are required for one’s health. In addition, it is necessary
to provide information based on scientific data and motivation to increase interest in health. Using
this IMB model as the conceptual framework of the campus forest-walking program for students, it is
possible to develop systematic interventions to promote health.
To date, however, studies on the effects of forest walking for college students who suffer from
elevated levels of stress are limited. Additionally, few studies have used robust data collection
methods to measure the impact of on-campus interventions on college students’ physical activity
levels, mental health, and health biomarkers. Therefore, this study identified the effects of an
on-campus, forest-walking program for college students and included both objective and subjective
Int. J. Environ. Res. Public Health 2017, 14, 728
3 of 13
measures such as physical activity level; health promoting behavior; and physical, physiological,
and psychological biomarkers of health [28,29]. The specific research questions for the study were as
follows: Does the six-week campus walk program reduce depression and improve relaxation among
college and graduate students? Does this program improve the health promotion behavior and increase
physical activity of the students? We will test the following four hypotheses in this study:
1. The experimental group participating in the program will display a higher score on health
promoting behaviors than the control group will.
2. The experimental group will display a lower depression score than the control group will.
3. The experimental group will display more parasympathetic nerve activity than the control
group will.
4. The physical health (i.e., bone density, blood lipid profile, and body mass index) of the
experimental group will be better than that of the control group.
2. Methods
2.1. Study Design and Participants
This was a quasi-experimental study with a control group and a pretest–posttest design. The study
occurred from September 2014 to February 2015 (from fall to the end of winter). For the intervention
group, the campus forest-walking program was provided for six weeks, and the effects of the program
regarding participants’ physical and mental health were analyzed. The pre-test took place about a
week before the intervention started, the post-test was conducted one week after the final program,
and the follow-up test was conducted after another three months.
Participants comprised graduate and undergraduate students from one university in Seoul,
South Korea. Participants were recruited by posting notices using the university homepage and
sending an e-mail to all students from the university health service center. Students who had medical
contraindications to exercise by self-report (e.g., asthma, painful osteoarthritis, or heart conditions)
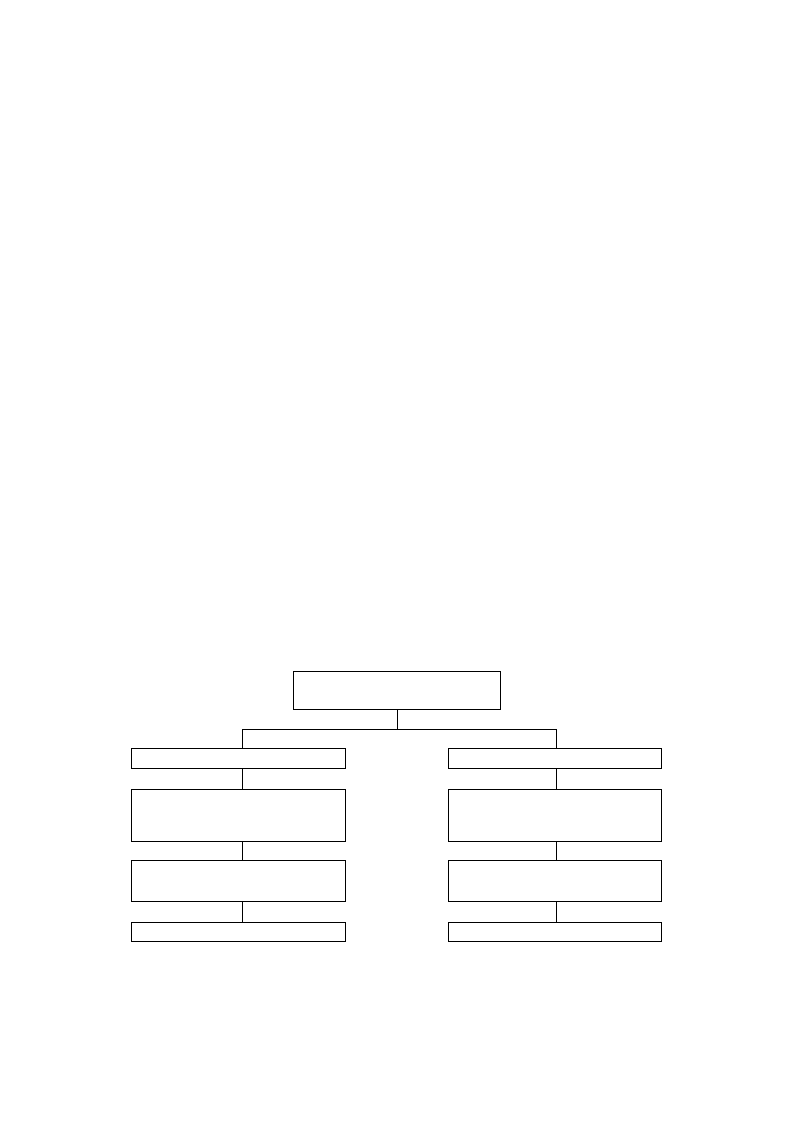
were excluded [30]. One-hundred and eighteen students voluntarily participated in this study. To
increase motivation, group assignment (experimental or control) was made per participants’ preference
(Figure 1).
Enrollment by self-participation (N = 118)
Allocated to intervention group (n = 60)
Allocated to control group (n = 58)
The campus forest-walking program
for 6 weeks. Three participants withdrew:
Leg fracture (n = 1)
Change in lecture schedule (n = 2)
Post-test (1 week after the final program)
Follow-up test (after another 3 month)
Did not complete follow-up test (n = 6)
Daily routine
for 6 weeks
Post-test (1 week after the final program)
Follow-up test (after another 3 month)
Did not complete follow-up test (n = 10)
Analyzed (n = 51)
Figure 1. Recruitment of participants
Figure 1. Recruitment of participants.
Analyzed (n = 48)
This study was conducted in accordance with the Declaration of Helsinki and was approved
by the Ethics Committee of the Institutional Review Board at Seoul National University in Seoul,
Int. J. Environ. Res. Public Health 2017, 14, 728
4 of 13
Republic of Korea (IRB No. 1409/001-001). Before beginning the study, a full explanation about
the research purpose, the experimental procedure, and all measurement indices were provided to
participants. Those who agreed to participate were selected as study participants who provided full
written consent for taking part in the program (experimental group n = 60, control group n = 58).
Three of the participants withdrew their participation during the study period. Sixteen participants
did not complete the follow-up test because of employment, birth, a heavy schedule, or refusal.
2.2. Intervention
The six-week campus forest-walking program was conducted once a week during lunch.
The university campus where the program was implemented is located just northwest of the mountain
Gwanack and has many different trees. In addition, there are forest roads and trails near the campus.
The information consisted of lectures on stress management and providing leaflets related to
mental and physical health. We sent a text message to promote voluntarily walking once a week.
Health leaflets about the effects of forest therapy; the correct walking method; and self-efficacy for
walking, stress management, and depression management were provided at the first session of the
program. In addition, participants in the experimental group were provided with a wearable activity
tracker, Fitbit Zip® (Fitbit Inc., San Francisco, CA, USA), which allowed them to self-monitor their
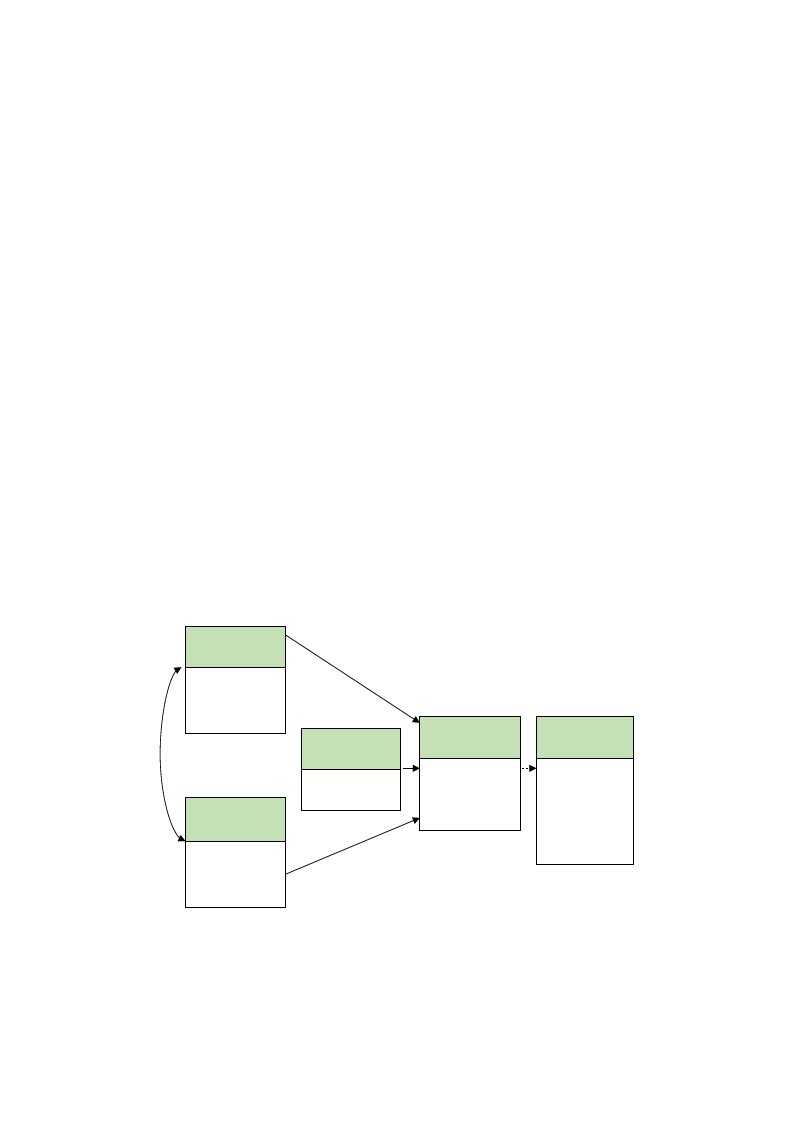
physical activity (Figure 2).
The intervention was provided from September to October 2014, once a week during lunchtime
or for one hour on Wednesdays at 4 p.m., depending on participants’ preferred schedule. Participants
in the experimental group walked together in the campus forest at a relaxed pace for about 40 min,
with a 10 min rest during the walk, and had a light meal (e.g., sandwich) during the walk.
During the intervention period, we also provided one lecture on stress management. The average
group size was 10 (not more than 15). They were also encouraged through a text message to additionally
walk at least once a week at their leisure. The control group did not receive leaflets, lectures, or a
wearable activity tracker and were asked to follow their routine activity during the study period.
The intervention group and control group were asked to participate in pre-, post-, and follow-up tests.
Health behavior
information
- Health information
leaflet
- Lecture on stress
management
Health behavior
motivation
- Wearable
activity
Tracker
- Text message
Health behavior
skill
Campus
forest-walking
Health behavior
- Physical activity
- Health
promoting
behavior
Health outcome
- Body
composition
analysis
-Bone density
-Cholesterol
-HRV
- Depression
Figure 2. The conceptual model of the campus forest-walking program
Figure 2. The conceptual model of the campus forest-walking program.
2.3. Measurements
Questionnaires were administered to investigate demographic data, health promoting behavior,
physical activity level, and depression. Demographic data included age, sex, and academic year.

Int. J. Environ. Res. Public Health 2017, 14, 728
5 of 13
Health promoting behavior was assessed using the Korean translation of the Health-Promoting
Lifestyle Profile II (HPLP-II) [31]. The HPLP-II is a 50-item measure; answers are provided using
a four-point Likert scale based on Pender’s health promotion model, which contains six subscales:
responsibility for health, physical activity, healthy nutrition, social relations, stress management, and
spiritual growth. The total scores of the HPLP-II range from 50 to 200, with a higher score indicating
a better health-promoting lifestyle. The Cronbach’s α for the total instrument was 0.92 and the
six subscales ranged from 0.65 to 0.82 [26]. In this study, the Cronbach’s α = 0.91 and the six subscales
ranged from 0.70 to 0.87.
Physical activity was measured using the International Physical Activity Questionnaire-Short
Form, which provides a measure of total physical activity accrued through work and leisure in all
settings combined. Participants were asked about frequency and duration of exercise by indicating
days and time spent doing vigorous and moderate activities, walking, and sitting in the last seven
days. These activity categories may be treated separately to obtain the specific activity patterns or
multiplied by their estimated value in Metabolic Equivalent of Tasks (MET) and summed to gain an
overall estimate of physical activity in a week.
• Walking MET-minutes/week = 3.3 × walking minutes × walking days
• Moderate MET-minutes/week = 4.0 × moderate-intensity activity minutes × moderate days
• Vigorous MET-minutes/week = 8.0 × vigorous-intensity activity minutes ×
vigorous-intensity days.
Total physical activity MET-min/week, which can be calculated as the sum of walking + normal +
active MET-minutes/week scores [32], was used for the analysis.
Depression level was measured using the Beck Depression Inventory. It is composed of 21 items
and is answered using a four-point (0–3) Likert scale. The total sum of the item scores ranged from 0 to
63, with higher total scores indicating more severe depressive symptoms.
Height and weight were measured with an automatic stadiometer (BSM 370, Inbody Co., Ltd.,
Seoul, Korea). Body composition was assessed including amount of body fat, body fat percentage,
body mass index, skeletal muscle mass, and amount of muscle by body composition analyzer (Inbody
570, Inbody Co.). After 10 min of resting, blood pressure was measured. Bone density was measured
at the right calcaneus bone using broadband ultrasound attenuation (Sonost 3000, OsteoSys Co., Ltd.,
Seoul, Korea). In general, bone density indicates the value with a t-score. “−1 and above” the t-score
is normal; “−2.5 to −1” means osteopenia, a condition where the bone density is below normal, which
may lead to osteoporosis; and “−2.5 or below” means osteoporosis [33].
Heart Rate Variability (HRV) was measured using a portable electrocardiograph (LXC3203,
LAXTHA Inc., Daejeon, Korea). HRV data were obtained at various frequency bands using an HRV
software tool (TeleScan, LAXTHA Inc., Daejeon, Korea). After 10 min of resting, HRV was measured.
A heart rate monitor using unipolar limb lead electrocardiogram (ECG) recorder was used to collect
continuous RR intervals, which were stored on computer for later analysis. It took approximately
5 min to measure this. Among commonly used HRV indices, the low-frequency (LF: 0.04–0.15 Hz)
power of the HRV Fourier spectrum has been presumed to reflect some aspects of cardiac sympathetic
modulation, and the ratio of LF power to high-frequency (HF: 0.15–0.40 Hz) power (LF/HF ratio)
indicates the sympathovagal balance [34]. Parasympathetic nerve activity is high when participants
are calm. It is widely used to measure the mediation effect of mind and body relaxation [35].
Blood samples were taken to determine fasting serum total cholesterol, low-density lipoprotein
cholesterol, high-density lipoprotein cholesterol, and triglyceride. Participants were asked not to
eat or drink for 12 h before testing. One laboratory determined all blood biochemistry parameters
(Green Cross Laboratories, Gyeonggi-do, Korea).

Int. J. Environ. Res. Public Health 2017, 14, 728
6 of 13
2.4. Statistics
Statistical analyses were performed using a Windows-Based Statistical Package version
22.0 software (SPSS, Chicago, IL, USA). Descriptive statistics comprised mean, standard
deviation, frequency, and percentage to present demographic information and outcome variables.
An independent t-test and χ2 test were conducted to test homogeneity at baseline between the
experimental and control groups. For this study, a repeated-measures analysis of variance (rmANOVA)
was used to analyze the effects of intervention directly after the program and three months later.
All statistical tests were two-tailed and a p-value < 0.05 was considered statistically significant.
3. Results
3.1. Homogeneity Test of the Experimental and Control Group
Participants’ mean age was 24.3 ± 4.19 years. A homogeneity test of the general characteristics
between the experimental and control groups in pretest showed no significant difference (Table 1).
Table 1. Homogeneity test of participants’ general characteristics and outcome variables during the
pre-test (N = 99).
Characteristics/Variables
Categories
Exp. (n = 51)
n (%)
M ± SD
Cont. (n = 48)
n (%)
M ± SD
x2 or t
p
Age (years)
24.8 ± 4.66
23.8 ± 3.60
1.29 0.201
Sex
Male
Female
26 (51.0)
25 (49.0)
21 (43.8)
27 (56.3)
0.518 0.548
College standing
Undergraduate
Graduate
23 (45.1)
28 (54.9)
23 (47.9)
25 (52.1)
0.079 0.842
Blood pressure (mmHg)
Systolic BP
Diastolic BP
111.55 ± 11.45
68.47 ± 9.64
107.85 ± 11.87
67.54 ± 7.83
1.58 0.118
0.52 0.601
Blood cholesterol (mg/dL)
Cholesterol, total
HDL
LDL
TG
176.59 ± 31.79
65.06 ± 15.20
103.49 ± 29.01
76.92 ± 42.46
176.25 ± 30.73
68.58 ± 14.07
97.75 ± 26.91
71.90 ± 35.53
0.05
−1.20
1.02
0.64
0.957
0.235
0.311
0.526
Bone density, t-score
−0.83 ± 0.92
−0.90 ± 1.05
0.33 0.743
BMI (kg/m2)
21.91 ± 2.87
21.40 ± 2.77
0.89 0.375
Body composition
Percent of body fat (%)
Amount of muscle (kg)
Skeletal muscle mass (kg)
24.09 ± 6.79
44.28 ± 9.39
26.03 ± 6.04
23.47 ± 6.38
42.33 ± 8.89
24.74 ± 5.75
0.47 0.637
1.06 0.290
1.09 0.280
Physical activity level (MET-min/week)
1627.87 ± 1620.76 1758.23 ± 1228.39 −0.45 0.655
Health promoting behavior
126.25 ± 17.80
126.44 ± 18.46
−0.05 0.960
Heart rate variability
LF/HF ratio
Parasympathetic nerve activity (%)
2.03 ± 1.59
56.27 ± 9.34
2.21 ± 2.15
55.88 ± 10.29
−0.47 0.636
0.20 0.846
Depression
7.86 ± 5.40
7.50 ± 5.34
0.34 0.738
Exp.: experimental group; Cont.: control group; M: mean; SD: standard deviation; BP: blood pressure; LF:
low-frequency; HF: high-frequency; HDL: high-density lipoprotein; LDL: low-density lipoprotein; TG: triglyceride;
BMI: body mass index; MET: metabolic equivalent of tasks.
3.2. Effects of the Intervention on Outcome Measures
To analyze the effect of the intervention, a rmANOVA and Mauchly’s test of sphericity were used.
Mauchly’s test for sphericity, a test of homogeneity of variance, tests the null hypothesis (p > 0.05) that
the differences between variances comparing all possible pairs of groups are equal. In those cases,
when the null hypothesis is not true (e.g., high-density lipoprotein (HDL), low-density lipoprotein
(LDL), Bone density, body mass index (BMI), low frequency/high frequency (LF/HF) ratio), we used a
multivariate analysis of variance (MANOVA) [36].
The interaction effect of group (experimental and control) and time (pre-intervention,
post-intervention, and three-months after the intervention) were tested. Mean scores of physical
Int. J. Environ. Res. Public Health 2017, 14, 728
7 of 13
activity level and health promoting behavior for experimental and control groups are presented in
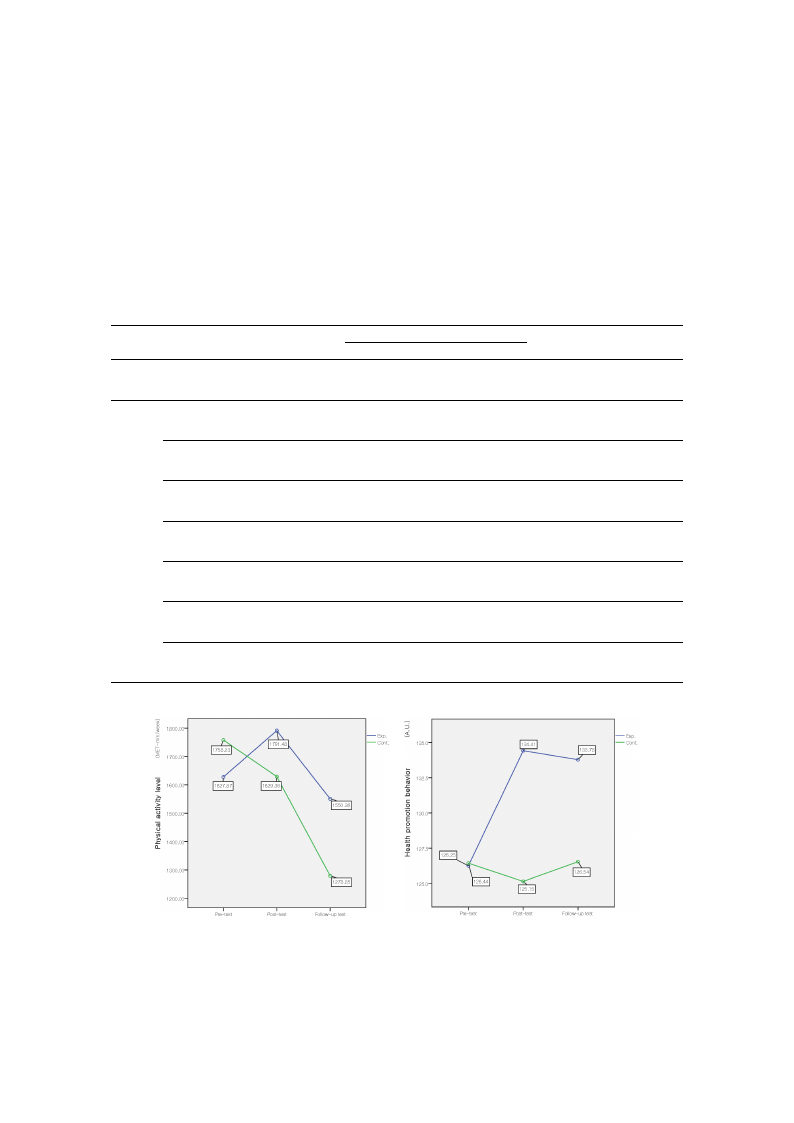
Table 2 and Figure 3. The results of the repeated measure ANOVA showed that there was a significant
group × time effect for the health promoting behavior (F = 7.27, p = 0.001, ES = 0.27). Among the six
subscales of health promoting behavior, there were significant group × time effects for physical activity
(F = 5.91, p = 0.003, ES = 0.25), healthy nutrition (F = 3.64, p = 0.028, ES = 0.19), stress management (F =
3.32, p = 0.038, ES = 0.18), and spiritual growth (F = 3.14, p = 0.045, ES = 0.18). There was a significant
difference in health promoting behavior in the time by group interaction effect; however, no interaction
effect was found for physical activity level.
Table 2. Group comparisons of health promotion behavior and physical activity at pre-, post-, and
follow-up test.
Variables
Time
Exp.
Cont.
M ± SD
Physical activity level (MET-min/week)
Pre-test
Post-test
F/U test
1627.87 ± 1620.76
1791.48 ± 1434.68
1550.36 ± 1310.35
1758.23 ± 1228.39
1629.36 ± 1270.70
1278.85 ± 1333.96
Sum
Pre-test
Post-test
F/U test
126.26 ± 7.80
134.41 ± 15.87
133.78 ± 18.15
126.44 ± 18.46
125.15 ± 20.12
126.54 ± 20.11
Responsibility for health
Pre-test
Post-test
F/U test
17.61 ± 4.41
18.96 ± 4.48
18.88 ± 4.57
16.85 ± 4.18
17.33 ± 4.23
17.63 ± 4.20
Health
promoting
behavior
Physical activity
Healthy nutrition
Pre-test
Post-test
F/U test
Pre-test
Post-test
F/U test
18.47 ± 5.54
21.00 ± 4.76
20.65 ± 5.09
21.59 ± 4.75
22.31 ± 4.18
22.45 ± 4.58
19.19 ± 6.11
18.94 ± 6.12
18.54 ± 5.95
21.94 ± 5.23
20.96 ± 5.59
21.31 ± 5.71
Social relations
Pre-test
Post-test
F/U test
23.80 ± 4.54
24.75 ± 4.02
24.35 ± 3.88
24.06 ± 3.86
24.02 ± 3.83
24.13 ± 3.87
Stress management
Pre-test
Post-test
F/U test
18.43 ± 3.89
20.18 ± 2.96
20.49 ± 3.51
18.00 ± 3.50
18.13 ± 4.08
19.11 ± 3.57
Spiritual growth
Pre-test
Post-test
F/U test
26.35 ± 4.58
27.22 ± 4.29
26.96 ± 4.49
26.50 ± 4.89
25.85 ± 4.93
25.98 ± 4.68
G: group; T: time; F/U: follow up; ES: effect size.
Source
G
T
G*T
G
T
G*T
G
T
G*T
G
T
G*T
G
T
G*T
G
T
G*T
G
T
G*T
G
T
G*T
F
p
ES
0.19 0.661 0.04
3.01 0.047 0.18
1.21 0.300 0.11
2.58 0.112 0.16
5.19 0.006 0.23
7.27 0.001 0.27
2.32 0.131 0.15
6.40 0.002 0.26
0.97 0.380 0.33
1.36 0.247 0.12
3.05 0.050 0.18
5.91 0.003 0.25
0.59 0.443 0.08
0.26 0.775 0.06
3.64 0.028 0.19
0.10 0.754 0.03
1.27 0.282 0.11
1.46 0.235 0.12
4.18 0.044 0.21
12.73 0.000 0.36
3.32 0.038 0.18
0.72 0.398 0.08
0.06 0.941 0.03
3.14 0.45 0.18
(a)
(b)
Figure 3. Comparison of the mean physical activity level (A) and health promotion behavior score (B)
between the experimental and control groups at pre-, post-, and follow-up test. Exp.: experimental
group; Cont.: control group; A.U.: arbitrary units.
Int. J. Environ. Res. Public Health 2017, 14, 728
8 of 13
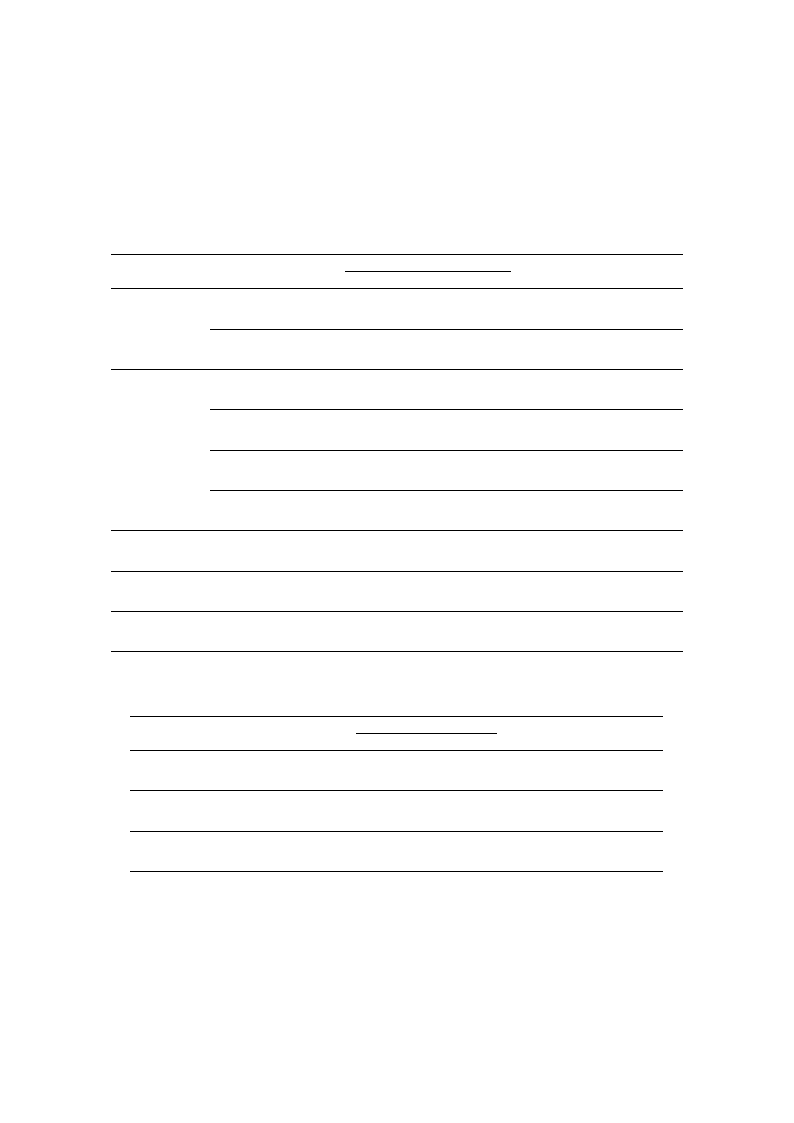
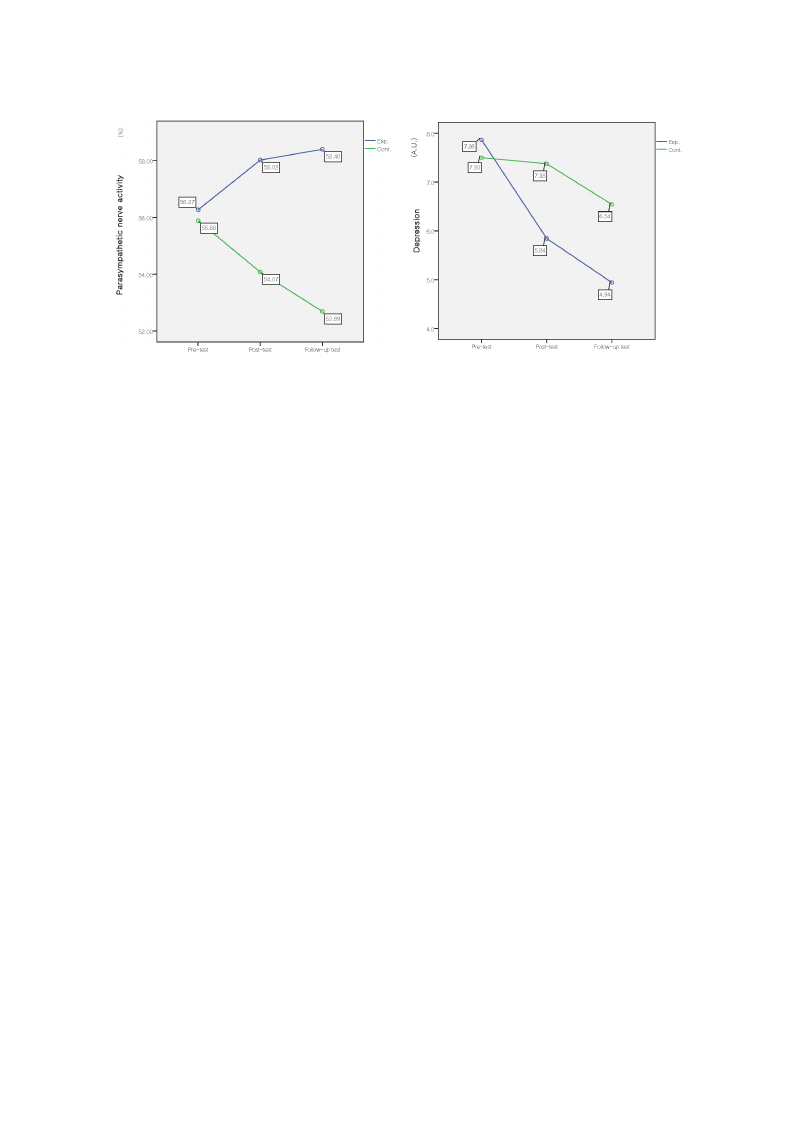
For physiological measures, only the body fat percentage showed a significant interaction effect
(F = 3.41, p = 0.035, ES = 0.19). Concerning HRV, the interaction effect for parasympathetic nerve activity
was significant (F = 3.69, p = 0.027, ES = 0.20). For psychological subjective measures, depression
showed a significant interaction effect of time by group (F = 3.15, p = 0.045, ES = 0.18), (Tables 3 and 4,
Figure 4).
Table 3. Group comparisons of physiological health at pre-, post-, and follow-up test.
Variables
Time
Exp.
Cont.
M ± SD
Source
F
p
ES
BP (mmHg)
Systolic
Diastolic
Pre-test
Post-test
F/U test
Pre-test
Post-test
F/U test
111.55 ± 11.45
112.02 ± 11.92
114.08 ± 12.58
68.47 ± 9.64
69.29 ± 8.98
68.39 ± 8.01
107.85 ± 11.87
110.56 ± 11.62
113.21 ± 11.74
67.54 ± 7.83
66.63 ± 8.28
68.92 ± 7.36
Group
Time
G*T
Group
Time
G*T
0.92 0.339 0.10
7.83 0.001 0.28
1.11 0.333 0.11
0.60 0.441 0.08
0.37 0.694 0.06
1.55 0.215 0.13
Total
Pre-test
Post-test
F/U test
176.59 ± 31.79
175.69 ± 28.70
177.73 ± 29.53
176.25 ± 30.73
177.15 ± 27.80
181.50 ± 29.82
Group
Time
G*T
0.09 0.772 0.03
2.01 0.137 0.14
0.63 0.535 0.08
Cholesterol (mg/dL)
HDL *
Pre-test
Post-test
F/U test
65.06 ± 15.20
64.22 ± 14.65
64.82 ± 16.20
68.58 ± 14.07
65.81 ± 12.42
66.92 ± 15.63
Group
Time
G*T
0.80 0.375 0.09
1.86 0.161 0.20
0.46 0.635 0.10
LDL *
Pre-test
Post-test
F/U test
103.49 ± 29.01
100.84 ± 26.80
103.75 ± 26.70
97.75 ± 26.91
99.25 ± 22.70
104.69 ± 24.51
Group
Time
G*T
0.19 0.663 0.04
3.97 0.022 0.29
1.51 0.225 0.18
Pre-test
76.92 ± 42.46
71.90 ± 35.53 Group
0.07 0.790 0.03
TG
Post-test
80.24 ± 46.40
85.60 ± 55.16
Time
3.08 0.048 0.18
F/U test
73.59 ± 41.43
79.67 ± 45.16
G*T
1.53 0.220 0.13
Bone density, T-score *
Pre-test
Post-test
F/U test
−0.84 ± 0.92
−0.50 ± 0.96
−0.36 ± 0.94
−0.90 ± 1.05
−0.55 ± 1.03
−0.57 ± 0.91
Group
Time
G*T
0.33 0.565 0.05
27.04 0.000 0.75
1.52 0.224 0.18
BMI (kg/m2) *
Pre-test
Post-test
F/U test
21.91 ± 2.87
22.07 ± 2.91
21.99 ± 2.84
21.40 ± 2.77
21.47 ± 2.81
21.67 ± 3.04
Group
Time
G*T
0.69 0.407 0.08
2.61 0.079 0.23
1.94 0.147 0.20
Percent of body fat (%)
Pre-test
Post-test
F/U test
24.09 ± 6.79
24.42 ± 6.52
23.73 ± 6.58
23.47 ± 6.38
22.91 ± 6.96
23.33 ± 6.95
Group
Time
G*T
0.41 0.524 0.06
0.62 0.540 0.08
3.41 0.035 0.19
Note: * Multivariate test statistics (MANOVA), Wilks’ λ, because the assumption of spherical formation was violated.
Table 4. Group comparisons of psychological health at pre-, post-, and follow-up test.
Variables
Time
Exp.
Cont.
M ± SD
Source
F
p
ES
LF/HF ratio *
Pre-test
Post-test
F/U test
2.03 ± 1.59
1.97 ± 1.85
1.63 ± 1.27
2.21 ± 2.15
1.85 ± 1.27
2.07 ± 1.76
Group 0.363 0.548 0.06
Time 1.139 0.324 0.15
G*T 1.867 0.160 0.20
Pre-test 56.27 ± 9.34 55.88 ± 10.29 Group 4.11 0.045 0.21
Parasympathetic nerve activity (%) Post-test 58.02 ± 9.20 54.07 ± 10.43 Time 0.18 0.836 0.04
F/U test 58.40 ± 8.74 52.69 ± 11.90
G*T
3.69 0.027 0.20
Depression
Pre-test
Post-test
F/U test
7.86 ± 5.40
5.84 ± 5.00
4.94 ± 4.82
7.50 ± 5.34
7.38 ± 6.02
6.54 ± 5.89
Group 0.92 0.340 0.10
Time 9.59 0.000 0.31
G*T
3.15 0.045 0.18
* Multivariate test statistics (MANOVA), Wilks’ λ, because the assumption of spherical formation was violated.
(a)
Int. J. Environ. Res. Public Health 2017, 14, 728
(b)
9 of 13
(a)
(b)
Figure 4. Comparison of the parasympathetic nerve activity (A) and mean depression score (B) between
the experimental and control groups in pre-, post-, and follow-up tests.
4. Discussion
We evaluated the effects of an on-campus, forest-walking program on the physical and
psychological health of undergraduate and graduate students. Pre-, post-, and follow-up variables
were measured to compare an experimental group and a control group.
Participants in the intervention group had a higher score on health promoting behavior than
the control group did, especially physical activity, health nutrition, stress management, and spiritual
growth scores among the six subscales. This is consistent with the effect of resistance band exercise
(low intensity exercise) among nursing students [37]. Although the campus forest-walking program
was a low intensity activity for six weeks, it provided the opportunity to be motivated by periodic
group walking, self-monitoring, and concentrating on health. It is meaningful that this intervention
positively affected the health-promotion behavior of participants—including a healthy diet, physical
activity, stress management, and spiritual growth—because this will subsequently lead to better
lifestyle. The pleasant experience of forest walking increased participants’ interest in health care, and
the stress management education may have influenced this positive effect.
In this study, the campus forest-walking program had no significant effect on physical activity
level. Moreover, physical activity level decreased in both groups at the three-month follow-up, and
significant differences were only shown for the time variable. The intervention program was provided
in the autumn (September to November 2014), a1nd the follow-up test was conducted at the end
of winter (February 2015). The wintry weather could affect the level of physical activity for both
groups. Therefore, the decrease in PA may have been affected by the timing of the program. Moreover,
because winter has fewer sunlight hours and disadvantageous weather conditions, physical activity
may be less convenient than it is in the summer [38]. Walking programs are known to be effective
in promoting physical activity. Therefore, we can consider various strategies for future research:
interventions tailored to people’s needs; targeting the most sedentary or the most motivated to change;
and intervening at either the individual, household, or group level [39].
The effectiveness on psychological health, which was shown with higher levels of parasympathetic
nerve activation and decreased depression, is the most noteworthy aspect of the forest-walking
intervention. The results of increased parasympathetic activity in the experimental group are consistent
with previous studies of physiological responses to the forest environment, suggesting that walking
in forests may provide health benefits of relaxation [35,40,41]. Numerous forest-walking studies
have shown the effects on relieving negative emotions such as anxiety and depression [17,18,42–44].
Walking in the forest has also been shown to be more effective on mental health than walking in the city

Int. J. Environ. Res. Public Health 2017, 14, 728
10 of 13
due to less environmental stress [45]. Young adults who walked for 50 min in nature after a stressful
situation showed reduced stress and anger and increased positive affect [46]. Our results add evidence
to the known positive effects of forest walking in increasing mental relaxation and reducing depression.
Therefore, forest walking could be a simple, accessible and low-cost strategy to improve physical and
mental health.
We acknowledge the limitations of this study. The limitations include the lack of randomization,
which may lead to selection bias. In addition, participants chose to take part either in the intervention
or control groups: attitudes, motivation, and personal factors might have caused a selection bias.
Participants were highly motivated and were willing to volunteer to be in the experimental group.
People who are highly motivated to change their behavior may be more inclined to take part in an
intervention and more likely to benefit from the intervention. Although the two groups did not seem to
differ significantly at baseline in relation to the measures, we did not control for personal orientation or
motivational processes; therefore, the findings may not be directly generalizable to all college students.
In addition, the intervention group was required to exercise on their own once a week. Although the
physical activity level was measured with a Fitbit, the Fitbit data were not evaluated. Additionally, we
did not know if within the intervention group some students engaged in self-walking more than others.
Social factors related to performing an activity with others could have played a role. Moreover, small
intervention groups were selected according to individuals’ schedules. While walking, participants
could see and ‘feel’ the forest without talking to each other or looking at a cell phone; however, we
cannot rule out the possibility that the nature of the program and meeting new people could have
affected the outcome. Finally, because the walking program was offered to participants once per week,
the frequency may be different from other intervention studies, which makes comparisons between
studies difficult.
Despite these limitations, our study has several notable strengths including the use of the
campus forest, which is easily accessible to students, and performing the program at lunch time,
which is convenient. In addition, the physiological and psychological results of this experiment
provide evidence for the physiological and psychological benefits of campus forests. Walking in the
campus forest reduced depression by increasing parasympathetic activity. In addition, we examined
participants at a three-month follow-up and included multiple outcome variables such as physiological
measures and self-reported measures.
5. Conclusions
This study showed that a six-week, on-campus, forest-walking program produced beneficial
changes in the physical and psychological health of undergraduate and graduate students.
The intervention significantly increased participants’ health promoting behavior and parasympathetic
nerve activity compared to the control group, as well as significantly decreasing depression.
Further research is needed to examine changes in exercise frequency and duration. A study with
a larger sample size is required to address the generalizability of the results. The random assignment
of participants and manipulating potential confounding factors of the intervention are also needed.
However, this study suggests a campus forest-walking program as a strategy to promote students’
physical and mental health, thereby contributing to the health promotion and a healthy culture among
university and graduate students. Therefore, students should be encouraged to take advantage of the
forest during their lunch hour as it may positively affect their quality of life.
Acknowledgments: This work was supported by SNU Brain Fusion Program of the Seoul National University
in 2014.
Author Contributions: Kyung-Sook Bang contributed towards the research design, intervention, data collection,
analysis, and writing the paper. Insook Lee contributed towards the research design, data analysis, and writing the
paper. Sungjae Kim contributed towards the intervention, data collection, and writing the paper. Chun Soo Lim
contributed towards the design, analysis of the data, and writing the paper. Hee-Kyung Joh contributed towards
the design, analysis of the data, and writing the paper. Bum-Jin Park contributed towards the design and

Int. J. Environ. Res. Public Health 2017, 14, 728
11 of 13
writing the paper. Min Kyung Song contributed towards the intervention, data collection, and writing the paper.
All authors read and approved the final manuscript.
Conflicts of Interest: The authors declare no conflict of interest. The founding sponsors had no role in the design
of the study; in the collection, analyses, or interpretation of data; in the writing of the manuscript, or in the
decision to publish the results.
References
1. Haskell, W.L.; Blair, S.N.; Hill, J.O. Physical activity: Health outcomes and importance for public health
policy. Prev. Med. 2009, 49, 280–282. [CrossRef] [PubMed]
2. World Health Organization. Global Recommendations on Physical Activity for Health; WHO Press: Geneva,
Switzerland, 2010. Available online: https://www.ncbi.nlm.nih.gov/books/NBK305057 (accessed on
3 January 2017).
3. Warburton, D.E.; Nicol, C.W.; Bredin, S.S. Health benefits of physical activity: The evidence. CMAJ 2006, 174,
801–809. [CrossRef] [PubMed]
4. Dinger, M.K.; Vesely, S.K. Relationships between physical activity and other health-related behaviors in a
representative sample of U.S. college students. Am. J. Health Educ. 2001, 32, 83–88. [CrossRef]
5. Nelson, M.C.; Story, M.; Larson, N.I.; Neumark-Sztainer, D.; Lytle, L.A. Emerging adulthood and college-aged
youth: An overlooked age for weight-related behavior change. Obesity 2008, 16, 2205–2211. [CrossRef]
[PubMed]
6. Reynolds, E.K.; Magidson, J.F.; Mayes, L.C.; Lejuez, C.W. Risk-taking behaviors across the transition
from adolescence to young adulthood. In Young Adult Mental Health; Grant, J.E., Potenza, M.N., Eds.;
Oxford University Press: New York, NY, USA, 2010; pp. 40–63. ISBN 978-0-19-533271-1.
7. Eisenberg, D.; Gollust, S.E.; Golberstein, E.; Hefner, J.L. Prevalence and correlates of depression, anxiety, and
suicidality among university students. Am. J. Orthopsychiatr. 2007, 77, 534–542. [CrossRef] [PubMed]
8. The American College Health Association. American College Health Association-National College Health
Assessment Spring 2007 Reference Group Data Report (abridged). J. Am. Coll. Health 2008, 56, 469–479.
[CrossRef]
9. Regehr, C.; Glancy, D.; Pitts, A. Interventions to reduce stress in university students: A review and
meta-analysis. J. Affect. Disord. 2013, 148, 1–11. [CrossRef] [PubMed]
10. Chen, L.; Wang, L.; Qiu, X.H.; Yang, X.X.; Qiao, Z.X.; Yang, Y.J.; Liang, Y. Depression among Chinese
university students: Prevalence and socio-demographic correlates. PLoS ONE 2013, 8, e58379. [CrossRef]
11. Byrd, D.R.; McKinney, K.J. Individual, interpersonal, and institutional level factors associated with the
mental health of college students. J. Am. Coll. Health 2012, 60, 185–193. [CrossRef] [PubMed]
12. Keyes, C.L.; Eisenberg, D.; Perry, G.S.; Dube, S.R.; Kroenke, K.; Dhingra, S.S. The relationship of level
of positive mental health with current mental disorders in predicting suicidal behavior and academic
impairment in college students. J. Am. Coll. Health 2012, 60, 126–133. [CrossRef] [PubMed]
13. Wallace, L.S.; Buckworth, J.; Kirby, T.E.; Sherman, W.M. Characteristics of exercise behavior among college
students: Application of social cognitive theory to predicting stage of change. Prev. Med. 2000, 31, 494–505.
[CrossRef] [PubMed]
14. Brown, D.K.; Barton, J.L.; Pretty, J.; Gladwell, V.F. Walks4work: Rationale and study design to investigate
walking at lunchtime in the workplace setting. BMC Public Health 2012, 12, 550. [CrossRef] [PubMed]
15. Audrey, S.; Cooper, A.R.; Hollingworth, W.; Metcalfe, C.; Procter, S.; Davis, A.; Campbell, R.; Gillison, F.;
Rodgers, S.E. Study protocol: The effectiveness and cost effectiveness of an employer-led intervention
to increase walking during the daily commute: The travel to work randomised controlled trial.
BMC Public Health 2015, 15, 154. [CrossRef] [PubMed]
16. Murtagh, E.M.; Nichols, L.; Mohammed, M.A.; Holder, R.; Nevill, A.M.; Murphy, M.H. The effect of walking
on risk factors for cardiovascular disease: An updated systematic review and meta-analysis of randomised
control trials. Prev. Med. 2015, 72, 34–43. [CrossRef] [PubMed]
17. Takayama, N.; Korpela, K.; Lee, J.; Morikawa, T.; Tsunetsugu, Y.; Park, B.J.; Li, Q.; Tyrväinen, L.; Miyazaki, Y.;
Kagawa, T. Emotional, restorative and vitalizing effects of forest and urban environments at four sites in
Japan. Int. J. Environ. Res. Public Health 2014, 11, 7207–7230. [CrossRef] [PubMed]

Int. J. Environ. Res. Public Health 2017, 14, 728
12 of 13
18. Mao, G.X.; Lan, X.G.; Cao, Y.B.; Chen, Z.M.; He, Z.H.; Lv, Y.D.; Wang, Y.Z.; Hu, X.L.; Wang, G.F.; Yan, J.
Effects of short-term forest bathing on human health in a broad-leaved evergreen forest in Zhejiang province,
China. Biomed. Environ. Sci. 2012, 25, 317–324. [CrossRef] [PubMed]
19. Berto, R. The role of nature in coping with psycho-physiological stress: A literature review on restorativeness.
Behav. Sci. 2014, 4, 394–409. [CrossRef] [PubMed]
20. Van den Berg, A.E.; Koole, S.L.; van der Wulp, N.Y. Environmental preference and restoration: (How) Are
they related? J. Environ. Psychol. 2003, 23, 135–146. [CrossRef]
21. Lee, J.; Park, B.J.; Tsunetsugu, Y.; Kagawa, T.; Miyazaki, Y. Restorative effects of viewing real forest landscapes,
based on a comparison with urban landscapes. Scand. J. For. Res. 2009, 24, 227–234. [CrossRef]
22. Li, Q.; Kobayashi, M.; Inagaki, H.; Hirata, Y.; Li, Y.; Hirata, K.; Shimizu, T.; Suzuki, H.; Katsumata, M.;
Wakayama, Y. A day trip to a forest park increases human natural killer activity and the expression of
anti-cancer proteins in male subjects. J. Biol. Regul. Homeost. Agents 2010, 24, 157–165. [PubMed]
23. Park, B.J.; Tsunetsugu, Y.; Kasetani, T.; Morikawa, T.; Kagawa, T.; Miyazaki, Y. Physiological effects of forest
recreation in a young conifer forest in Hinokage town, Japan. Silva Fenn. 2009, 43, 291–301. [CrossRef]
24. Tsunetsugu, Y.; Lee, J.; Park, B.J.; Tyrväinen, L.; Kagawa, T.; Miyazaki, Y. Physiological and psychological
effects of viewing urban forest landscapes assessed by multiple measurements. Landsc. Urban Plan. 2013,
113, 90–93. [CrossRef]
25. Morita, E.; Fukuda, S.; Nagano, J.; Hamajima, N.; Yamamoto, H.; Iwai, Y.; Nakashima, T.; Ohira, H.;
Shirakawa, T. Psychological effects of forest environments on healthy adults: Shinrin-yoku (forest-air
bathing, walking) as a possible method of stress reduction. Public Health 2007, 121, 54–63. [CrossRef]
[PubMed]
26. Ochiai, H.; Ikei, H.; Song, C.; Kobayashi, M.; Takamatsu, A.; Miura, T.; Kagawa, T.; Li, Q.; Kumeda, S.;
Imai, M.; et al. Physiological and psychological effects of forest therapy on middle-aged males with
high-normal blood pressure. Int. J. Environ. Res. Public Health 2015, 12, 2532–2542. [CrossRef] [PubMed]
27. Deakin, T.; McShane, C.E.; Cade, J.E.; Williams, R. Group based training for self-management strategies in
people with type 2 diabetes mellitus. Cochrane Database Syst. Rev. 2005, 2, CD003417. [CrossRef]
28. Fisher, J.D.; Fisher, W.A.; Williams, S.S.; Malloy, T.E. Empirical tests of an information-motivation-behavioral
skills model of AIDS-preventive behavior with gay men and heterosexual university students. Health Psychol.
1994, 13, 238–250. [CrossRef] [PubMed]
29. Norton, W.E.; Amico, K.R.; Cornman, D.H.; Fisher, W.A.; Fisher, J.D. An agenda for advancing the science of
implementation of evidence-based HIV prevention interventions. AIDS Behav. 2009, 13, 424–429. [CrossRef]
[PubMed]
30. Pedersen, B.K.; Saltin, B. Evidence for prescribing exercise as therapy in chronic disease. Scand. J. Med.
Sci. Sports 2006, 16, 3–63. [CrossRef] [PubMed]
31. Seo, H.M.; Hah, Y.S. A study of factors influencing on health promoting lifestyle in the elderly-application of
Pender’s health promotion model. J. Korean Acad. Nurs. 2004, 34, 1288–1297. [CrossRef]
32. IPAQ Research Committee. Guidelines for Data Processing and Analysis of the International Physical
Activity Questionnaire (IPAQ)—Short and Long Forms. 2005. Available online: https://sites.google.com/
site/theipaq/ (accessed on 6 June 2017).
33. Seurer, A.; Huntington, M.K. Screening and treatment of osteoporosis. S. D. Med. 2015, 68, 497–501.
[PubMed]
34. Hayano, J. Heart rate variability (HRV). In Clinical Assessment of the Autonomic Nervous System; Iwase, S.,
Hayano, J., Orimo, S., Eds.; Springer: Tokyo, Japan, 2016; pp. 108–127. ISBN 978-4-431-56010-4.
35. Song, C.; Ikei, H.; Miyazaki, Y. Physiological effects of nature therapy: A review of the research in Japan.
Int. J. Environ. Res. Public Health 2016, 13, 781. [CrossRef] [PubMed]
36. Field, A. Discovering Statistics Using IBM SPSS Statistics, 4th ed.; Sage Publications: London, UK, 2013.
37. Baek, H.C.; Lee, S.J.; Shin, G.; Lim, E.J. Effect of resistance band exercise on body composition, physical
fitness and health promoting behavior in nursing students. J. Korean Public Health Nurs. 2014, 28, 310–319.
[CrossRef]
38. Tucker, P.; Gilliland, J. The effect of season and weather on physical activity: A systematic review. Public Health
2007, 121, 909–922. [CrossRef] [PubMed]
39. Ogilvie, D.; Foster, C.E.; Rothnie, H.; Cavill, N.; Hamilton, V.; Fitzsimons, C.F.; Mutrie, N. Interventions to
promote walking: Systematic review. BMJ 2007, 334, 1–10. [CrossRef] [PubMed]
Int. J. Environ. Res. Public Health 2017, 14, 728
13 of 13
40. Park, B.; Tsunetsugu, Y.; Ishii, H.; Furuhashi, S.; Hirano, H.; Kagawa, T.; Miyazaki, Y. Physiological effects of
Shinrin-yoku (taking in the atmosphere of the forest) in a mixed forest in Shinano Town, Japan. Scand. J.
For. Res. 2008, 23, 278–283. [CrossRef]
41. Tsunetsugu, Y.; Park, B.J.; Ishii, H.; Hirano, H.; Kagawa, T.; Miyazaki, Y. Physiological effects of Shinrin-yoku
(taking in the atmosphere of the forest) in an old-growth broadleaf forest in Yamagata Prefecture, Japan.
J. Physiol. Anthropol. 2007, 26, 135–142. [CrossRef] [PubMed]
42. Kim, W.; Lim, S.K.; Chung, E.J.; Woo, J.M. The effect of cognitive behavior therapy-based psychotherapy
applied in a forest environment on physiological changes and remission of major depressive disorder.
Psychiatry Investig. 2009, 6, 245–254. [CrossRef] [PubMed]
43. Lee, J.; Tsunetsugu, Y.; Takayama, N.; Park, B.J.; Li, Q.; Song, C.; Komatsu, M.; Ikei, H.; Tyrväinen, L.;
Kagawa, T.; et al. Influence of forest therapy on cardiovascular relaxation in young adults. Evid. Based
Complement. Alternat. Med. 2014, 2014, 834360. [CrossRef] [PubMed]
44. Shin, W.S.; Shin, C.S.; Yeoun, P.S. The influence of forest therapy camp on depression in alcoholics.
Environ. Health Prev. Med. 2012, 17, 73–76. [CrossRef] [PubMed]
45. Richardson, C.R.; Newton, T.L.; Abraham, J.J.; Sen, A.; Jimbo, M.; Swartz, A.M. A meta-analysis of
pedometer-based walking interventions and weight loss. Ann. Fam. Med. 2008, 6, 69–77. [CrossRef]
[PubMed]
46. Hamer, M.; Chida, Y. Walking and primary prevention: A meta-analysis of prospective cohort studies. Br. J.
Sports Med. 2008, 42, 238–243. [CrossRef] [PubMed]
© 2017 by the authors. Licensee MDPI, Basel, Switzerland. This article is an open access
article distributed under the terms and conditions of the Creative Commons Attribution
(CC BY) license (http://creativecommons.org/licenses/by/4.0/).