
healthcare
Systematic Review
Can Different Forest Structures Lead to Different Levels of
Therapeutic Effects? A Systematic Review and Meta-Analysis
Eunsoo Kim 1 , Sujin Park 1 , Soojin Kim 1, Yeji Choi 1 , Junghee Cho 1, Sung-il Cho 2,3 , Hae-ryoung Chun 2
and Geonwoo Kim 1,*
1 Future Forest Strategy Department, Forest Human Service Division, National Institute of Forest Science,
Seoul 02455, Korea; euncarp2@gmail.com (E.K.); snowshoe@korea.kr (S.P.); kimsoojinsj@korea.kr (S.K.);
usmile.choi@gmail.com (Y.C.); jjh6758@korea.kr (J.C.)
2 Department of Public Health Sciences, Graduate School of Public Health, Seoul National University,
Seoul 08826, Korea; persontime@hotmail.com (S.-i.C.); mamimihae@gmail.com (H.-r.C.)
3 Institute of Health and Environment, Seoul National University, Seoul 08826, Korea
* Correspondence: bkim5020@korea.kr; Tel.: +82-02-961-2862
Citation: Kim, E.; Park, S.; Kim, S.;
Choi, Y.; Cho, J.; Cho, S.-i.; Chun,
H.-r.; Kim, G. Can Different Forest
Structures Lead to Different Levels of
Therapeutic Effects? A Systematic
Review and Meta-Analysis.
Healthcare 2021, 9, 1427. https://
doi.org/10.3390/healthcare9111427
Academic Editor: Jesper Dahlgaard
Abstract: In recent decades, forests have expanded from natural resources for conservation and
production to health-promoting resources. With the growing body of evidence supporting the
therapeutic effects of forests, the number of investigations on the relationship between forest charac-
teristics and therapeutic effects have increased. However, quantitative synthesis of primary studies
has rarely been conducted due to a limited number of health studies including forest description
and high heterogeneity of forest variables. In this study, we conducted a systematic review and
meta-analysis to evaluate the relationship between the forest structure and the therapeutic effect.
We systematically searched the studies examining the therapeutic effects of forests with different
stand density and canopy density and synthesized the results. As a result of subgroup analysis,
we found that stand density modifies the therapeutic effects. Emotional and cognitive restoration
showed greatest improvement in low-density forests with a stand density of less than 500/ha and
the therapeutic effects diminish as the stand density increases. The impact of canopy density was
not found due to a lack of studies reporting canopy density. Although some limitations remain, the
findings in this study have great significance in providing the basis for establishing management
strategies of forests for therapeutic use.
Keywords: stand density; canopy density; affective restoration; cognitive restoration; physiological
relaxation; subgroup analysis
Received: 31 August 2021
Accepted: 19 October 2021
Published: 23 October 2021
Publisher’s Note: MDPI stays neutral
with regard to jurisdictional claims in
published maps and institutional affil-
iations.
Copyright: © 2021 by the authors.
Licensee MDPI, Basel, Switzerland.
This article is an open access article
distributed under the terms and
conditions of the Creative Commons
Attribution (CC BY) license (https://
creativecommons.org/licenses/by/
4.0/).
1. Introduction
Human use of nature to promote mental and physical health has a long history and
continues accumulating plenty of empirical evidence. In the 1980s, two representative
theoretical frameworks were proposed that explained how experiencing nature benefits
human health. One is the attention restoration theory (ART) which suggests cognitive
recovery through experience in nature. According to ART, natural environments are rich
in components aiding recovery from mental fatigue [1,2]. Exposure to nature evokes
involuntary attention, rather than voluntary attention that causes directed attention fatigue,
result in the restoration of directed attention, giving more opportunities to restore cognitive
abilities [1–4]. The other one is the stress reduction theory (SRT) that emphasizes emotional
recovery and stress reduction through aesthetic experience in nature [5,6]. Viewing natural
scenery arouses positive emotions, limits negative thoughts, and alters the autonomic
nervous system activity towards being parasympathetic-dominant, leading to more relaxed
states [5–8]. In addition to these two approaches, several health-promoting pathways
in the natural environment have been proposed, such as promoting physical activity
and social contact, providing a quality environment for improving mental health [9,10].
Healthcare 2021, 9, 1427. https://doi.org/10.3390/healthcare9111427
https://www.mdpi.com/journal/healthcare

Healthcare 2021, 9, 1427
2 of 28
Plenty of studies have accumulated, leading to recognition of the therapeutic potential
of nature. Before 2007, however, most investigations did not distinguish types of the
natural environment because studies have focused primarily on demonstrating the health-
promoting effects of natural exposure and its mechanisms [11].
Since 2007, some East Asian and European countries have started to utilize urban
forests, peri-urban forests, and conservation areas to improve public health and well-
being [11–17]. Accordingly, research on forests, a specific natural environment, has been
increasing. Several clinical trials conducted walking, staying, and exercising sessions
in the forest and examined the therapeutic effect of forests. They demonstrate that for-
est have effects on reducing anxiety and depression [18–21], reducing stress [8,22–24],
promoting physiological relaxation [25–30], improving cognitive function [31–33], reliev-
ing inflammation [34–37], improving immune function [37–41], and preventing cardio-
vasculars [35,36,42,43]. Overall, these studies demonstrate that individuals gain health
benefits through mental and physical interactions with forest elements. The forest en-
vironments consist of scenery, scent, sounds, phytoncides, anions, sunlight, microcli-
mate environments, and topography. These elements act as therapeutic factors by stim-
ulating the five senses [1,17,28,44–47], promoting psychological and physiological relax-
ation [25–30,48], supporting cognitive recovery [49], providing beneficial chemicals to the
human body [50–57], and giving a recreational space [33,58].
Recently, studies have started to examine the relationship between therapeutic out-
comes and various forest variables. Investigations were conducted on a wide range of
forest variables such as spatial structure [59–61], openness-enclosure [59,62,63], vegetation
density [59,64,65], tree cover density [66], stand structure [67], species composition [44],
management [68,69], and physical environment [45,70–72]. Those investigations aimed
to assess and estimate the benefits of the forest by its characteristics, determine adequate
levels of forest variables, and provide guidance to create and manage forest sites for ther-
apeutic use [73]. Furthermore, one systematic review examined the differences in health
effects according to the forest variables. However, few studies included forest variables
at the time of the review, and there was a limit to elucidating the relationship because
the forest variables investigated in each study were different. We recognized that more
articles have been reported since the publication of the review, and that the search needs
to be narrowed down to specific forest variables. Therefore, we conducted a systematic
review and a meta-analysis to update more recent evidence and identify the relationship
between the therapeutic effects and the structural variables of forests: stand density and
canopy density.
The structure of the forest affects the sense of openness, lightness, comfort, and
aesthetics that humans feel, so it can be expected that the structural characteristics will
change the therapeutic effect of the forest. Further, we focused on the density of trees, a
major component of the forest environment. Previous studies revealed that high-density
trees limit visual access and ease of movement, and may disturb immersion in nature
in that it threatens a sense of security [64,74,75]. Conversely, a forest setting with a low
vegetation density can give a sense of openness but it can create a boring and monotonous
landscape [66,76–79]. In this regard, we considered stand density—a number of trees per
hectare— and canopy density—the top density of trees—as a major factor in modifying
the therapeutic impacts of forest sites. Besides, we decided to include stand density and
canopy density for this review because these are measurable variables widely used in the
forestry sector and can be changed by short-term forest management.
A systematic review is a research method that summarizes the latest empirical evi-
dence relevant to a specific research question, and meta-analysis is a statistical method
that quantitatively synthesizes the data from searched studies. In general, meta-analysis is
performed to estimate the effect size more accurately by synthesizing homogeneous studies.
It can also be conducted to confirm whether study-level variables change the outcomes
of each study [80]. The key challenge of this study was to investigate the moderating role
of stand density and canopy density. Therefore, we systemically summarized previous

Healthcare 2021, 9, 1427
3 of 28
studies reporting both therapeutic effect and structural variables of the forest. Then we
performed a meta-analysis to investigate whether the structural variables of the forest
modify the therapeutic effect. We expected this study to contribute to developing strategies
to increase the therapeutic use of forests.
2. Materials and Methods
We followed the guidelines of the Cochrane Handbook for Systematic Reviews of
Interventions (Version 6.2) [80], and we identified and evaluated the available literature in
accordance with the Preferred Reporting Items for Systematic Reviews and Meta-Analyses
(PRISMA) checklist [81]. The study was registered in OSF database under the number
DOI:10.17605/OSF.IO/D7J5Q
2.1. PICO and Eligibility Criteria
In order to address a clearly formulated research question, we set our research ques-
tion by specifying the population, intervention, comparison, outcome (PICO). We also
established eligibility criteria following the PICOS framework for the study selection,
displayed in Table 1, as follows:
• P: All human participants (both healthy and unhealthy).
• I: Spending time in the forest or urban forest with the description of forest environment
in terms of stand density and canopy density—stand density, tree density, trees/ha,
basal area, canopy density, canopy openness, canopy closure, sky view factor etc.
• C: Studies with a control site or not.
• O: The studies that contained quantitative outcomes related to cognitive restoration,
psychological restoration, physiological relaxation, and stress reduction.
Table 1. Eligibility Criteria for Study Selection.
PICO
Participants
Intervention
Comparator
Outcome
Inclusion Criteria
Humans who are healthy or not
Activities
Spending time in the forest or urban
forest (e.g., forest walking, forest viewing,
forest bathing, forest therapy)
Undertaken area
Studies should describe forest
environment in terms of stand density or
canopy density (e.g., stand density, tree
density, trees/ha, basal area, canopy
density, canopy openness, canopy
closure, sky view factor, etc.)
Studies with a control site or not
Studies should report quantitative
outcomes related to cognitive restoration,
psychological restoration, physiological
relaxation, stress reduction.
Exclusion Criteria
Studies not including human
participants
Studies with the intervention
that does not match with
defined activities
Studies not reporting stand
density nor canopy density
NA
Studies not including
quantitative outcomes
2.2. Search Strategy
We took 24 pilot searches and finalized search keywords to gather relevant studies
and obtain reproducible search results. The search keywords contain keywords relevant to
forest-based activities, forest variables, and therapeutic effects (Table 2). We conducted a
systematic literature search of four databases PubMed, EBSCO, Web of Science, and Scopus.
We searched published articles in English from the inception year to the end of June 2020.

Healthcare 2021, 9, 1427
4 of 28
Table 2. Search Keywords.
PICO
Intervention
Activities
Undertaken
Area
Outcome
Keywords
“forest therapy” OR “forest bathing” OR “shinrin-yoku” OR “shinrin yoku” OR
“forest walk” OR “forest walking” OR “forest recreation” OR “nature therapy”
OR “forest trip” OR “forest visit” OR (“trip” NEAR “forest”) OR (“visit” NEAR
“forest”) OR (“spending time” NEAR “forest”) OR (“walking” NEAR “forest”)
OR (“viewing” NEAR “forest”)
“stand density” OR “tree density” OR “strains/ha” OR “stands/ha” OR
“trees/ha” OR “basal area” OR “canopy density” OR “canopy openness” OR
“canopy closure” OR “sky view factor” OR “gap light analysis” OR (“managed”
NEAR “forest”) OR (“unmanaged” NEAR “forest”) OR (“thinned” NEAR
“forest”) OR (“unthinned” NEAR “forest”) OR “thinned condition” OR
“unthinned condition” OR “thinning intensity” OR (“light environment” NEAR
“tree vegetation”) OR (“light environment” NEAR “trees”) OR (“environmental
factor” NEAR “forest”) OR (“environmental factor” NEAR “tree vegetation”)
OR (“environmental factor” NEAR “trees”) OR (“microclimate” NEAR “forest”)
OR (“microclimate” NEAR “tree vegetation”) OR (“microclimate” NEAR
“trees”) OR (“physical environment” NEAR “forest”) OR (“physical
environment” NEAR “tree vegetation”) OR (“physical environment” NEAR
“trees”) OR (“forest” NEAR “structure”) OR “forest landscapes” OR “forest sites”
OR “forests”
“health” OR “well-being” OR “well-being” OR “psychological” OR
“physiological” OR “psycho-physiological” OR “restorativeness” OR
“restorative effect” OR “restorative experience” OR “psychological restoration”
OR “PRS” OR “perceived restorativeness schedule” OR “ROS” OR “restorative
outcome scale” OR “mood” OR “affective state” OR “POMS” OR “profile and
mood state questionnaire” OR “PANAS” OR “positive and negative affect
schedule” OR “anxiety” OR “STAI” OR “Spielberger state-trait anxiety
inventory” OR “self-reporting anxiety scale” OR “depression” OR “BDI” OR
“Beck depression inventory” OR “self-reporting depression scale” OR “vitality”
OR “SVS” OR “subjective vitality scale” OR “psychological relaxation” OR
“physiological relaxation” OR “psycho-physiological relaxation” OR
“psychological response” OR “physiological response” OR “blood pressure” OR
“SBP” OR “systolic blood pressure” OR “DBP” OR “diastolic blood pressure”
OR “pulse rate” OR “heart rate” OR “HRV” OR “heart rate variability” OR
“SDNN” OR “RMSSD” OR “LF” OR “HF” OR “LF/HF” OR “skin conductance”
OR “SCR” OR “brain wave” OR “prefrontal activity” OR “SpO2” OR “EEG” OR
stress reduction” OR “stress recovery” OR “stress restoration” OR “cortisol” OR
“saliva”
2.3. Study Selection Process
From the database search, we found a total of 932 studies with 180 on PubMed, 68
on EBSCO, 113 on Web of Science, and 571 on Scopus. The results were exported to
EndNote Citation Manager software (Endnote X9.3.3, Clarivate Analytics, London, UK).
After removing 159 duplicates, the titles and abstracts of the 773 publications were reviewed.
After removing 504 explicitly irrelevant cases, two investigators independently reviewed
the full text for 269 studies based on eligibility criteria (E.K. and Y.C.). Disagreements
during the screening process were resolved by two other investigators (G.K. and S.P.). We
included ten studies from our database search and added two studies that were manually
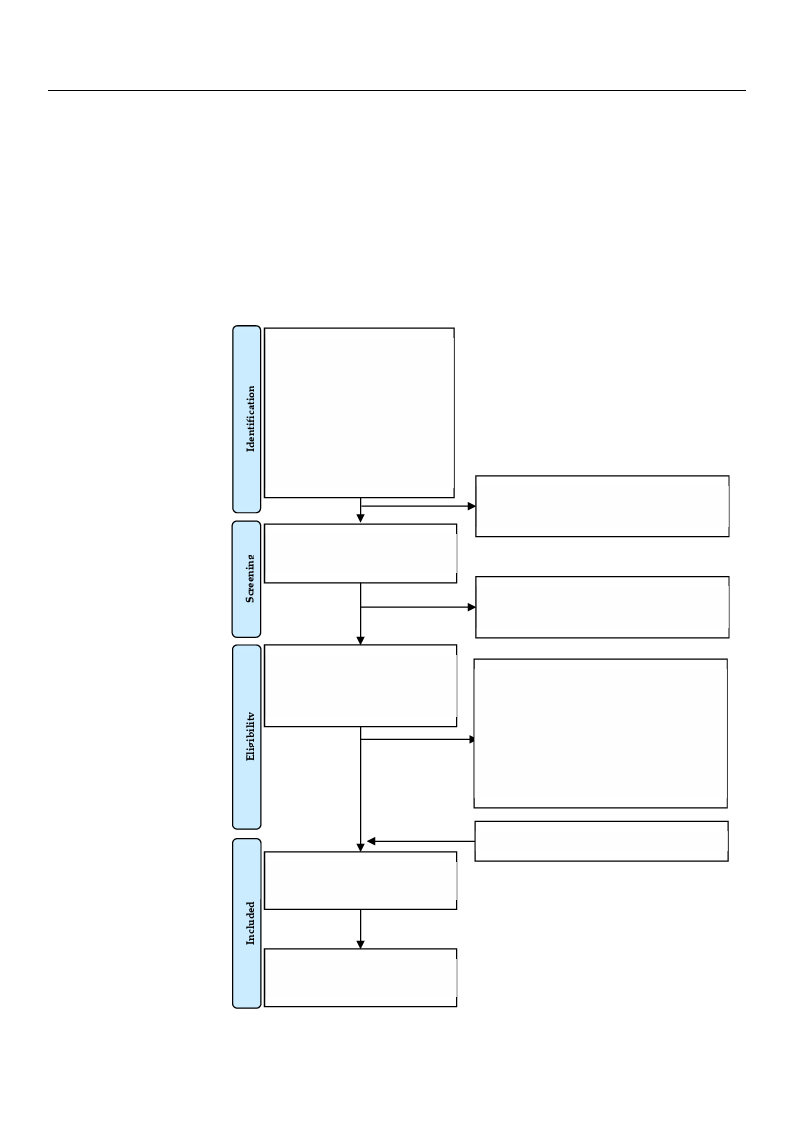
identified. Thus, in total, 12 studies were included in the review (Figure 1).
2.4. Data Extraction
Two investigators (E.K. and S.K.) independently used the same data extraction form
and cross-checked them. Data were extracted from individual studies to identify studies,
determine the homogeneity between studies, and estimate the effect size of individual
studies. The extracted data included study information, samples, forest characteristics,
environmental characteristics, intervention, and outcome measurements as follows.
Healthcare 2021, 9, 1427
Healthcare 2021, 9, x FOR PEER REVIEW
5 of 28
5 of 31
2.3.•StudSdytauStedel,yetciitmniofenoroPmfrmoactieeosasns:uyreemareonft publication, author, country, city, study design, conducted
• FroSmamthpeledsa:tasabmaspelseesairzceh, ,gwenedfeoru,nadnda atogteal of 932 studies with 180 on PubMed, 68 on
EBS•CO, F1o1r3eostncWhaerbacotfeSricsiteincsc:el,oanngdit5u7d1eo, nlaStictoupdues, .aTlthiteurdees,uslttas nwdedreenexsiptoyr(tterdeetso/Ehnad),Ncaonteopy
CitationdMenasniatyge(%r s),odftiwamareete(rEantdbnroetaestXh9e.3ig.3h,tC(clamri)v, ahteeigAhnta(mlyt)i,cdso, mLoinnadnotnt,rUeeKs)p. eAcifetesr re-
mov•ing E1n59vidrounpmliceantteasl, cthheartaitclteesriasntidcsa:btsetmrapcetsraotfutrhee(◦7C73), preulbatliicvaetihounms wideitrye (r%ev),ierwadeida.nAt hf-eat
ter r•emo(v◦iCn)g, w50i4ndexsppleiceidtly(mir/resl)e, vilalunmt ciansaensc, etw(lox)i,nnvoeissteiglaetvoerls(idnBd)ependently reviewed the
full•text Ifnotre2rv69ensttiuodni:eascbtiavsietdieso,nacetliivgiitbyildituyrcartiitoenri,aa(nEd.Kfr.eaqnudenYc.Cy .). Disagreements during
the•screeOnuintcgompreo:cemsseawsuerremreesnotlvienddibceys,twporeo-mtheearsiunrveemsteingtat(oMrs ±(GS.KD.),anpdosSt-.Pm.)e.aWsuereimn-ent
cluded t(eMn s±tuSdDie)s, cfhroamngeouinr mdaetasbuarseemseanrtc(hMa±ndSaDd)d, iendtetrw-toriastlucdoirerseltahtaiotnwere manually
identified. Thus, in total, 12 studies were included in the review (Figure 1).
Articles identified through
database searching
N = 932
PubMed (n = 180)
EBSCO (n = 68)
Web of Science (n = 113)
Scopus (n = 571)
Title and abstract level screening
(n = 773)
Duplicates removed
(n = 159)
Articles excluded
(n = 504)
Full-text articles assessed for
eligibility
(n = 269)
Full-text publications excluded, with reasons
Irrelevant intervention (n = 13)
without quatitative forest description (n = 132)
without quantitative health outcomes (n = 7)
Duplicated data (n = 2)
Reviews (n = 105)
Total articles included in the review
(n = 12, 28 cases)
Additional articles identified manually (n = 2)
Quantitative synthesis
(n = 9, 11 cases)
FiguFriegu1r.eFl1o.wFldowiagdriaamgrailmlusiltlruastitnragtitnhge tsheelescetiloecntipornocpersosc.ess.

Healthcare 2021, 9, 1427
6 of 28
In the case of stand density reported as basal area (m2/ha) and growing stock (m3/ha),
we converted it into the number of trees per hectare. In the case of canopy density reported
as canopy openness, we reversed and unified it.
2.5. Methodological Quality
To collect all relevant studies reporting forest structural variables, we did not impose
strict restrictions on study design and included non-randomized studies in the review.
ROBINS-I was used to evaluate the study’s methodological quality, according to the
recommendations of the Cochrane Handbook [80]. ROBINS-I is a useful methodological as-
sessment tool in a systematic literature review that includes non-randomization studies [82].
ROBINS-I evaluates seven areas of bias at the stage of pre-intervention, at intervention, and
post-intervention. Two investigators (E.K. and G.K.) independently assessed the risk of
bias by answering the signaling questions for each bias area. The degree of bias is derived
as low risk of bias, moderate risk of bias, serious risk of bias, critical risk of bias, and no
bias information. If the evaluation result is a low risk of bias, it can be regarded as a study
similar to a well-performed randomized controlled trial. In the case of a moderate risk of
bias, it provides fair evidence but is difficult to compare with a randomized controlled trial.
In the case of a serious risk of bias, there is a significant defect in at least one area, but it is
difficult to regard the overall quality as low. Critical risk of bias means that there are many
problems to provide useful evidence and cannot be used to synthesize research results.
2.6. Statistical Analysis
We conducted the statistical analysis using R 4.04 and R Studio with the “metafor”
and other R packages. We extracted effect estimates from individual studies, estimates
overall effect, conducted subgroup analysis and sensitivity analysis.
2.6.1. Extracting Estimates of Effect
Since the control group for each study was different, pre-and post-measurement
of individual forest environments were extracted and used for analysis. We calculated
standardized mean differences (SMD) to estimate the effect size. The mean, standard
deviation, number of samples, and inter-trial correlation of pre-and post-measured values
were used for SMD calculation. If the study did not report the inter-trial correlation,
we estimated inter-trial correlation according to the recommendations of the Cochrane
Handbook [80]. When several forest environments were investigated in one study, we
extracted the effect size separately for each forest environment. As Cohens et al. [83]
suggested, we interpreted the result of SMD 0.20–0.49 as “small” effect size, 0.50–0.79 as
“medium” effect size, and ≥0.80 as “large” effect size.
2.6.2. Estimating Overall Effect Size
There are two statistical models for meta-analysis. One is a fixed-effect model, which
assumes that studies share a common effect size and that differences in results result from
sampling error. The other is a random-effects model, which assumes that the true effect
size varies by study and is distributed around the overall mean. As we hypothesized that
the therapeutic effect of forest varies by forest structure, we used a random-effects model
to estimate effect size.
2.6.3. Sub-Group Analysis
We conducted a subgroup analysis to investigate the relationship between the struc-
tural variable of forest sites and their therapeutic effect. We divided structural variables
into three or four subgroups based on their homogeneity and calculated the proper sample
size using G*Power 3.1. software to ensure a satisfactory power value. To assess inter-study
heterogeneity in subgroup analysis, we used Cochrane’s Q test (p < 0.10 for statistical sig-
nificance) and I2 (I2 > 50% used as a threshold for significant heterogeneity). We observed
whether the two structural variables affected the healing effect by the significance test

Healthcare 2021, 9, 1427
7 of 28
of subgroup differences and the comparison of heterogeneity according to the subgroup
analysis. We also report the 95% confidence interval of SMD for each subgroup.
2.6.4. Sensitivity Analysis
Finally, we took a sensitivity analysis to check whether individual studies affect the
effect estimation. The leave-one-out method was used for sensitivity analysis, and we
assessed the degree of change through Rstudent, diffits, Cook’s D, covratio, T2, Qresid,
hat value, and DFBETAS values (the results are available in the Supplementary Materials
Figure S1).
3. Results
3.1. Study Characteristics
A total of 12 studies were included in this review and characteristics of those are shown
in Table 3. Of the 12 included studies, one was a randomized controlled trial, seven were
randomized crossover studies, and four were non-randomized studies. All studies were
conducted in forest settings, and eight studies conducted interventions in multiple forest
sites. Studies were conducted in seven countries, including Japan (four studies; nine sites),
China (three studies; nine sites), Korea (one study, one site), Taiwan (one study, one site),
Finland (one study; four sites), Poland (one study, one site), Spain (one study, one site).
Thus, a total of 26 different forest sites were examined. The main intervention methods
were staying (seven studies), walking (four studies), or both (one study). The duration of
interventions in most studies was within 120 min (11 studies), and one study conducted a
180 min-length intervention.
A total of 685 participants were included in 12 studies, and the number of samples
ranged from 8 to 346. The average age of participants in the included study ranged from
20.8 to 60.0 years. Four studies included only young adults, one study included only
middle-aged adults, six included both young and middle-aged, and one included both
middle-aged and elderly.
The therapeutic effects were reported as emotional restoration, cognitive restoration,
and physiological relaxation. Emotional restoration included improvement in mood states
such as anxiety (eight studies; eighteen sites), depression (seven studies; sixteen sites),
anger (seven studies; sixteen sites), confusion (six studies; fifteen sites), fatigue (six studies;
fifteen sites), vigor (seven studies; nineteen sites), negative and positive affect (four studies;
nine sites). Cognitive restoration included restorative experience (five studies; thirteen sites).
Physiological relaxation included lowering blood pressure (four studies; seven sites), heart
rate and pulse rate (four studies; seven sites), relaxation effects measured through heart rate
variability and stress hormone (one study; two sites). Additionally, one study measured
the blood concentration of monoterpenes as an indicator of therapeutic effect.
Prior to the meta-analysis, we reviewed participant characteristics, species composi-
tions, microclimate, noise, and the timing of measurement to rule out possible confounding
factors. As a result, nine studies of twelve included studies were used for meta-analysis.
Since thermal discomfort can disrupt the therapeutic experience, we excluded three studies
that are difficult to be considered homogeneous in terms of environmental characteristics
(temperature and humidity). There were some differences in how each forest was managed.
However, it was not thought that there would be a significant difference in the perception of
the forest environment among the participants, mainly non-experts, as most of the studies
investigated conifer-dominant mixed forest.

Healthcare 2021, 9, 1427
8 of 28
Table 3. Characteristics of included studies.
First
Author
and Year
An
2019
[84]
Bach
2021
[85]
Bielinis
2019
[27]
Elsadek
2019
[86]
Sample
Size
(M/F)
13
(7/6)
10
(6/4)
21
(12/9)
346
(200/164)
Participant
Characteristics
Stand
Density
(Trees/ha)
DBH
(cm)
Canopy
Den-
sity
Forest
Characteristics
Healthy university students
Age: 21.8 ± 1.9
Healthy university students with
no abnormalities in the respiratory
or immune system
Age: 36.4 ± 6.5
3 different forest sites
(no control assigned)
1667/ha
1867/ha
1993/ha
13.26 0.56
10.35 0.75
14.39 0.78
One forest site and
urban site (control)
10500/ha
6.43
0.95
Location:
43◦51 N, 125◦18 E
Betula platyphylla
Acer triflorum
Quercus mongolica
Location:
41◦73 N, 2◦44 E
Altitude:
860–972 m
Dominant species:
Quercus ilex
Healthy university students and
non-student volunteers with no
mental or physical diseases or
metabolic syndromes
Age: 23.9 ± 2.7
One forest group
(no control)
1200/ha
NA NA
Location:
53◦90 N, 20◦35 E
Dominant species:
Picea abies and Pinus sylvestris
3 different forest sites and
urban site(control)
Location:
31◦27 N, 121◦46 E
0.13
Urban road
(control)
Healthy university students with
no mental or physical diseases
Age: 23.0 ± 4.6
NA
0.49
NA
0.89
Prunus serrulata
Plantanus hispanica
0.94
Metasequoia glyptroboides
Environmental
Characteristics
Outcome
Measurement
Activity
Type
Time of
Measure
Study
Design
Temp: 18 ◦C
(10–25 ◦C)
Relative humidity: 45%
Wind speed: 3.33 m/s
Illuminance: 4617 lx
Illuminance: 1124 lx
Illuminance: 1012 lx
SBP; DBP; HR
SBP(/); DBP(/); HR(/)
SBP(/); DBP(/); HR(+)
SBP(+/); DBP(+/); HR(+/)
Staying
(30 min)
Sep, 2017
(8:30–
12:00)
Randomized
Cross-over
Temp: 23.87 ± 0.18 ◦C
Relative humidity:
53.7%
Blood concentration of Alpha-pinene(/);
Beta-pinene(/); Alpha-phellandrene(/);
Limonene(/); All monoterpene(/)
Walking
(120 min)
July, 2018
(10:00–
12:00)
Randomized
Controlled
Trial
Temp: 25 ◦C
Relative humidity: 46%
Wind speed: 6.11 m/s
Noise:
38.08 ± 5.19 dB
Illuminance:
37755.24 lx
Temp: 31.8 ◦C
Relative humidity:
42.8%
Wind speed:
0.66 m/s
Temp: 31.2 ◦C
Relative humidity:
47.0%
Wind speed:
0.23 m/s
Temp: 29.0 ◦C
Relative humidity:
50.9%
Wind speed: 0.15m/s
Temp: 28.1 ◦C
Relative humidity:
52.9%
Wind speed:
0.11 m/s
SBP(+); DBP(/); PR(+); MAP(+);
POMS(Confusion(+) Fatigue(+/)
Anger(+) Anxiety(+) Depression(+)
Vigor(/)); PANAS(PA(/) NA(+));
ROS(+); SVS(+)
POMS; STAI; ROS; SVS; PET
POMS(Anxiety(−) Depression(−)
Anger(−) Fatigue(−) Confusion(−)
Vigor(−)); STAI(−); ROS(−); SVS(−)
POMS(Anxiety(+) Depression(+)
Anger(+) Fatigue(+) Confusion(+)
Vigor(+)); STAI(+); ROS(+); SVS(+)
POMS(Anxiety(+) Depression(+)
Anger(+) Fatigue(+) Confusion(+)
Vigor(+)); STAI(+); ROS(+); SVS(+)
POMS(Anxiety(+) Depression(+)
Anger(+) Fatigue(+) Confusion(+)
Vigor(+)); STAI(+); ROS(+); SVS(+)
Staying
(60 min)
May, 2018
(15:45–
16:15)
Uncontrolled
Before and
After
Walking
(15 min)
May, 2018
(10:00–
15:30)
Randomized
Crossover

Healthcare 2021, 9, 1427
9 of 28
First
Author
and Year
Lee
2020
[87]
Oishi
2003
[88]
Saito
2019
[89]
Table 3. Cont.
Sample
Size
(M/F)
16
(5/11)
44
(23/21)
17
(17/-)
Participant
Characteristics
Housewives, freelancers and office
workers
Age: 41.6 ± 1.8
Stand
Density
(Trees/ha)
DBH
(cm)
Canopy
Den-
sity
Forest
Characteristics
One forest site and
one outdoor site(control)
156/ha
27.4 NA
Location:
35◦83 N, 128◦76 E
Dominant species:
Pinus rigida and Quercus aliena
5 different forest sites and
one site outside the
forest(control)
Location:
39◦75 N, 141◦03 E
250/ha
23
Pinus densiflora
Healthy residents including
students and workers
Age: 24.4 ± 9.9
750/ha
34.9
1700/ha
NA
10.6
2275/ha
10.4
2875/ha
9.5
2 different forest sites:
managed forest and
unmanaged forest(control)
healthy male volunteer had no
history of cardiovascular disease or
mental illness
Age: 40.2 ± 6.2
1024/ha
19.78 0.62
1208/ha
15.75 0.91
Cyptomeria japonica
Quercus serrata
Pinus densiflora
Machilus thunbergii
Pinus densiflora
Quercus serrata
Location:
35◦41 N, 138◦86 E
Mixed forest
(Broadleaf trees: 82%
Coniferous trees: 18%)
Mixed forest
(Broadleaf trees: 50%
Coniferous trees: 50%)
Environmental
Characteristics
Outcome
Measurement
Activity
Type
Time of
Measure
Study
Design
NA
DEP(+/); ANX(+/); AGG(/);
ST-IN-S(+); ST-V-RG-P(+)
Staying
(120 min)
May–
Aug,
2017
Controlled
Before and
After
Temp:
19.67 ± 3.31 ◦C
Relative humidity:
68.9%
Temp:
20.29 ± 3.66 ◦C
Relative humidity:
69.3%
Temp:
19.91 ± 3.40 ◦C
Relative humidity:
75.8%
Temp:
20.17 ± 3.19 ◦C
Relative humidity:
73.3%
Temp:
18.63 ± 3.16 ◦C
Relative humidity:
76.4%
Wind speed: m/s
Temp: 24.3 ± 2.8 ◦C
Relative humidity:
73.3%
Illuminance:
255.0 ± 97.6 lx
Temp: 24.2 ± 2.8 ◦C
Relative humidity:
70.0%
Illuminance:
119.2 ± 48.5 lx
POMS
POMS(Anxiety(+) Depression(+)
Anger(+) Fatigue(+) Confusion(+)
Vigor(+))
POMS(Anxiety(+) Depression(+)
Anger(+) Fatigue(+) Confusion(+)
Vigor(+))
POMS(Anxiety(+) Depression(+)
Anger(+) Fatigue(+) Confusion(+)
Vigor(+))
POMS(Anxiety(+) Depression(+)
Anger(+) Fatigue(+) Confusion(+)
Vigor(+))
POMS(Anxiety(+) Depression(+)
Anger(+) Fatigue(+) Confusion(+)
Vigor(+))
SBP; DBP; MAP; HR; HF; LF/HF; saliva
cortisol
SBP(+); DBP(+); MAP(+); HR(/);
HF(+/); LF/HF(+); saliva cortisol(+)
SBP(+); DBP(+); MAP(+); HR; HF(−/);
LF/HF(−); saliva cortisol(+/)
Staying
(10 min)
Staying
(15 min)
Jul–Sep,
2001
(8:45–
13:10)
Non-
Randomized
Cross-over
July, 2014 Randomized
Crossover

Healthcare 2021, 9, 1427
10 of 28
First
Author
and Year
Simkin
2020
[90]
Takayama
2017a
[91]
Table 3. Cont.
Sample
Size
(M/F)
66
(41/59)
18
(18/-)
Participant
Characteristics
City workers aged from 26–65
Age: 43.4 ± 10.7
Stand
Density
(Trees/ha)
DBH
(cm)
Canopy
Den-
sity
Forest
Characteristics
4 different forest sites
(no control assigned)
374/ha
35
424/ha
520/ha
30
NA
28
1746/ha
16
Picea abies-dominated forests
in Finland
Location:
60◦45 N, 25◦19 E
(stand age > 120)
Location:
60◦22 N, 24◦92 E
(stand age: 95)
Location:
60◦33 N, 25◦18 E
(stand age: 100)
Location:
60◦39 N, 25◦18 E
(stand age: 40)
2 different forest sites:
managed forest and
unmanaged forest(control)
Location:
35◦41 N, 138◦86 E
Healthy male volunteer without
history of cardiovascular disease or
mental illness
Age: 40.2 ± 6.4
1056/ha
23.12 0.62
Larix kaempferi 66%,
Cornus controversa 10%
Pinus densiflora 7%
1212/ha
18.54 0.91
Larix kaempferi 66%
Cornus controversa 7%
Pinus densiflora 7%
Environmental
Characteristics
Outcome
Measurement
Activity
Type
Time of
Measure
Study
Design
Temp: 12.8 ± 4.4 ◦C
Relative humidity:
39–96%
Temp: 15.8 ± 4.2 ◦C
Relative humidity:
29–100%
Temp: 15.9 ± 5.8 ◦C
Relative humidity:
39–91%
Temp: 15.3 ± 4.8 ◦C
Relative humidity:
27–98%
ROS; SVS; PANAS
ROS(+); SVS(+); PANAS(+)
ROS(+); SVS(+); PANAS(+)
ROS(+); SVS(+); PANAS(+)
ROS(+); SVS(+); PANAS(+)
Staying
(15 min)
and
Walking
(45 min)
Aug–Oct,
2016
April–
June,
2017
(15:00–
17:00)
Randomized
Crossover
Temp: 24.3 ± 7.9 ◦C
Relative humidity:
73 ± 39%
Wind velocity:
0.13 m/s
Radiant Heat:
25.5 ± 10.5 ◦C
Illuminance:
255.0 ± 97.6 lx
Noise: 41.5 ± 3.8 dB
Temp: 24.2 ± 7.6 ◦C
Relative humidity:
70 ± 34%
Wind velocity:
0.23 m/s
Radiant Heat:
25.3 ± 9.8 ◦C
Illuminance:
119.2 ± 48.5 lx
Noise: 39.0 ± 3.9 dB
POMS; PANAS; ROS; PRS
POMS(Anxiety(+) Depression(/)
Anger(/) Fatigue(+/) Confusion(+)
Vigor(+)); PANAS(PA(/)NA(+)); ROS(+)
POMS(Anxiety(+) Depression(/)
Anger(/) Fatigue(/) Confusion(+)
Vigor(+)); PANAS(PA(/)NA(+/))
ROS(/)
Staying
(15 min)
July, 2014 Randomized
Crossover

Healthcare 2021, 9, 1427
11 of 28
Table 3. Cont.
First
Author
and Year
Takayama
2017
[92]
Sample
Size
(M/F)
15
(11/4)
Participant
Characteristics
Stand
Density
(Trees/ha)
DBH
(cm)
Canopy
Den-
sity
Forest
Characteristics
2 different forest sites:
thinned forest and
unthinned forest(control)
Location: 35◦41 N, 138◦86 E
University students and mid-aged
faculties without had no history of
cardiovascular disease or mental
illness
Age: 35.9 ± 8.2
1056/ha
23.12 0.52
1200/ha
22.76 0.59
Larix kaempferi 66%,
Cornus controversa 10%
Pinus densiflora 7%
Larix kaempferi 66%,
Cornus controversa 10%
Pinus densiflora 7%
Environmental
Characteristics
Outcome
Measurement
Temp: 18.6 ± 0.92 ◦C
Relative humidity:
92 ± 4.6%
Wind velocity:
0.16 m/s
Radiant Heat:
18.8 ± 1.1 ◦C
Illuminance:
336 ± 172 lx
Temp: 17.1 ± 2.52 ◦C
Relative humidity:
38 ± 20%
Wind velocity:
0.30 m/s
Radiant Heat:
21.8 ± 2.8 ◦C
Illuminance:
668 ± 237 lx
POMS; PANAS; ROS; PRS
POMS(Anxiety(+) Depression(+)
Anger(+) Fatigue(+/) Confusion(+)
Vigor(/)); PANAS(PA(/)NA(/))
ROS(+/)
POMS(Anxiety(+) Depression(+)
Anger(/) Fatigue(+) Confusion(+)
Vigor(/)); PANAS(PA(/)NA(/)) ROS(+)
Activity
Type
Time of
Measure
Study
Design
Staying
(15 min)
Oct,
Randomized
May, 2013 Crossover
Middle-aged and elderly subjects
One forest site
aged 45 to 86 years No disease
Yu
123
(n = 69), hypertension (n = 25),
(no control)
Location:
24◦09 N, 121◦18 E
[93]
(43/85)
diabetes (n = 9), heart disease
Dominant species:
(n = 8)
1200/ha
NA NA
Cryptomeria japonica
Age: 60.0 ± 7.4
Temp: 22.6 ± 1.4 ◦C
Relative humidity:
87.4%
Wind speed:
0.1 ± 0.2 m/s
PR(+); SBP(+); DBP(+); HF(/);
LF/HF(/); POMS(Anxiety(+)
Depression(+) Anger(+) Fatigue(+)
Confusion(+) Vigor(+)); STAI(+)
Walking
(180 min)
July, 2016
(8:30–
12:00)
Uncontrolled
Before and
After
Zhou
2019
[94]
43
(8/35)
University students free from
diagnosed cardiovascular, allergic,
physical disease, or mental diseases
Age: 20.8 ± 0.9
2 different forest sites
(no control assigned)
0.20–
0.75
NA
NA
0.50–
0.75
Location:
26◦11 N–26◦55 N
106◦07 E–107◦17 E
Cinnamomum camphora
Quercus fabri
Platanus acerifolia
Cinnamomum camphora
Celtis sinensis
Catalpa bungei
Celtis sinensis
Temp: 22.6 ± 1.4 ◦C
Relative humidity:
87.4%
Wind speed:
0.1 ± 0.2 m/s
Anti-anxiety scores
Anti-anxiety scores (financial states(+);
exam pressure(+); campus life(/); love
affair relationship(+))
Anti-anxiety scores(financial states(+);
exam pressure(+); campus life(+); love
affair relationship(/))
walking
(60 min)
Dec, 2016
Randomized
Cross-over
AGG 7—questions on aggression, ANX 11—questions on anxiety, DBP—diastolic blood pressure, DEP 11—questions on depression, HBP—high-frequency, HR—heart rate, LF/HF—ratio of low-frequency and high
frequency, MAP—mean arterial pressure, PANAS—positive and negative affect schedule, POMS—profile of mood states, PR—pulse rate, PRS—perceived restorativeness scale, ROS—restorative outcomes scale,
SBP—systolic blood pressure, STAI—state trait anxiety inventory, ST-V-IN-S—five questions on stress vulnerability-interpersonal sensitivity, ST-V-RG-P—five questions on stress vulnerability-self-regulation
problems, SVS—subjective vitality scale, Temp—temperature. +: significant effect on positive health outcome; +/: including both significant and nonsignificant effect on positive health outcome; /: nonsignificant
effect; -/: including both significant and nonsignificant effect on negative health outcome -: significant effect on negative outcome.
Healthcare 2021, 9, 1427
12 of 28
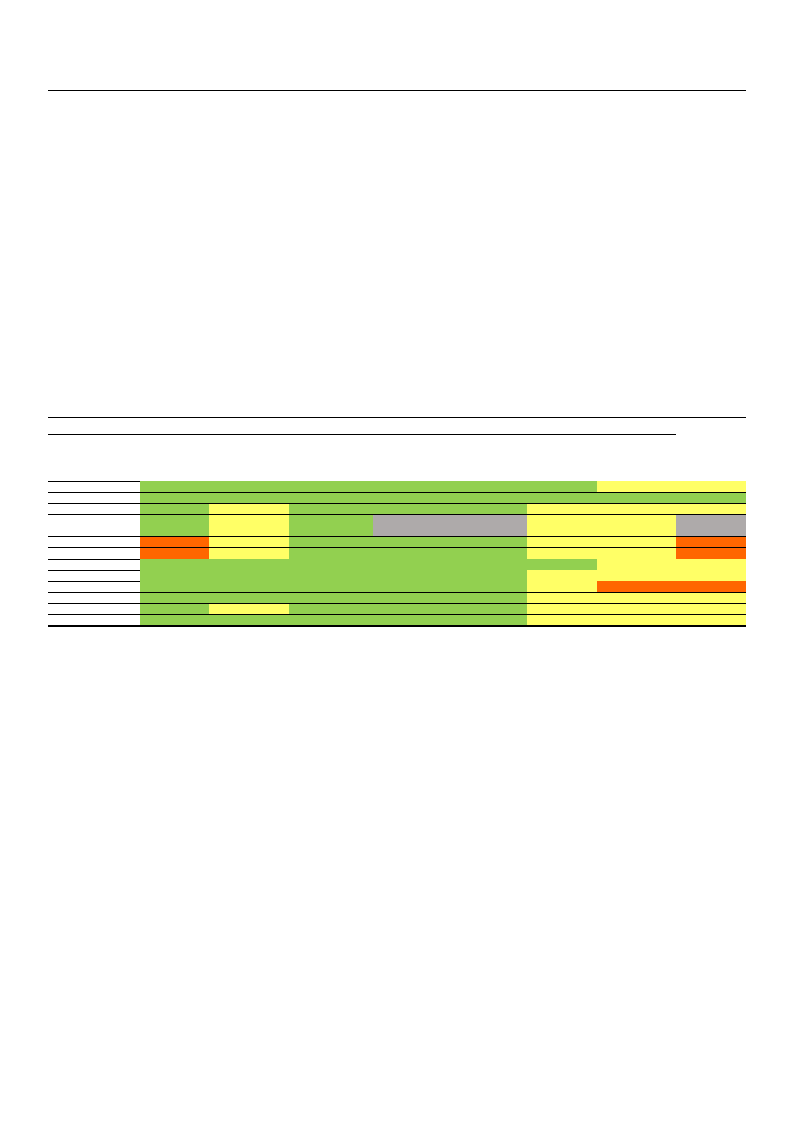
3.2. Methodological Quality
Methodological quality was assessed using ROBINS-I. Overall, the risk of bias was
moderate in most studies (Table 4). At the pre-intervention stage, low confounding bias was
found in most studies, with the exception of two studies that did not provide information
on potential confounding factors. Selection bias was mainly low, however moderate
selection bias was found in four studies due to lack of randomization and control groups.
At the intervention stage, all studies found low classification bias due to clearly defined
forest sites, activities. At the post-intervention stage, most of the studies found low bias
by deviations and missing data, with the exception of one study that did not provide
sufficient information. Moderate bias in measurement found in most studies reflects the
lack of blinding in studies using self-reported measures. Most studies were concerned
that there was a moderate bias in their reporting due to the lack of evidence to justify the
analytical methods, such as pre-registered protocol. One study was assessed as having
serious reporting bias due to incompletely reported results.
Study
First
Author
Year
An
Bach
Bielinis
2019
2021
2019
Elsadek 2019
Lee
Oishi
Saito
Simkin
Takayama
Takayama
Yu
Zhou
2020
2003
2019
2020
2017a
2017b
2017
2019
Table 4. Methodological Quality Assessment of Included Studies Using ROBINS-I.
Pre-Intervention
Bias Due to
Confound-
ing
Low
Low
Low
Bias in
Selection of
Participants
into the Study
Low
Low
Moderate
Low
Moderate
Serious
Serious
Low
Low
Low
Low
Low
Low
Moderate
Moderate
Low
Low
Low
Low
Moderate
Low
At Intervention
Bias in
Classification of
Interventions
Low
Low
Low
Low
Low
Low
Low
Low
Low
Low
Low
Low
Bias Due to
Deviations
from Intended
Interventions
Low
Low
Low
No
Information
Low
Low
Low
Low
Low
Low
Low
Low
Post-Intervention
Bias Due to
Missing Data
Low
Low
Low
No
Information
Low
Low
Low
Low
Low
Low
Low
Low
Bias in Mea-
surement of
Outcomes
Low
Low
Moderate
Moderate
Moderate
Moderate
Low
Moderate
Moderate
Moderate
Moderate
Moderate
Bias in
Selection of
the Reported
Result
Moderate
Low
Moderate
Moderate
Moderate
Moderate
Moderate
Moderate
Serious
Moderate
Moderate
Moderate
Overall Risk
of Bias
Moderate
Low
Moderate
No
information
Serious
Serious
Moderate
Moderate
Serious
Moderate
Moderate
Moderate
3.3. Stand Density as an Effect Modifier of Therapeutic Effect
We classified stand density into four groups: low for <500/ha, medium for 500–1000/ha,
high for 1000–1500/ha, and very high for ≥1500/ha. In the case of emotional restoration,
improving anxiety, depression, anger, frustration, and fatigue, enhancing vitality, alleviat-
ing negative emotions, and promoting positive emotions were reported. The restorative
outcome scale (ROS), which measures restorative experience, was reported regarding
cognitive restoration. For physiological relaxation, lowering effects on blood pressure,
pulse rate, and heart rate were reported. The results for each outcome indices are described
in subsections.
3.3.1. Emotional Restoration
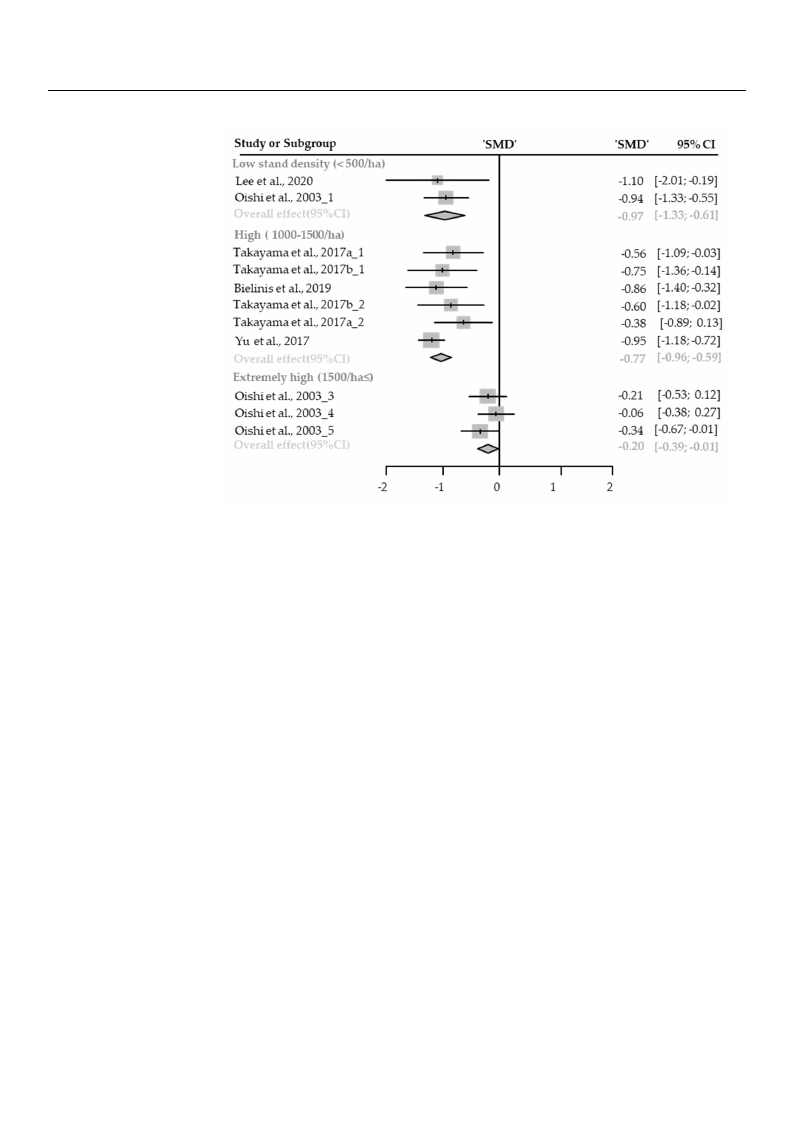
Anxiety
Twelve cases with different stand densities were used for meta-analysis. Anxiety
state significantly relieved in the forest environment (SMD −0.52; 95% CI −0.76 to −0.28;
p < 0.0001; I2 = 76%; 106 participants). As a result of subgroup analysis, there was a signifi-
cant difference in the effect size according to the stand density (Psubgroup < 0.0001; Figure 2).
“Big” effect in low-density environments (SMD −0.97; 95% CI −1.33 to −0.61; p < 0.0001;
I2 = 0%), and “medium” effect in high-density environments (SMD −0.77; 95% CI −0.96 to
−0.59; p < 0.0001; I2 = 9%) “small” effect in extremely high-density environments (SMD
−0.20; 95% CI −0.39 to −0.01; p = 0.0389; I2 = 0%) appeared. One case in an environment
with moderate stand density was excluded from the subgroup analysis.
Healthcare 2021, 9, 1427
< 0.0001; I2 = 76%; 106 participants). As a result of subgroup analysis, there was a signifi
cant difference in the effect size according to the stand density (Psubgroup < 0.0001; Figure 2)
“Big” effect in low-density environments (SMD −0.97; 95% CI −1.33 to −0.61; p < 0.0001; I
= 0%), and “medium” effect in high-density environments (SMD −0.77; 95)% CI −0.96 to
−0.59; p < 0.0001; I2 = 9%) “small” effect in extremely high-density environ13mofe2n8ts (SMD
−0.20; 95% CI −0.39 to −0.01; p = 0.0389; I2 = 0%) appeared. One case in an environmen
with moderate stand density was excluded from the subgroup analysis.
(Fmm(F<<iieg55ega0u0aun0r0nr/ed/ehhdi2fa2a.if)fe.),fT,rTehehhrhinrgeicregnheeehcse(fe1((ofSs01orM00e(r0S0seD–tM0s1)p–t5Da1lp0on50l)tdo0/sa0th9ons/a5fhdo)%t,afh9e)cte5,xoh%tecnrexhefitcmcadrhoneeeangmnlynfecieeghdilneiiyengniahthnencir(exga1vi5nhiaen0lxts(y0ti1e/e(5Cirthnv0yIas0as≤)iu/l.nsh)bT.as(ghTCu≤reh)obI.desugT)ipdr.ahoamTaetuhnaopdaenaladraydetnsaairiaatseamltprybhoeoyesrinrbtsseedotdbpatatnyoaotdrsmstttsdehatpdeaenrnnedbasdssoieadttnysrtedtt:onasimlznsotehidwtdepyar:redlosiewznetds
othveeroalvleerfafelclte. fTfehcetp. TlohtteedplsoqtutaerdessqduenaoretesSdMenDo, taenSdMthDe ,wahnisdktehrsedwenhoistekethrseidr 9e5n%otCe Itsh. eir 95% CIs.
Depression
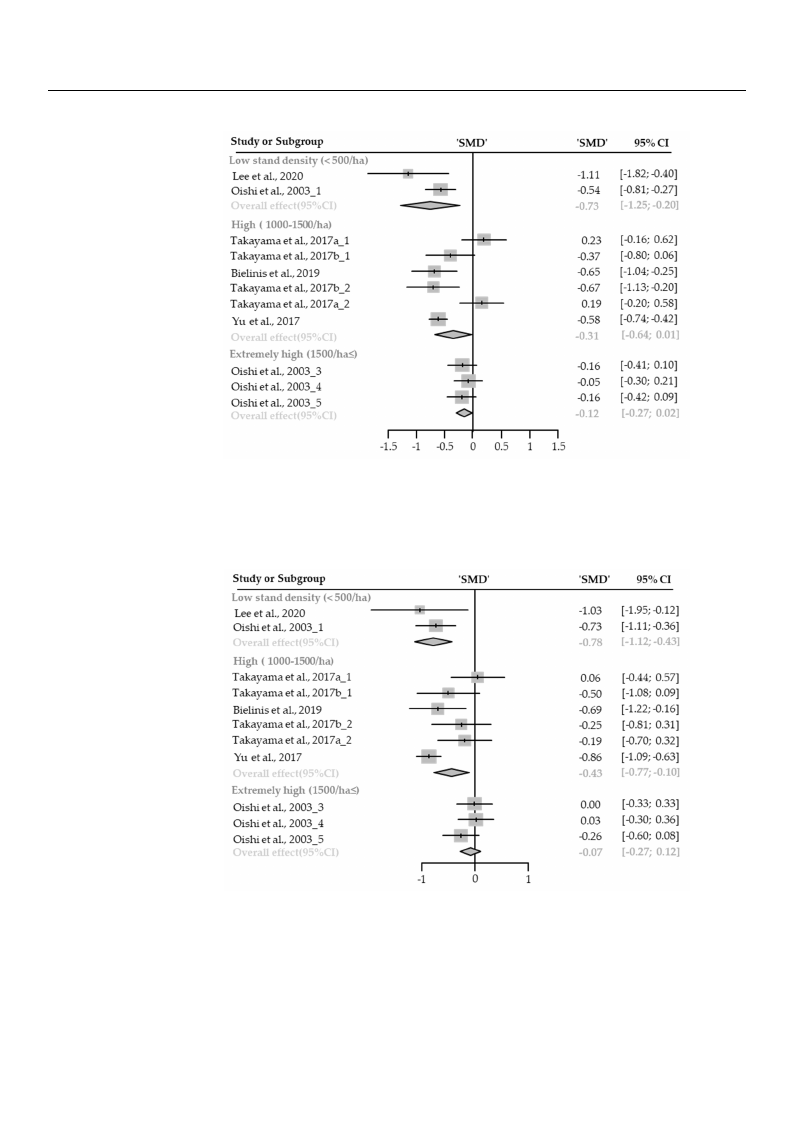
Twelve cases with different stand densities were used for meta-analysis. Depres-
sion state significantly relieved in the forest environment (SMD −0.29; 95% CI −0.47
to −0.10; p = 0.028; I2 = 78%; 106 participants). As a result of subgroup analysis, there
was a marginally significant difference in the effect size according to the stand density
(Psubgroup = 0.0778; Figure 3). “Medium” effect in low-density (SMD −0.73; 95% CI −1.25
to −0.20; p = 0.0067; I2 = 54%) appeared, however, no significant effect was shown in
high-density environments (SMD −0.31; 95% CI −0.64 to 0.01; p = 0.0594; I2 = 81%)
and extremely high-density environments (SMD −0.12; 95% CI −0.27 to 0.02; p = 0.1034;
I2 = 0%). One case in an environment with moderate stand density was excluded from the
subgroup analysis.
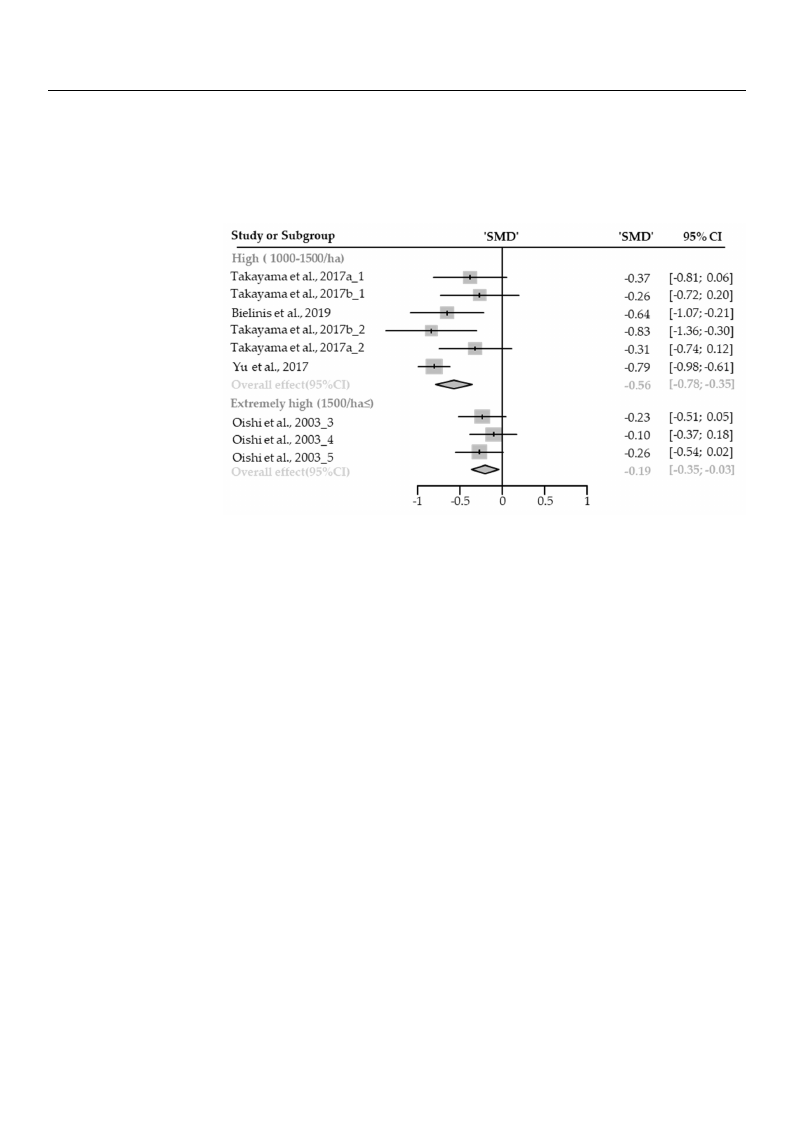
Anger
Twelve cases with different stand densities were used for meta-analysis. Anger
state significantly relieved in the forest environment (SMD −0.35; 95% CI −0.58 to −0.12;
p = 0.0026; I2 = 73%; 106 participants). As a result of subgroup analysis, there was a
significant difference in the effect size according to the stand density (Psubgroup = 0.0032;
Figure 4). A “medium” effect in low-density (SMD −0.78; 95% CI −1.12 to −0.43; p < 0.0001;
I2 = 0%), and a “small” effect in high-density environments (SMD −0.43; 95% CI −0.77
to −0.10; p = 0.01; I2 = 68%) appeared. While there was no significance effect shown
in extremely high-density environments (SMD −0.07; 95% CI −0.27 to 0.12; p = 0.4469;
I2 = 0%). One case in an environment with moderate stand density was excluded from the
subgroup analysis.
Healthcare 2021, 9, 1427
state significantly relieved in the forest environment (SMD −0.29; 95% CI −0.47 to −0.10; p
= 0.028; I2 = 78%; 106 participants). As a result of subgroup analysis, there was a marginally
significant difference in the effect size according to the stand density (Psubgroup = 0.0778;
Figure 3). “Medium” effect in low-density (SMD −0.73; 95% CI −1.25 to −0.20; p = 0.0067; I2
= 54%) appeared, however, no significant effect was shown in high-density environments
(SMD −0.31; 95% CI −0.64 to 0.01; p = 0.0594; I2 = 81%) and extremely high-density14enofv2i8-
ronments (SMD −0.12; 95% CI −0.27 to 0.02; p = 0.1034; I2 = 0%). One case in an environment
with moderate stand density was excluded from the subgroup analysis.
Healthcare 2021, 9, x
FFiigguurree 33.. TThhrereeefofroersetstplpoltostos fotfhtehcehcahnagnegine dinepdreepsrseiosnsioinnsiunbsgurobugproaunpalaynsaislybsyisstbayndstadnednsditeyn: sloitwy:
(lo<5w00(/<h5a0)0, /hhigah),(1h0ig0h0–(11500000/–h1a5),0a0n/dhae)x,tarenmdeelxythreigmhe(ly15h0i0g/hha(≤1)5. 0T0h/ehdaa≤ta).aTrehreedpoatrateadreasrestpaonrdteadrda-s
issbzetoaentdnttosdmmtahredepanirozevedsedeirfnfametlsrleeteanhfnfceeeocdstvi.(feSTfreMhareleDlnpe)clfaeofesntctde(tS.d9MT5sh%qDeu)capoarlneonsftditdde9dee5nns%coqetueciaonSrntMeefisrDdvdae,enlansnco(edtCeitInhSst)Mee. rTwDvhha,eilassdnk(ideaCrmtsIhsode).newdnThoahtitseektthdeheireasbimrdo9eott5nno%odm1te7CapttIohrstfe.eh-i3er1
95% CIs.
Anger
Twelve cases with different stand densities were used for meta-analysis. Anger state
significantly relieved in the forest environment (SMD −0.35; 95% CI −0.58 to −0.12; p =
0.0026; I2 = 73%; 106 participants). As a result of subgroup analysis, there was a significant
difference in the effect size according to the stand density (Psubgroup = 0.0032; Figure 4). A
“medium” effect in low-density (SMD −0.78; 95% CI −1.12 to −0.43; p < 0.0001; I2 = 0%), and
a “small” effect in high-density environments (SMD −0.43; 95% CI −0.77 to −0.10; p = 0.01;
I2 = 68%) appeared. While there was no significance effect shown in extremely high-den-
sity environments (SMD −0.07; 95% CI −0.27 to 0.12; p = 0.4469; I2 = 0%). One case in an
environment with moderate stand density was excluded from the subgroup analysis.
(F(F<<iig55g0u0u00rre//ehh44aa..)),T,Thhhhirgiregheehe(f1(of10or00er00es0s–tt–1p15plo05l0o0ts/0ths/oafho)tf,aha)te,nhacdenhcedahxnteagrxneetgmrieenemilanyenlhgayinegrhghiiegnr(h1si5un(01b0s5g/u0hrb0oag/u≤rh)po.aTua≤nhp)ae.aldynTsaahitlseaybsadyirasestbatrayeanprsdoetradrtneeeddpnosadirtsetyens:dtslaiontawysd:aslrtoadwn- -
dizaerddimzeedanmdeiafnfedreinffceersen(ScMesD(S)ManDd) 9a5n%d c9o5n%ficdoennficedeinntceervinatlesr(vCaIlss).(CTIhse).dTiahme odniadmaotnthdeabtothtteombopttroem-
psreenstesntthsethoeveorvaellraelflfeecffte. cTth. Te hpelopttloedttesdqusqarueasredsednoenteoSteMSDM,Dan, adntdhethwehwishkisekrserdsedneonteottehtehirei9r59%5%CICs.Is.
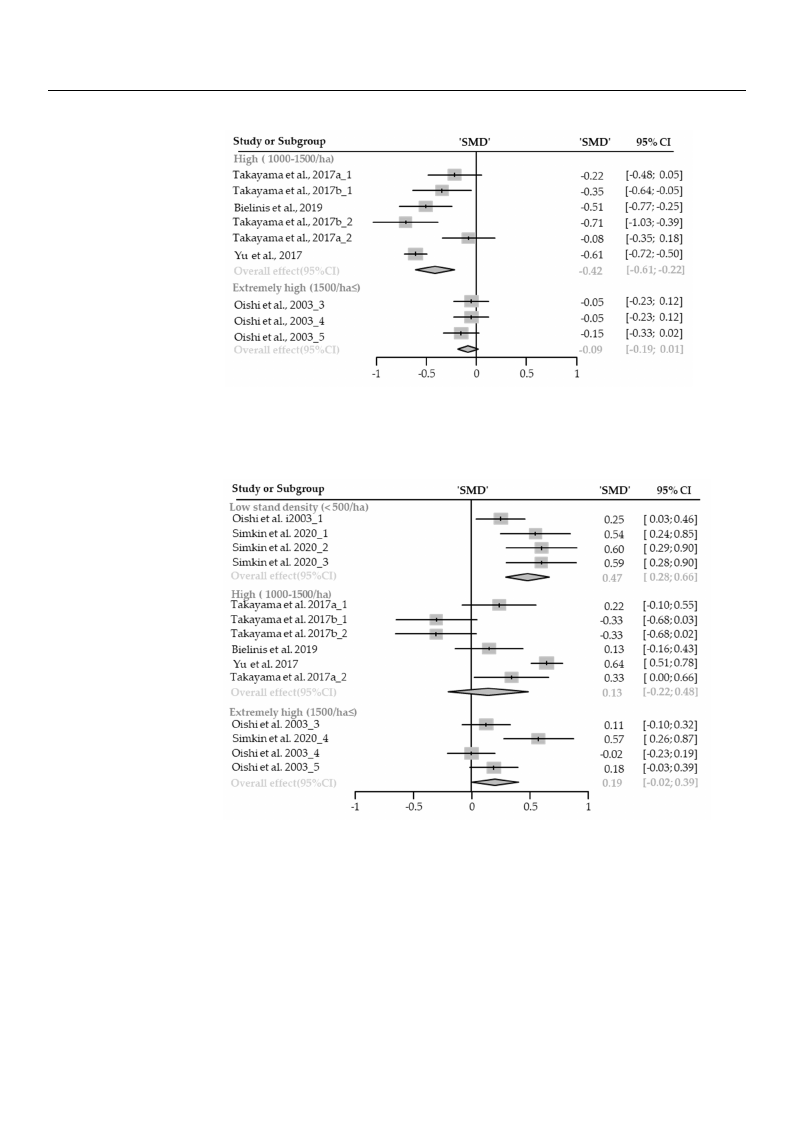
Confusion
Confusion
Eleven cases with different stand densities were used for meta-analysis. Confusion
state Ewleavsesnigcnaisfiecsawntiltyhrdeliifefevreedntinsttahnedfodreensstiteinesviwroenrme uensetd(SfMorDm−et0a.-4a1n; a9l5y%sisC. IC−on0f.u60sioton
−st0a.t2e3w; pa<s 0si.g00n1if;iIc2an=t7ly1%re;l2ie2v6epdarintictihpeanfotsr)e.sAt senavriersounlmt oefnstu(bSgMroDup−0a.n41a;ly9s5is%, tCheIr−e0w.6a0stao
−0.23; p < 0.001; I2 = 71%; 226 participants). As a result of subgroup analysis, there was a
significant difference in the effect size according to the stand density (Psubgroup = 0.0020;
Figure 5). “Medium” effect in high-density (SMD −0.56; 95% CI −0.78 to −0.35; p < 0.0001;
I2 = 47%), and “small” effect in extremely high-density environments (SMD −0.19; 95% CI
−0.35 to −0.03; p = 0.0181; I2 = 0%) appeared. One case in the low- and moderate-density
Healthcare 2021, 9, 1427
sents the overall effect. The plotted squares denote SMD, and the whiskers denote their 95% CIs.
Confusion
Eleven cases with different stand densities were used for meta-analy1s5iosf.28Confusio
state was significantly relieved in the forest environment (SMD −0.41; 95% CI −0.60
−0.23; p < 0.001; I2 = 71%; 226 participants). As a result of subgroup analysis, there was
ssiiggnniifificcaannt tddiffieffreernecnecine tihnetehffeecetffseizcet asciczoerdaicncgortoditnhge
FFiigguurree55).)“. M“Medeidumiu”mef”feecftfiencthiignhh-diegnhs-idtye(nSsMitDy −(S0M.5D6;
9s−tt5o0a%n.5tdhC6e;Id9−es5nt0%as.7int8yCdt(oIPd−−seu0n0b.g7.s3ri8o5tu;ytppo(=<P−000su...0b03g005r2o0;u01pp;;
=
<
0.002
0.000
II2 == 4477%%)),,aanndd“s“msmalla”lle”ffeecffteincteixntreexmterleymheiglyh-hdiegnhsi-tdyeennsviitryonemnvenirtson(SmMeDn−ts0(.S19M; 9D5%−0C.1I 9; 95%
−−00..3355 too −−0.0033;;pp==0.00.108118;1I2; I=2 0=%0)%ap)paepapreeda.rOedne. Ocansee icnatshee ilnowth- eanldowm-odaenrdatem-doednesritayte-densi
eennvviirroonnmmenetnwt wasaesxeclxucdlueddferdomfrothme stuhbegsrouubpgraonualpysaisn.alysis.
Figure 5. Two forest plots of the change in confusion in subgroup analysis by stand density: high
(F1i0g0u0–re1550.0T/hwao), efoxtrreesmt eplylohtsigohf(1th50e0c/hhaan≤g).eTihnecdoantafuasreiornepionrtseudbagsrsotuanpdaarndaizlyesdismbeyansdtaifnfedrednecenssity: high
((S1M00D0–) 1an50d09/5h%a)c, oenxfitrdeemnceelyinhteigrvhal(s15(C0I0s/)h. aT≤h)e. Tdihaemdoantdaaatrteherebpoottrotemdparsessetnatnsdtharedoivzeerdalml eeffaenctd. iffer-
Tenhecepslo(tStMedDsq)uaanrdes9d5e%nocteonSMfidDe,nacneditnhteewrvhaislske(rCsIds)e.nTohteethdeiiarm95o%ndCIast. the bottom presents the overall
effect. The plotted squares denote SMD, and the whiskers denote their 95% CIs.
Fatigue
Eleven cases with different stand densities were used for meta-analysis. Fatigue
state significantly relieved in the forest environment (SMD −0.29; 95% CI −0.45 to −0.12;
p = 0.0006; I2 = 87%; 226 participants). As a result of subgroup analysis, there was a
significant difference in the effect size according to the stand density (Psubgroup < 0.0001;
Figure 6). A “small” effect in high-density (SMD −0.42; 95% CI −0.61 to −0.22; p < 0.0001;
I2 = 75%), and a very “small” effect in extremely high-density environments (SMD −0.09;
95% CI −0.19 to −0.01; p = 0.0890; I2 = 0%) appeared. One case in the low- and moderate-
density environment was excluded from the subgroup analysis.
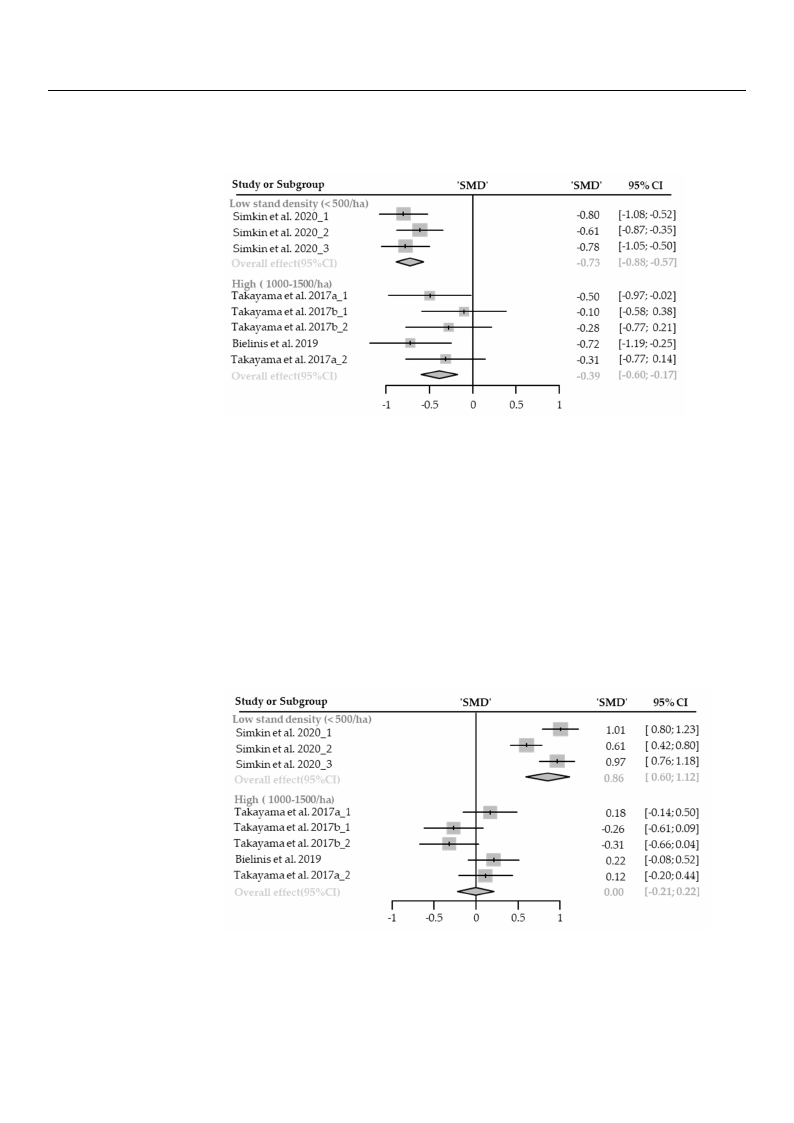
Vigor
Fifteen cases with different stand densities were used for meta-analysis. Vigor sig-
nificantly improved in the forest environment (SMD 0.23; 95% CI 0.07 to 0.39; p = 0.0041;
I2 = 84%; 300 participants). As a result of subgroup analysis, there was a significant dif-
ference in the effect size according to the stand density (Psubgroup = 0.0053; Figure 7). A
“small” effect in low-density (SMD 0.47; 95% CI 0.28 to 0.66; p = 0.0002; I2 = 55%) appeared,
however, there were no significant effects shown in high-density environments (SMD 0.13;
95% CI −0.22 to 0.48; p = 0.4787; I2 = 90%) and extremely high-density environments (SMD
0.19; 95% CI −0.02 to 0.39; p = 0.0821; I2 = 70%). One case in an environment with moderate
stand density was excluded from the subgroup analysis.
Healthcare 2021, 9, 1427
significantly relieved in the forest environment (SMD −0.29; 95% CI −0.45 to −0.12; p =
0.0006; I2 = 87%; 226 participants). As a result of subgroup analysis, there was a significant
difference in the effect size according to the stand density (Psubgroup < 0.0001; Figure 6). A
“small” effect in high-density (SMD −0.42; 95% CI −0.61 to −0.22; p < 0.0001; I2 = 75%), and
a very “small” effect in extremely high-density environments (SMD −0.09; 95% CI −106.1o9f 2t8o
−0.01; p = 0.0890; I2 = 0%) appeared. One case in the low- and moderate-density environ-
ment was excluded from the subgroup analysis.
Healthcare 2021, 9, x
FFiigguurree 66.. TTwwoo ffoorreessttpplloottssooffththeechchanagnegeininfaftaigtiugeuienisnusbugbroguropuapnaalnyasliyssbisy bstyanstdanddendsietnys:ihtyig: hhigh
(d(e11in0f0fc00ee00rs–e–1(n1S5c5M0e00s0D//(hh)SaaaM))n,,Ddaan)9nd5ad%needxxctor9tren5em%fmideecleylonynhcfiehigdiighnehtn(e1cr(5e1v05ai00nl/s0hte/(aCrh≤vI)asa.≤)lT.s)hT.(ehCTedIshad)te.iaadTmaahroeteanrddeaipraaeotmrtrthoeeenpddobarosattettsdottamhnaesdpbasroretdatstneiozndmetadsrptdmhrieezeseao1edn9vnedtmorsifafetfl3ahel1nre-
oevffeercatl.lTehffeecptl.oTttheedpslqouttaerdessqdueanroetsedSeMnDot,eaSnMdDth,eanwdhtishkeewrshdisekneortsedtheneiorte95t%heiCrI9s5. % CIs.
Vigor
Fifteen cases with different stand densities were used for meta-analysis. Vigor signif-
icantly improved in the forest environment (SMD 0.23; 95% CI 0.07 to 0.39; p = 0.0041; I2 =
84%; 300 participants). As a result of subgroup analysis, there was a significant difference
in the effect size according to the stand density (Psubgroup = 0.0053; Figure 7). A “small”
effect in low-density (SMD 0.47; 95% CI 0.28 to 0.66; p = 0.0002; I2 = 55%) appeared, how-
ever, there were no significant effects shown in high-density environments (SMD 0.13;
95% CI −0.22 to 0.48; p = 0.4787; I2 = 90%) and extremely high-density environments (SMD
0.19; 95% CI −0.02 to 0.39; p = 0.0821; I2 = 70%). One case in an environment with moderate
stand density was excluded from the subgroup analysis.
FFigiguurree77. .ThTrhereefeorfeosrtesptloptlsootsf tohfetchheacnhgaenigneviingovriignosruibngsruobugpraonuaplyasnisalbyysisstabnydsdtaenndsitdye: nloswity: low
(<(<550000/h/ah)a, )h, ihgihgh(1(010000–01–510500/0h/ah),ae),xetrxetrmemelyelhyihgihgh(1(510500/0h/ah≤)a.≤T)h.eTdhaetdaaatraearreeproerpteodrteads satsanstdaanrddairzdeidzed
mmeeaannddififffeerreenncceess((SSMMDD)) aanndd 9955%% ccoonnffiiddeennccee iinntteerrvvaallss((CCIIss))..TThheeddiiaammoonnddaatttthheebbootttotommppreresesenntststhe
thoeveorvaellraelflfeecftf.ecTth. eThpelopttleodttesdqusaqrueasrdeesndoetneoStMe SDM, aDn,danthdetwhehwiskheisrksedresndoetneottheetirhe9i5r%95C%IsC. Is.
NNeeggaattiviveeAAffffeecctt
s0dspsFi.ig0iiifgg<gf0nennu0i0rNfii1r.eNififie0;cnicc0aIni8cn2aa0n)ee=nne.1tclA;tti3cyalnday4Is“2as%etimefahls=fl;sleeewel1ewrvd3e2evii4ift0ianuifht%atehcpmetdce;aeddt”irdi1fisntiffe2iinfeficz0etnfriehretepehpcentaantheatcnetirecsnffttsfotosiftaelc)rroaocn.idenrpwtAdseidantss-sdindgtedzaeteneeestnnrvnno)eass.isviscirtittuihoctiAyrieolenoets(srmsnSsodwatMmwfieanesnnreeDrguetrndeesb−(ttuuSdogu(0slMreSstte.one7hMdoDud3sefip;fDtfos−9ysoatr50ua−rn%(.mbn5Pma06gdeslC.uy;er5tbdIotas96gari−-ue5;os-aun%ap,90npnst5.ah8=iaaC%tl8enlyy0Iyrtas.Ceso(−0ilPisy02Iws−.s.s8.uN7−ai02Nbs0s.;0eg,5eraFgt.7ot7goaihu;s0gatppie−tiugtriv0=<ovnre.ee4ei00−fwa28i..af;00c0)ffaa20.pfe.sen480Acc<221ttat;;;
“Im2 =ed0i%um), a”nedffaec“tsminallol”we-fdfeecntsiintyh(iSgMh-Dde−n0s.i7ty3;(9S5M%DC−I 0−.03.98;89t5o%−0C.5I 7−; 0p.6<00t.o00−001.;1I72 ;=p0=%0),.0a0n0d4;
a “small” effect in high-density (SMD −0.39; 95% CI −0.60 to −0.17; p = 0.0004; I2 = 0%)
appeared, one case in an environment with extremely high stand density was excluded
from the subgroup analysis, and no case with moderate stand density.
Healthcare 2021, 9, 1427
Negative Affect
Nine cases with different stand densities were used for meta-analysis. Negative affect
significantly alleviated in the forest environment (SMD −0.56; 95% CI −0.70 to −0.42; p <
0.0001; I2 = 34%; 120 participants). As a result of subgroup analysis, there was a significant
difference in the effect size according to the stand density (Psubgroup = 0.0282; Figure187)o.fA28
“medium” effect in low-density (SMD −0.73; 95% CI −0.88 to −0.57; p < 0.0001; I2 = 0%), and
a “small” effect in high-density (SMD −0.39; 95% CI −0.60 to −0.17; p = 0.0004; I2 = 0%)
aIp2p=ea0r%ed) ,aopnpeeacraesde,ionnaenceanseviirnonamn eenntvwiroitnhmeexntrtewmiethlyehxitgrhemstealnydhidgehnssittaynwd adsenexsictlyudweads
freoxmclutdheedsufrbogmrotuhpe asunbalgyrsoius,paanndanlyosicsa,saenwdintho mcaosdeewraitthe smtaondderdaetenssittayn.d density.
Healthcare 2021, 9, x
20 of 31
FFigiguurree88..TTwwoo ffoorreesstt pplloottss ooff tthhee cchhaannggee iinnnneeggaattiviveeaafffefeccttininsusubgbgroruouppanaanlaylsyissibsybystasntadnddednesnitsyi:tylo:w
l(o(9S<w5M5%0(0<Dc/5o)h0naa0fin)/d,hdhea9ni)g,5chhe%i(ig1nch0toe0(nr01vf–0ia1d0l5es00n–(0cC1/eI5his0na).0)t.eT/hTrhvahea)e.ldsdTiaa(hCtmeaIodsan)ar.etdaTraehatpreteohdrrieteaepbmdoooartnttsoedsdmtaaatnpsdtrsheatesraednbniodzttasetrdotdhmmiezepeodarvneemsrdeaenialfltfnseerfdtefhienfecfcetoe.rsveTen(hSrcaeMelsplDlo) tatnedd
esfqfeucatr.eTshdeepnlootteteSdMsDqu, arneds tdheenwotheiSskMerDs ,daendottehtehweihr i9s5k%ersCdIse.note their 95% CIs.
PPoossiittiivvee AAffffeecctt
NNiinnee ccaasseess wwiitthh ddiiffffeerreenntt ssttaanndd ddeennssiittiieess wweerree uusseedd ffoorr mmeettaa--aannaallyyssiiss.. PPoossiittiivvee aaffffeecctt
IssI2i2igg==nn9ii2ffi9i%2ccaa%;nn1;tt2ll1yy02ipi0mmaprpptarriocrotivvpiceeaiddpniatinnsn)tt.thhsA)ee.sffooaArrreseesssattueerlnntevvsouiifrrlosotunnobmmfgeesrnonututb((pgSSrMMaonuDDapl0y0.a.s33ni44sa;,;l9t9yh55s%e%irse,CCwtIIh00ae..s0r0e5a5
ttoo 00..6633;; pp ==00..00220022;;
wsigans iaficsaingnt difiifcfaenr-t
ednifcfeerienntcheeineftfhecetesfifzeectasciczoeradcincogrdtointghetosttahnedstdaenndsidtyen(sPistuybg(rPouspu<bg0ro.0up00<1;0F.0i0g0u1r;eF9ig).uAre“9b)i.gA”
“ebffiegc”t einffelocwt i-ndleonwsi-tdye(nSsMityD(0S.M86D; 905.%86;C9I50%.6C0 Ito0.16.012to; p1.<120;.0p0<010;.I020=018;0I%2 )=a8p0p%e)araepdp,ehaorewd-,
ehvoewr,evneor,snigonsiifgicnainfitcaenffteecftfewctaws sahsoswhonwinn ihnighhig-hd-ednesnitsyityenevnivriornomnmenentsts(S(SMMDD00.0.000;; 9955%% CCII
−−00.2.211toto0.02.22;2p; =p 0=.908.2948;2I42;=I255=%5)5. %On).eOcansee cinasaeninenavniroennvmireonntmweitnht ewxtirthemexeltyrehmigehlysthaingdh
dsteannsditydewnasistyexwclausdeexdclfurdomedtfhreomsutbhgerosuubpgarnoaulpysainsa, alynsdisn, aoncdasneos cwaistehsmwoitdhemraotedesrtaantedsdtaennd-
sditeynswiteyreweexrceluexdceldu.ded.
FFiigguurree 99.. TTwwoo ffoorreesstt pplloottss ooff tthhee cchhaannggeeiinnppoossiittiivveeaaffffeeccttininssuubbggrroouuppaannaalylysissisbbyystsatnanddddenensistiyt:yl:ow
l(o<w50(0</5h0a0)/,hhai)g, hhi(g1h00(01–010500–01/5h00a/)h. aT)h. eTdhaetdaaatraearreeproerpteodrtaesdsatasnsdtaanrddiazreddizmedeamnedainffedriefnfecreesn(cSeMs (DS)MaDnd)
a9n5d%9c5o%nficdonenficdeeinncteerinvtaelrsv(aClIss()C. TIsh).eTdhieamdioanmdoantdthaet tbhoettboomttopmrespernetssenthtse tohveeoravlelreaflfleecftf.eTcth.eTphleotted
psqloutaterdessdqeunaoretes SdMenDo,teanSdMtDhe, awnhdisthkerws hdiesnkoetres tdheeniro9te5%theCirIs9.5% CIs.
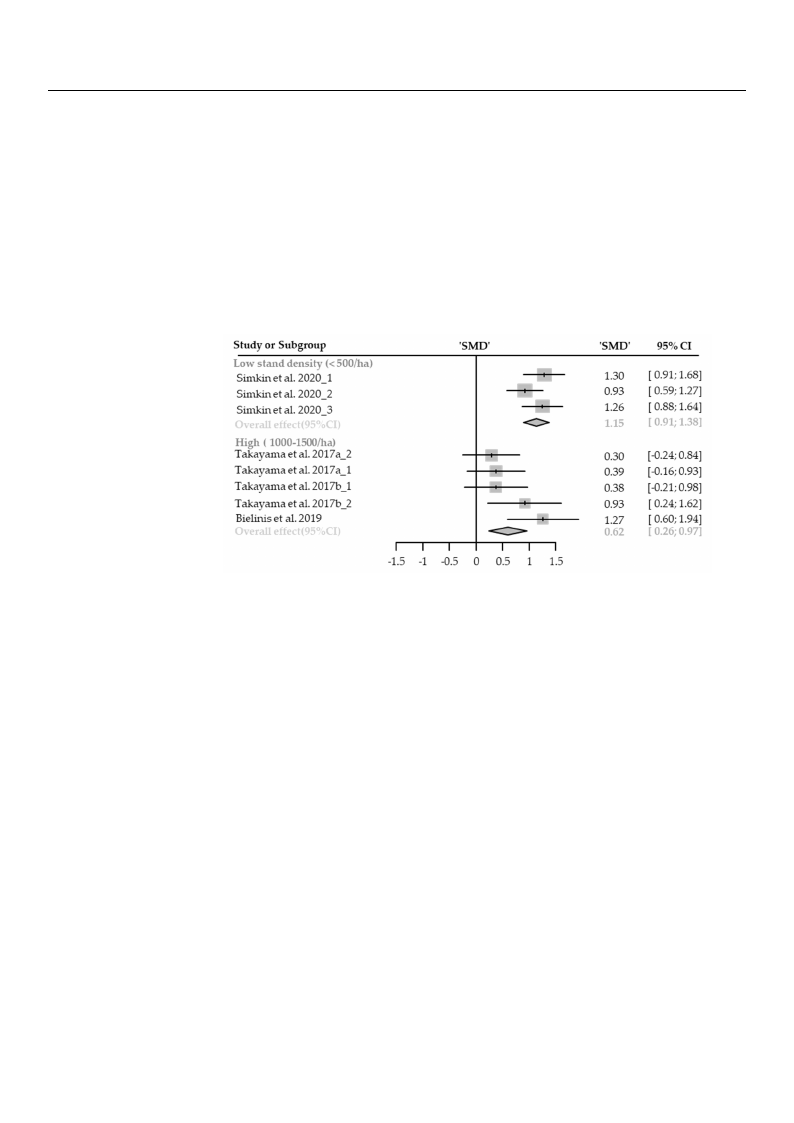
3.3.2. Cognitive Restoration
Restorative Experience
Nine cases with different stand densities were used for meta-analysis. Restorative
experience measured by ROS significantly increased in the forest environment (SMD 0.87;
2
Healthcare 2021, 9, 1427
Healthcare 2021, 9, x
18 of 28
3.4. Cognitive Restoration
Restorative Experience
Nine cases with different stand densities were used for meta-analysis. Restorative
experience measured by ROS significantly increased in the forest environment (SMD 0.87;
95% CI 0.62 to 1.11; p < 0.0001; I2 = 60%; 120 participants). As a result of subgroup
analysis, there was a significant difference in the effect size according to the stand density
(Psubgroup = 0.0385; Figure 10). A “big” effect in low-density (SMD 1.15; 95% CI 0.91 to 1.38;
p < 0.0001; I2 = 20%), and a “medium” effect in high-density (SMD 0.62; 95% CI 0.26 to
0.97; p = 0.0007; I2 = 43%) appeared. One case in an environment with extremely high
stand density was excluded from the subgroup analysis, and no cases with moder2a1teofst3a1nd
density were excluded.
FigFuirgeu1re0.1T0w. oTfworoesfot rpelsottspolof ttsheofchthanegcehiannRgeOSininRsOuSbginrousupbagnraoluypsisanbaylystsains dbydesntsaintyd: ldoewnsity: low
(<5(0<05/0h0a/),hhai)g, hi(g1h00(100–0105–0105/h00a/).hTah).eTdhaetadartae arereporerpteodrtaesdsatasnsdtaanrdaizrdedizmedemanedaniffdeirfefenrceensc(eSsM(SDM)Dan) dand
95%95c%oncfoidnfiendceenicneteinrvtearlvsa(lCsI(sC).ITs)h. eTdhieadmiaomndonatdthatetbhoettboomttopmrepsernestsenthtsetohveeoravlelreaflfleecftf.eTcht.eTphleotptelodtted
squsaqrueasrdesendoetneoSteMSDM, Dan, dantdhethwehwishkiesrksedrsendoenteottheetihre9ir5%95%CIsC.Is.
3.33.3.5. .PPhhyyssiioologiiccaall RReelalaxxaatitoinon
Diastolic Blood Pressure
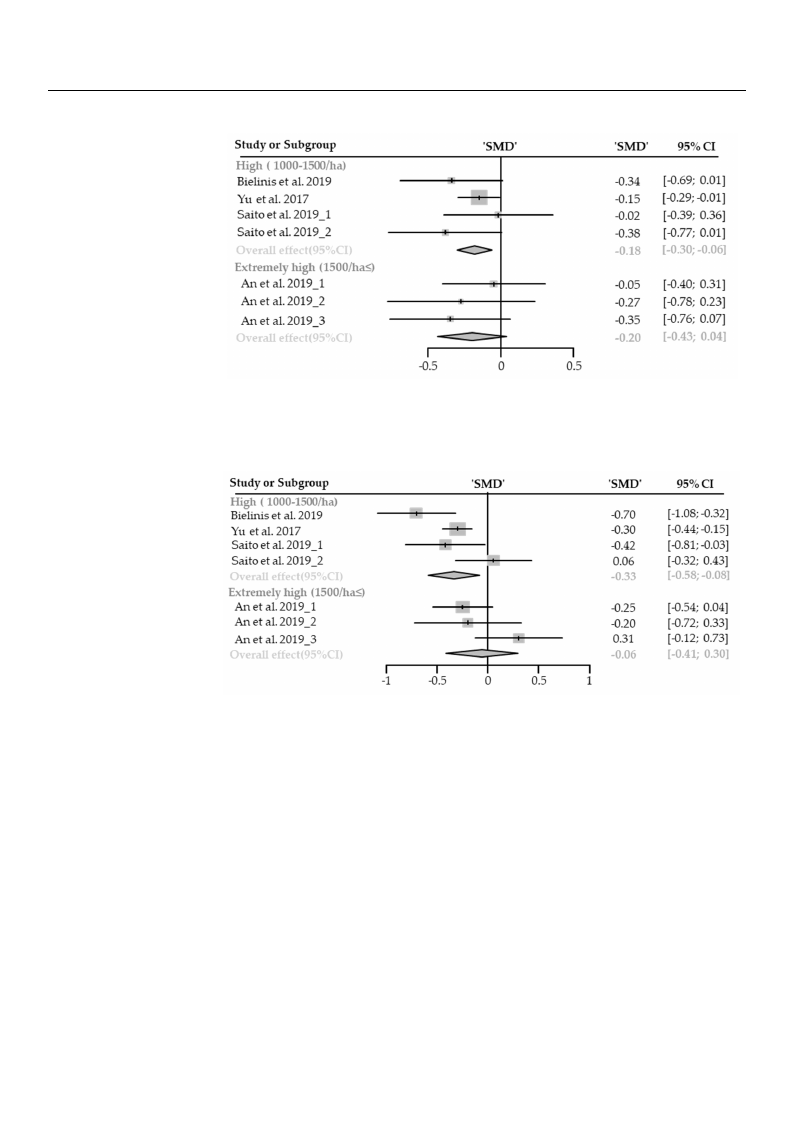
DiastoliSceBvelonocdasPersewssiuthredifferent stand densities were used for meta-analysis. Diastolic blood
preSsesvuerne sciagsnesifiwcainthtlydilfofwerernetdsitnantdhedfeonrseisttieesnwvierorenmuseendt (fSoMr mDe−ta0-.a1n8a; l9y5s%is. CDIia−s0to.2li9cto
blo−o0d.0p8r;epss=u0re.0s0i0g8n;iIf2ic=an0t%ly; 1lo7w9 peraerdticiinptahnetsf)o. rAestaernevsiurlotnomf seunbt g(SroMuDp a−n0a.1ly8;si9s5, %theCrIe−w0a.2s9no
to s−i0g.n08ifi; cpa=nt0.d0i0f0fe8r;eIn2 c=e0i%n ;th17e9efpfaercticsipzeanatcsc)o. rAdsinagretosutlhteosftsaunbdgdroeunpsitayn(aPlysusbisg,rotuhper=e0w.9a0s27;
noFsiiggunriefic1a1n).t Adif“fsemreanlcl”e einffethcteaepffpeecatrseizdebaoctchoirndihnigghto-dtehnessitayn(dSMdeDns−it0y.1(P8;su9b5gr%oupC=I0−.900.2370; to
Fig−u0r.e061;1p).=A0“.0s0m31a;llI”2 e=ff0e%ct) apnpdeeaxrterdembeoltyhhinigh-idghen-dsietnyseitnyv(irSoMnmDe−n0t.s18(S; M95D%−C0I.2−00;.3905%toCI
−0.−060;.4p3=to0.−0003.014; ;Ip2 ==00%.5)3;aIn2d=e0x%tr)e.mNeolycahsiegshw-diethnsloitwy -eannvdiromnomdenrattse(-SdMenDsit−y0e.2n0v;i9ro5n%mCeInts
−0.w43erteor−e0p.o0r4t;epd.= 0.53; I2 = 0%). No cases with low- and moderate-density environments
were reported.
Systolic Blood Pressure
Seven cases with different stand densities were used for meta-analysis. Systolic blood
pressure significantly lowered in the forest environment (SMD −0.23; 95% CI −0.43 to
−0.03; p = 0.0249; I2 = 61%; 179 participants). As a result of subgroup analysis, there was
no significant difference in the effect size according to the stand density (Psubgroup = 0.2179;
Figure 12). A “small” effect appeared in high-density environments (SMD −0.33; 95% CI
−0.58 to −0.08; p = 0.05; I2 = 63%), however, no significant effect was shown in extremely
high-density environments (SMD −0.06; 95% CI −0.41 to 0.30; p = 0.7459; I2 = 56%). No
cases with low- and moderate-density environments were reported.
Figure 11. Two forest plots of the change in DBP in subgroup analysis by stand density: high
Healthcare 2021, 9, 1427
to −0.08; p = 0.0008; I2 = 0%; 179 participants). As a result of subgroup analysis, there wa
no significant difference in the effect size according to the stand density (Psubgroup = 0.9027
Figure 11). A “small” effect appeared both in high-density (SMD −0.18; 95% CI −0.30 t
−0.06; p = 0.0031; I2 = 0%) and extremely high-density environments (SMD19−o0f.2280; 95% C
−0.43 to −0.04; p = 0.53; I2 = 0%). No cases with low- and moderate-density environment
were reported.
Healthcare 2021, 9, x
22 of 31
significant difference in the effect size according to the stand density (Psubgroup = 0.2179;
FFFiiggiguuurreree11112.1).T.TwAwoo“fsofmorersaetlslpt”lpoeltofsfteoscfottfhatephecphecahanargenedgieniniDnhBDiPgBhiPn-disnuesbnugsbriotgyurpoeunapnvaiarlnyosanilsymsbieysnsbttsyan(sdStaMdnedDnds−iet0yn.:s3ih3tyi;g:9hh5i%ghCI
−(1(010.005008–01t–5o1050−0/00h./0ah)8a,;e),pxter=xetm0re.e0mly5e;hlIiyg2 hh=i(g165h30%0(1/)5h,0ah0≤o/h)w. aT≤eh)ve. eTdrha,teandoaraestairgeapnroiefritrecedapnaostrsteetfadfnedacastrsdwtiazanesddsamhredoaiwnzedndififmnereeeanxncterdseimffeerl-y
h(SeiMngchDe-s)da(eSnnMdsi9Dt5y)%eacnnodvni9fir5od%ennmcceoeninnftitsder(evSnaMclseD(iCn−Itse0)r..v0Ta6hl;se9(d5Ci%aImsC).oITn−dh0ea.4td1tihatemobo0on.t3tdo0ma; tppt=hree0s.eb7no4tt5st9oth;meI2op=vree5rs6ae%lnl t)es.ffNtehcoet. coavseersall
wTehifetfhepclltoo.tTwtehd-easpqnuldoatrmteesdoddseqenuroataetreeS-sMddDeen,nasonittdyetSehMne vwDihr, ioasnknemdrstehdneetnswowtheiesthrkeeirrse9dp5%eonrCoteItsed. .their 95% CIs.
Systolic Blood Pressure
Seven cases with different stand densities were used for meta-analysis. Systolic bloo
pressure significantly lowered in the forest environment (SMD −0.23; 95% CI −0.43 t
−0.03; p = 0.0249; I2 = 61%; 179 participants). As a result of subgroup analysis, there was n
FFiigguurree 1122.. TTwwoo ffoorreesstt pplloottss ooff tthheecchhaannggee iinnSSBBPPiinnssuubbggrroouupp aannaallyyssiiss bbyy ssttaanndd ddeennssiittyy:: hhiigghh
((11000000––11550000//hhaa)),, eexxttrreemmeelylyhihgihgh(15(10500/0h/ah≤a)≤.)T. hTehdeadtaataarearreeproerpteodrtaesdstaasnsdtaarnddizaerddimzeeadnmdiefafenrednicfefesr-
e(SnMceDs )(SaMndD9)5a%ndco9n5fi%decnocnefiindteenrvcealisn(tCerIsv)a. lTsh(Ce Idsi)a.mThoneddaiatmthoenbdotattotmhepbreostetnotms tphreeosvenertasltlheeffoecvte. rall
eTfhfeecpt.loTthteedpslqoutaterdessdqeunaorteesSdMeDno, atendSMthDe w, ahnidsktehrse dwehnoistkeetrhseidre9n5o%teCtIhs.eir 95% CIs.
Heart Rate or Pulse Rate
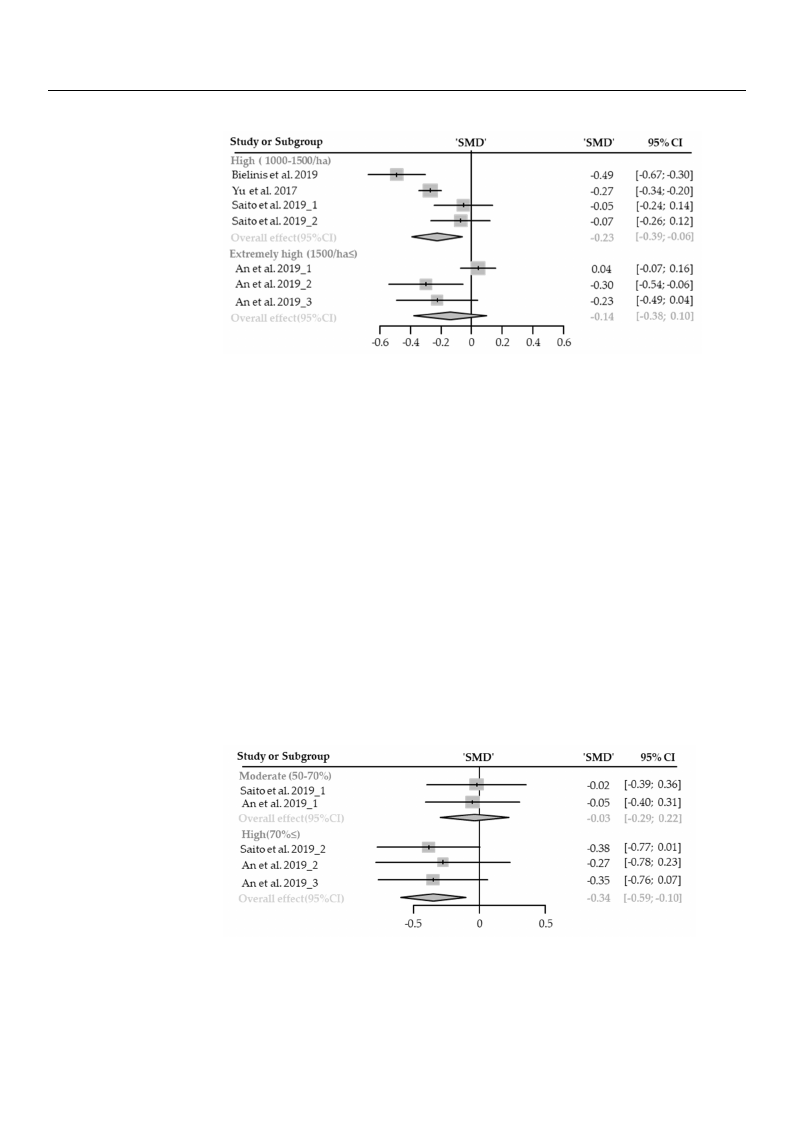
HearSteRvaetnecoarsePsuwlsiethRdaitfeferent stand densities were used for meta-analysis. Heart rate or
pulseSreavtensicgansiefiscawnittlhy dloiwffeerendtinstathnedfodreensst ietnievsirwonermeeunste(dSMfoDr m−0e.t1a9-a; 9n5a%lysCisI .−H0e.3a3rttorate or
p−u0l.s0e5;rpat=e0s.i0g0n91if;icI2an=t8ly3%lo; w17e9repdartinicitphaentfso)r. eAsst aenrevsiuroltnomf seunbtg(rSoMupDa−n0a.l1y9si;s9, 5th%ereCwI −a0s.33 to
−n0o.0s5ig;npifi=c0a.n0t0d9i1ff;eIr2e=nc8e3%in;t1h7e9efpfeacrttisciizpeaanctcso)r.dAinsgatoretshuelsttoafndsudbegnrsoituyp(Pasnuabglryosuips,=th0.e5r5e6w5; as no
hsF−hcF−i0aiiiiggg0gg.s3n.euhuh39sirr--9fddeewittcoeeo11ainn3t−3n−hs)s0).tii0.l.ttA0oy.dAy06wi6e“e;f;“n-fsnpepsmavvrm=n=ieiardr0onal0ol.nl.c”m0n0lem”00emo77fieedfn66enefe;;fnctreItIstta2h2csat(te==eSp(-SaM77pedpM99feeDf%p%aneDres)c−)e,ait,−dthr0yh0seo.iio1.endwz14wne4he;iv;nev9iai9gvre5ch5ohr%ec,%ni-rogndm,CroheCndIen-soIidn−sing−itestgs0n0inyg..iw3s3fiten8oi8ecntiayrftvtteionohicertra0e0onee.n.np1vfs1tf0motie0are;rc;oefntptpefnndwe=dt=mcs.ad0t0s(e..weS22nsnM5h5tas2so2sDi8w8t(s;yS;−hnIIM2o(20iP=n=w.D2sue773nbx5−5;gti%r0%9ron5.eu2))p%me..3x=NN;eCtl9roo0yIe5.c5m%a5se6Cel5ysI;
with low- and moderate-density environments were reported.
Healthcare 2021, 9, 1427
pulse rate significantly lowered in the forest environment (SMD −0.19; 95% CI −0.33 to
−0.05; p = 0.0091; I2 = 83%; 179 participants). As a result of subgroup analysis, there was no
significant difference in the effect size according to the stand density (Psubgroup = 0.5565;
Figure 13). A “small” effect appeared in high-density environments (SMD −0.23; 95% CI
−0.39 to −0.06; p = 0.0076; I2 = 79%), however, no significant effect was shown in extr2e0moef l2y8
high-density environments (SMD −0.14; 95% CI −0.38 to 0.10; p = 0.2528; I2 = 75%). No cases
with low- and moderate-density environments were reported.
Healthcare 2021, 9, x
Figure 13. TTwo forest plots of the change in heart rate and pulse rate in subgroup analysis by stand
sdteansditdye: nHsitgyh: H(1i0g0h0–(10500–/1h5a0)0, /ehxat)r,eemxetrleymheiglyhh(1ig5h00(/15h0a0≤/h).a≤T)h. eTdheatdaaatraearreeproerpteodrteads satsans2tda3anroddfair3zd1e-d
imzeedanmdeiaffnerdeinffceerse(nScMesD()SaMnDd)9a5n%dc9o5n%fidceonncfeidienntecrevianlste(rCvIasl)s. (TChIes)d. iTahmeodnidamatotnhde batottthoemboptrteosmenptsreth- e
soevnetrsatlhl eefofevcetr. aTllheefpfelcott.teTdhesqpuloatrteesddseqnuoatreeSsMdeDn,oatnedSMthDe w, ahnidsktehres wdehnisokteertshdeiern9o5t%e tCheIsir. 95% CIs.
3.46.TCChaaenncooappnyyoDDpeeynnsdsiitetyynasaistyanwEaffsecctlaMssoidfiieffiiderinoftoThtherraepeeugtriocuEpffse:cltow for <50%, medium for 50–
70%, anTdhehicgahnofopry≥d70en%s.itWy ewcaosndcluacstseifidesdubingtroouthpraeneaglyrosiusposn: blolowodfoprr<es5s0u%re, ,mheeadriturmatefo, r
an5d0–p7u0l%se, arnatde,hwighhicfohra≥re70in%d.iWcaetocrosnodfupctheydssioulboggriocaulpraenlaaxlyatsiiosnonefbfelocot.dDpureestsourthe,ehleimarittreadte,
nuamndbepruolsfestruadtei,esw, hwicehcaanrenointdciocnadtourcstosfupbhgryosuioploagniaclaylsriesloaxnaetmionoteioffneaclt.aDnduecotognthiteivleimreitse-d
tonrautmiobne. rThofe srteusudlitess,fowr eeaccahnenfofetcctoinndduiccattosruabrgeroduepscrainbaeldysinissounbseemctoiotinosn. al and cognitive
restoration. The results for each effect indicator are described in subsections.
3.4.1. Physiological Relaxation
3.6.1. Physiological Relaxation
DDiaisatsotloicliBc lBoloododPrPersessusruere
FiFvievecacasesesswwiitthh differeennttccaannooppyydednesnistietisews ewreerueseudsefodr fmoretam-aentaa-laynsiasl.yDsiisa.stDoilaicstbolloiocd
blporoedsspurresssiugrneifisciganitfliycalonwtlyerleodwinertehde ifnortehset (fSoMreDst −(S0M.1D9; −905.%19C; 9I 5−%0.C37I t−o0.−370.t0o2;−p0.=020;.0p3=28;
0.0I23=280;%I2; =300p%a;r3ti0cippaarnttisc)i.pAanstas)r.eAsusltaorfessuubltgorofuspubagnraolyuspisa, nthaelyresiws,atshaermeawrgaisnallmyasrigninifiacllaynt
sigdnififfeicreanctediinffethrenecfefeicnt sthizeeeafcfceoctrdsinzeg atocctohredcinangotpoythdeencasintyop(Pysdubegnrosuitpy=(P0s.u0b8gr9o0up; F=i0g.u0r8e901;4).
FiAgu“rsem1a4l)l.”Aef“fsemctaallp”peefaferecdt aipnpheiagrhe-ddiennshiitgyhe-dnvenirsoitnymeennvtisro(SnMmeDnt−s 0(.S3M4;D95−%0.3C4I; 9−50%.5C9 Ito
−0−.509.1to0;−p0.=100; .p00=606.;00I266=; I02%=)0w%h) iwlehniloe nsoigsniigfinciafinctaneftfefcftecwtawsasshsohwonwnininmmodoedreartaet-ed-denesni-ty
siteynevnirvoinromnemnetsn(tSsM(SDMD−0−.00.30;39; 59%5%CCI I−−00..2299 ttoo 0.22; p = 00..88000055;;II22==00%%).)N. Noocacsaesseswwithithlolwow
cacnaonpoypydednesnitsiietisews wereerererpeoprotretde.d.
FiFgiugruer1e41.4T.wTwo ofofroersetspt lpoltostosfotfhtehechcahnagnegeininDDBPBPininsusubgbrgoruouppananalaylysissisbbyycacannooppyyddeennsistiyty: :mmooddeer-rate
at(e5(05–07–07%0%),)e,xetxrtermemeleylyhihgihgh(7(07%0%≤≤)).. TThhee ddaattaa aarree rreeppoorrtteedd aass ssttaannddaarrddiizzeedd mmeeaann ddiiffffeerreenncceess (SMD)
(SaMnDd)9a5n%d c9o5n%ficdoennfcideeinncteerivnatlesrv(CalIss)(.CITsh).eTdhieamdioamndonadt tahtethbeotbtootmtomprepsreensetsnttshethoevoevrearllalelfefeffcetc. t.The
ThpeloptltoetdtesdqusqarueasrdesendoetneoSteMSDM, Dan, dantdhethwehwishkiesrksedrsendoetneottheetihre9i5r%95C%IsC. Is.
Systolic Blood Pressure
Five cases with different canopy densities were used for meta-analysis. Systolic blood
pressure significantly lowered in the forest (SMD −0.11; 95% CI −0.35 to 0.13; p = 0.3744; I2
= 48%; 30 participants). As a result of subgroup analysis, there was a significant difference
in the effect size according to the canopy density (Psubgroup = 0.00271; Figure 15). A “small”
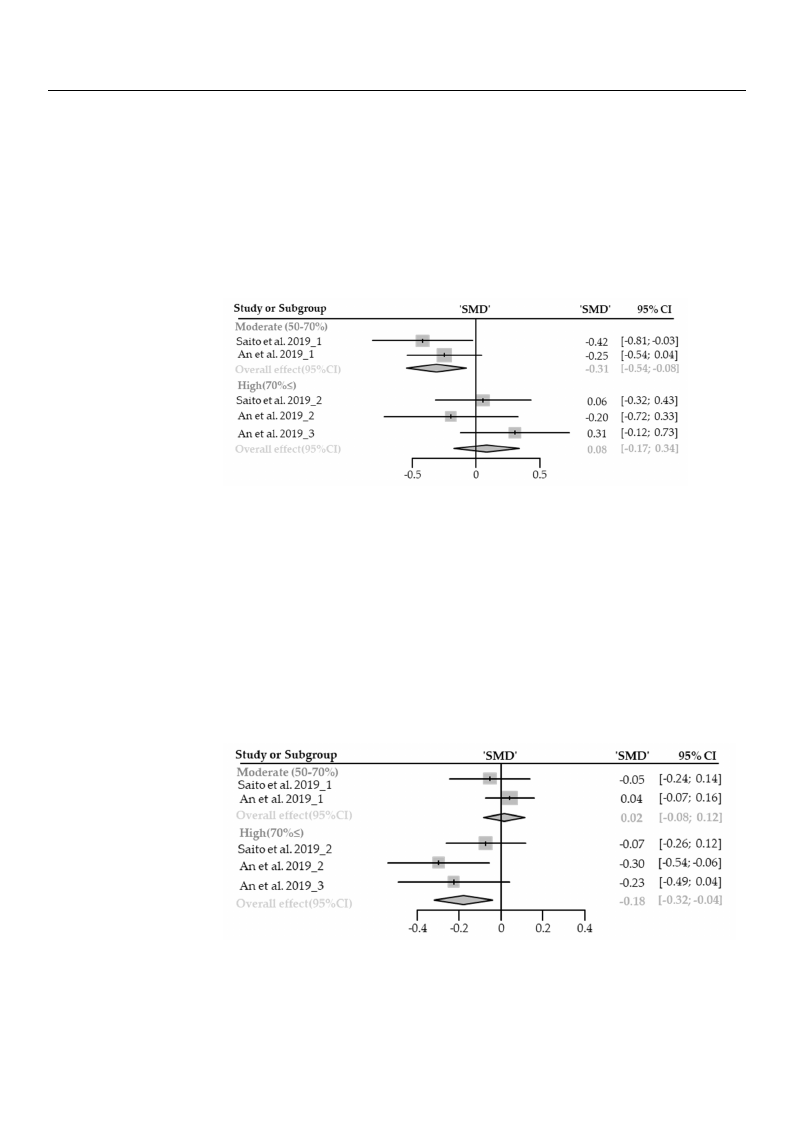
Healthcare 2021, 9, 1427
Healthcare 2021, 9, x
Healthcare 2021, 9, x
21 of 28
Systolic Blood Pressure
Five cases with different canopy densities were used for meta-analysis. Systolic blood
pressure significantly lowered in the forest (SMD −0.11; 95% CI −0.35 to 0.13; p = 0.3744;
I2 = 48%; 30 participants). As a result of subgroup analysis, there was a significant differ2-4 of 31
ence in the effect size according to the canopy density (Psubgroup = 0.00271; Figure 15). A
“small” effect appeared in moderate-density environments (SMD −0.31; 95% CI −0.35 to
0.13; p = 0.0096; I2 = 0%) while no significance effect was shown in high-density environ-
ments (SMD 0.08; 95% CI −0.17 to 0.34; p = 0.5288; I2 = 6%). No cases with low24coafn3o1py
densities were reported.
Figure 15. Two forest plots of the change in SBP in subgroup analysis by canopy density: moder-
ate(50–70%), extremely high (70%≤). The data are reported as standardized mean differences
(TaFStiheMg(Fe(5u5iD0pgr0–eu–l)7o7r1a0et05n%t%.e1dT)5d),,.w9eseT5xoqxw%ttufrrooeeacrmmfreooeseenrstlelyfypsditdlhehopeinitgglnsoohhcottsee(f(77otiS00hnfM%%etthe≤≤cDreh)v).,ac.TahanTlhnagshenede(gdCitdneahIatisSeant)Ba.waSPTarBehrihPenireseirsknepdueposibraourgstmrbretdogdeourednoanpsaudoaspstnatseaatatnnatltyhndahseldaeyiirsarsdbribd9sioyz5itbeztc%ydoeadmncmCaomneIppsaoeyr.npaednysdeeiddnfnfeiseftnifsrtesyetrin:theymcne:ecosmoedvsoee(drSr-eaMrlalDtee)ffect.
(SManDd) a9n5%d 9c5o%nficdonenficdeenincteeirnvtaelrsv(aClsIs()C. ITs)h. eThdeiadmiaomnodnadt atht ethbeobtotottmomprperseesnetnststhteheovoverearlallleefffefecct.t. The
HThepealporlttoteRtdteadstqesuqoaurraersPeduseldnseoenteoRtSaeMtSeMD,Da,nadntdhtehwe hwishkisekrserdsedneonteottehethirei9r59%5%CICs.Is.
HeHaretFaRrivtaeRteactoaersoePrsuPwlsueiltsRheadRteiaftfeerent canopy densities were used for meta-analysis. There was no
−sws−ii00gga..ns−22nnsios11i0iFf,af.sit2ititciocvohsg1Faaein0eing0nvt.ricto0.nfieeta03ccis03wcch;faea.ih;pan0scaspan3ats=weng;ncs=a0ihegpttw.0ha1seid.in=4ni1dgtii6gh4fnnih00eff6if.;eedfi1ehi0aIrni4rc2;efere6aft=haInen0n2errrc5t;ttaa=ee1ctrnId%rae52titainn1fr;o=tcfoa%e3earttp0ren5h;poey1oepo3nur%dpra0cleepysre;pftenpufuid3isceanill0ieincssrtpneitttepeahitscishsnaiieniitnertwpzisteteieh)fafetsc.ofhnerieaArwpeetcefcsaosutesc)fnrtrssao.oeeteierAsrszrdndu)teee.svsssefionauetniaArcrdglvoetcrmsinnofeortoomorvaesfdrntuisaetrrimmulnhen-otabsgteeenonugnt(mtaafcrlStotol-asM(yaeunSoutsnnhpMDfoibatsepsgl.aDy−(ucTynrS0saboah−Mi.nd0gsuley0o.9rerpD.sop;eTn0iu9ys9awhs−,5p;nied0att%9rahys.ea5e0lenn%nyC(9rwsaPose;IiCliatsy9suysI-b,5gt%rhouepCr=eI
0−w00..00a((.212PSs686Msau0;0b;D9s;giF5rFg−oi%nigug0piuf.uC1ir=cer8Iae0;−n1.9060t152).6d%3.6)i20A.fC;ftAeFIo“ri−seg−“mnu00scra..me3e0l2l41ia”n6;tlo)lept.”fh−fA=eee00c“fe.tf.0s0fem4wf1ce;ta2caplt6swl=”;saiIae0zp2fs.epf0=e1eac12apct16rcwpe%;odeIar2)dasiw=riannep1hgdhp1iite%lgioeanh)rnt-ewhhddoeeihgisnincilhsaeghi-ntnndiyogioepfheinsy-cndisagvdienntineyricnsofieisnectiyeamntyfnevfecnei(nerPvctoitessrunfwobf(gmenSraocMmuetspnewDs=nthastoss(wSMn iDn
m−0o.s1hd8oe;wr9a5nt%ei-nCdIme−no0sd.i3te2yrateoten−-vd0i.e0rno4s;niptmy=ee0nn.0tvs1i2r(o6S;nMIm2 D=en101ts.%0(2)S;wM9h5Di%le0.nC0o2I;s−9ig05n.%0i8fiCctaIon−0ce0.1.e02f8;feptcot=0w0.1a.27s;4sp0h9o=;wI0n2.7=i4n009%; ). No
cmaosI2eds=erw0a%tiet)-h.dNelonowsictaycsaeensnovwpiriytohndlmeonwensicttsaine(SsoMpwyDedr0ee.n0rs2ei;tpi9eo5sr%tweCedrI.e−r0e.p08orttoed0..12; p = 0.7409; I2 = 0%). No
cases with low canopy densities were reported.
oFFompipigegdFyyauuiendgdrrneeuedesnr1nii1tefs6syf6i.e1ti:.tyTr6myTe:w.n:mwToomcwdoeofesdooofrde(roafSeroetraMsererttease(Dsp5ttt(le)05pop–a0(tll7sn5oo–007dttos%s0–f9%o7o)t5hf,0f)%ete,%thxehccet)xhroe,tceanrehcmenfxhaimgtdenareleegenylniemynghcieehnihegileiihghynnaehtr(haeht7(rrie0r7tvgaa%0raht%rale≤tst(≤ear7)()n.aCa0. dTtnT%Ieshdhp)≤ae.eup)nTd.ldusdhTaalesetthpeaardeauraaitaaldrertsemeeaeinrtroiearennspapuasdtoouebrrraebgttiteegnrrdtodrehosupaaeuupssopbbrsasogtattntaearntanodnoaldydumlyasaapssirrpsiddsasrbiitenbzzyasayeeneclddncydaatnmsasni-rsoedapbinyzyecdan-
mtheedaoinfvfeedrrieafnlflecerefesfne(cScteM. sTD(hS)eMapnlDodt)t9ea5dn%dsqc9uo5an%rfiedscedonencnfeioditneetnSecMrevDainl,sate(nCrdvIstah)l.seT(wChheIissd)k.ieaTrmhs oednedndioaatmet ttohhneedirbao9tt5t%tohmeCIbpsor. etstoenmtsptrheesents
theovoevrearlal lelffeefcfte.cTt.hTe hpelopttleodttseqduasrqeus adreensodteeSnMotDe,SaMndDt,haenwdhtihskeewrshdiesnkoetrestdheeinro9t5e%thCeIisr. 95% CIs.
3.5. Other Possible Effect Modifier
3.5. OTthheeirnPclousdsiebdlestEufdfeicetsMweordeifcioernducted on forest sites in East Asia, Central Europe, and
NorthTehren iEnuclruopdeed(Fsitguudreies17w).eWreecoanlsdouccltaesdsifoiendfomreasntasgietmeseinnt EtyapstesAosifat,hCeefnotrreasltEinutroope, and
N“coormthmeerrnciaElufororepset,”(Faimguanreag1e7d).foWreset faolrsotimclbaesrspifrioedducmtiaonnaagnedmcoemntmteyrpcieasl uosfe,t“hfeorfeosrtest into
“recsoemrvme,”eracsiatrlicfotlryepstr,o”teactmedanfoargeestd, afnodre“sutrfboarntifmorbesetrs”pfroordeustcltoicoanteadnwdicthoimn mwaelrkciinagl udisse-, “forest
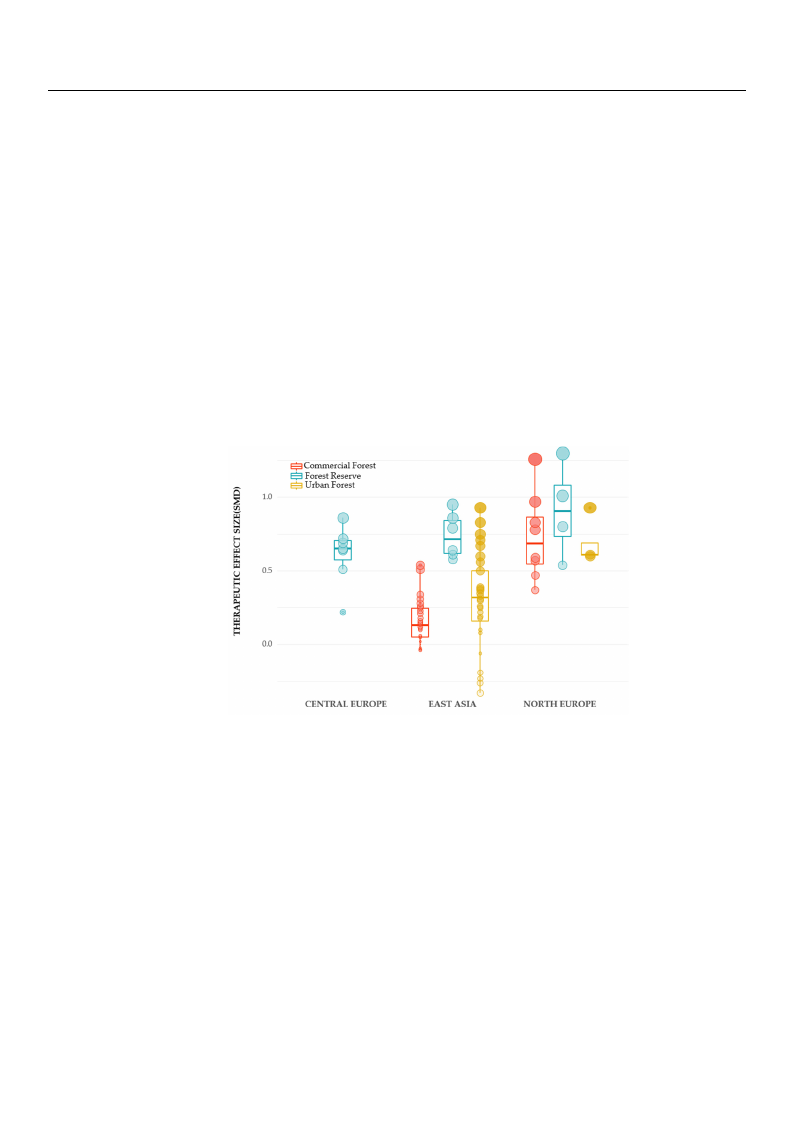
Healthcare 2021, 9, 1427
Healthcare 2021, 9, x
22 of 28
3.7. Other Possible Effect Modifier
The included studies were conducted on forest sites in East Asia, Central Europe,
and Northern Europe (Figure 17). We also classified management types of the forest into
“commercial forest,” a managed forest for timber production and commercial use, “forest
reserve,” a strictly protected forest, and “urban forests” forest located within walking
distance from the city. In addition to the structural characteristics, we found region and
management type as a possible effect-modifier. We compared the therapeutic effects on
mental health, including emotional and cognitive restoration, by region and manage2m5 oefnt31
type. By region, the biggest effect was shown in Northern Europe (mean 0.912, median
0.905), followed by East Asia (mean 0.738, median 0.715), and Central Europe (mean 0.612,
median 0.650). By management type, the effect size showed the biggest in a forest reserve
inthteheorodrdereroof fNNoortrhtheerrnnEEuurrooppee((mmeeaann 00..991122;; mmeeddiiaann 00..990055)),, EEaassttAAssiiaa((mmeeaann00.7.73388; ;mmeeddiainan
00.7.71155),),ananddCCenetnrtarlaEl uEruorpoep(em(meaena0n.601.621; 2m; emdeiadnia0n.605.06)5.0B).yBmyamnaagneamgeemntetnytpteyapnedarnedgiroengiionn
EiansEt AasstiaA,sfioar,efsotrreessterrevseer(vmee(amne0a.7n308.;7m38e;dmiaend0ia.7n105.)7h1a5d) hthade bthigegbeisgtgeefsfet cetffseizcte,sifzoell,ofwolelodwbeyd
ubrybaunrfboarnesfto(rmeseta(nm0e.2a9n2;0m.29e2d;iamne0d.3ia2n0)0a.3n2d0c)oamndmecorcmiaml feorrceisatl (fmoreeasnt 0(m.15e1a;nm0e.1d5i1an; m0.e1d30ia)n.
O0n.13th0e). oOtnhetrhehaonthde,rinhatnhde,cianstehoefcNasoerothf eNrnorEthuerronpEe,ufroorpees,tfroerseesrtvrees(emrveean(m0.e9a1n3;0.m91e3d;imane-
0d.9i0a5n)0h.a9s05th) ehabsigtgheesbt iegfgfeecsttseifzfee,cftoslilzoew, efodllboywceodmbmyecrocmiaml foerrceisatl(fmoreeasnt 0(m.73e0a;nm0e.7d3i0a;nm0e.6d8i5a)n
a0n.d68u5r)baanndfourrebsatn(mfoeraenst0(.m68e8a;nm0e.6d8ia8n; m0.e6d1i0a)n. 0.610).
FFigiguurere1177. .BBooxxpplolottssccoommppaarriinnggtthheetthheerraappeeuuttiicc eeffffeeccttss bbyy rreeggiioonnss ((CCeennttrraall EEuurrooppee,, EEaassttAAssiiaa,,aanndd
NNoortrhthEEuurorpope)ea) nadndfofroersetsttytpyepse(sco(cmommemrceiracliafol rfeosrte,sfto,rfeosrtersetsreersveer,vuer,buarnbafonrefostr)e.sTt)h.eTohveeorvlaeprplaepdpdeodts
pdreostesnptrsetsaenndt asrtadnizdeadrdmizeeadnmdeifafenrdenifcfeesre(nScMesD()SMonDe)moonteiomnoatliorensatlorreastitoonraatinodn caongdnciotigvneitrievsetorreasttioorna-
etxitornacetxetdrafrcotemd ifnroclmudinedclustdueddiesst.udies.
44. .DDisisccuusssioionn
InInrerecceennttyyeeaarsrs, ,ththeeththeerarappeeuutitcicppootetenntitaial loofffoforerestsstshhaassbbeeennggraradduuaalllylyrerceocoggnnizizededinin
vvaariroiouussccoouunntrtireies,s,aannddththeennuummbbeerroof fininvveestsitgigaatitoionnssoof fththeeththeerarappeeuutitciceefffefectctaaccocordrdininggtoto
ththeefoforereststcchhaararaccteterirsitsitciscshhaassininccrereaasesedd. .InInththisisrereggaardrd, ,wweetrtireieddtotoidideenntitfiyfyththeererelalatitoionnshshipip
bbeetwtweeeenntthheerraappeeuuttiicc effects aannddffoorreessttsstrturucctuturere. .WWe heyhpyopthoethsiezseizdetdhatthsattanstdanddendseitnysaitnyd
acnadnocapnyodpeyndsietnyswityillwaicllt aacst masamjoar jeofrfecffte-mct-omdiofdieirfisearsffaecffteinctginfgorfeosrtess’ttsh’ ethraepraepuetiuctiecffeefcftesctosn
oenmeomtiootnioanl raelsrteosrtaotriaotnio, cno, gcnogitniviteivresrteosrtaotrioanti,oann,danpdhypshioylsoiogliocaglicraelarxealatixoanti.oTnh.iTs hstius dstyusdyys-
styesmteamtiactailclayllsyeasrecahrecdh,esdu, msummamrizaerdiz,eadn,dansydnstyhnesthizeesdizperdevpiroeuvsiosutusdsiteusdeixeas mexinaimngintihneg tthheer-
thapereaupteicuetifcfeecftfsecotfsvoafrvioaurisofuosrefostreesntveinrovnirmonemntesnwtsitwhidthifdfeirfefenrtesnttrustcrtuucrtaulrvaal rviarbilaebsl.es.
AAssaareresusultltooffmmeetata-a-annaalylyssisis, ,sstatannddddeennssitiytyssigignnifiifcicaannttlylymmooddifiifeieddtthheeeefffeeccttoonneemmoo--
titoionnaal laannddccooggnnitiitviveerreesstotoraratitoionn. .AAnnxxieietyty, ,aannggeer,ra, nanddnnegegataitviveeaafffefcetctddecerceraesaesdedththeemmooststinin
ththeeloloww-d-deennsistiytyfoforersetstwwhhereerethtehestsatnadnddednesnistyitywwasalselsesstshtahnan50500/0h/haa. .InInccoonntrtarasts,t,ththeeeefffefcetct
ssizizeebbeeccaammeessmmaalllelerroorrininsisgignnifiifcicaannttaassththeetrtereeeddenensistiytyinincrceraeasesded. .TThheererelileievvininggeefffefcetctoonn
ccoonnfufussioionnaannddfafatitgiguueeaalslsooddeeccrereaasseeddaassstsatannddddeennsistiytyinincrcereaaseseaannddshshoowwededththeesmsmalallelsetst
effect size in the extremely high tree density of 1500/ha or higher. The improvement of
depression and enhancement of vitality and positive effects were significant only in the
low-density forest with a stand density less than 500/ha. There was the largest increase in
restorative experience in the low-density forest with a stand density less than 500 trees

Healthcare 2021, 9, 1427
23 of 28
effect size in the extremely high tree density of 1500/ha or higher. The improvement of
depression and enhancement of vitality and positive effects were significant only in the
low-density forest with a stand density less than 500/ha. There was the largest increase in
restorative experience in the low-density forest with a stand density less than 500 trees per
hectare. Hence, mental recovery was greatest in low-density forests and decreased as the
stand density of trees increased. On the other hand, there was no significant difference in
physiological relaxation by stand density. It might be due to physiological outcomes were
investigated only under high or extremely high stand density conditions.
By dividing the subgroups, we observed a decrease in heterogeneity within each
subgroup and found significant differences between the subgroups. It suggests that stand
density modifies the therapeutic effect of forests. However, in depression, anger, fatigue,
and vitality, we found non-negligible heterogeneity in forest environments with high stand
density between 1000/ha and 1500/ha. High heterogeneity in those subgroups suggests
a need for more tightly divided subgroups with a stand density greater than 1000 trees
per hectare. Furthermore, few studies investigated moderate-density forests with a stand
density between 500/ha and 1000/ha. Considering that previous studies estimated the
most significant therapeutic effect in the middle level of stand density [59,60,65], it is
necessary to investigate the therapeutic effect of moderate-density forests with a stand
density between 500/ha and 1000/ha.
Depending on canopy density, the physiological relaxation indices showed inconsis-
tent and opposite trends. This is thought to be due to the limited number of investigations
reporting the canopy density. A review of literature on the therapeutic effects of forests
noticed the insufficient number of studies that measured and reported canopy density of
forest sites. Furthermore, most literature reported tree cover, which indicates a level of
greenness at the landscape level, not at the spatial level that humans can perceive. For fu-
ture guidance on the therapeutic use of forests, studies should include detailed descriptions
of the forest sites where the participants perform their activities.
The structural variables used in this study—stand density and canopy density—are
widely reported variables in forest management, growth monitoring, and tree ecology
studies. Through a review of publications from 1989 to 2021 reporting the health effects of
forests, we found that structural characteristics of forest environments began to be described
earnestly after 2017. This may reflect the international trends of increasing collaboration
between forestry and the health sector [13,95,96]. Forests have long been treated as natural
resources for production or conservation. However, in recent decades, several countries in
East Asia, Europe, and North America have begun to recognize forests’ preventive medical
potential and managed forests to promote public health [11,95–97]. For example, Japan has
continuously certified forests rich in therapeutic effects through on-site verification since
2006 [98]. Korea has been creating national healing forests since 2010 [95,99]. Denmark
established the Healing Forest Garden Nacadia [100] and Finland established the first
‘Forest Wellness Trail’ in 2010. The German state of Mecklenburg-Pomerania also started
operating a legal designation system for forests with excellent recreational and therapeutic
properties in 2019 [99]. In addition, Finland, North America, and Canada have recently
supported health promotion activities based on natural environments [24,97].
This study has several limitations. First, the study design was not limited to ran-
domized controlled trials (RCTs). Forest therapy has been studied in earnest over the
past decade, and quantitative forest descriptions have only recently begun to be included
in intervention information in clinical trials. Most RCTs were excluded from the review
process as the information on the forest environment was insufficient. For this reason, we
included not only RCTs but also randomized cross-over studies and NRCTs as the scope of
this study. Secondly, we extracted effect size using pre-and post- measurements of each
forest site rather than differences in forest sites and controls. The studies used in the meta-
analysis did not contain the control group examining pre-and post-outcomes outside the
forest environment, rather, they assigned the forest site with different condition as controls
or did not assign controls among forest settings. Most of the included studies adopted

Healthcare 2021, 9, 1427
24 of 28
cross-over designs to investigate the difference in the therapeutic effects in different forest
settings. Only Bach et al. [85] and Elsadek et al. [86] assigned controls to urban sites, but
their results were excluded with some reasons. Bach et al. [85] investigated blood levels
of natural volatile organic compounds that have not been investigated in other studies.
Elsadek et al. [86] conducted studies under high temperature conditions (28.1–31.8 ◦C)
that are difficult to synthesize with other studies conducted under temperature conditions
around 20 ◦C. We may regard one of the forest setting as a control, however, it will not be
meaningful to combine urban settings and the forest settings as equivalent control groups.
Thus, we estimated effect size by calculating a standardized mean difference of single
groups. Accordingly, there would be a risk of resulting false positives and limitations
in precision in deriving the effect size of forest therapy in this way. Future RCTs with
control sites such as indoor or urban environments are required to derive more precise
and reliable effect estimates. Nevertheless, the value of this study is verifying whether the
therapeutic effect of the forest differs by structural characteristics of the forest environment.
Thirdly, as we subgrouped the cases from included studies, sufficient sample size was
required. However, the pooled populations were smaller than the appropriate sample
sizes to examine the moderating effect on the alleviation of anxiety, depression, anger, and
reinforcement of positive affect. With respect to canopy density, the collected samples were
too small to confirm the moderating effects. Therefore, further studies on the therapeutic
effects of forests in various canopy conditions are required.
The key challenge of this study was to investigate moderating role of stand density
and canopy density. Through this study, we found that stand density modifies the level
of therapeutic effects in the forest. Our findings had a great significance in suggesting
the differences in therapeutic effects according to the environmental characteristics of
nature. However, within the scope of this study, we cannot elucidate the underlying mech-
anisms. Several previous studies exploring differences in preference or beauty according
to the characteristics of forest settings explained the differences using semantic difference
measures [21,45,50,57,70] or physical-psychological predictors [74–77]. Especially, psycho-
logical mediators such as a sense of safety, visual access, and ease of movement were used
to explain the difference in preference among forest settings with respect to structural
variables [74–76]. The actual reason or psychological mechanisms are still under discus-
sion [101]. Thus, there is abundant space for further progress in analyzing underlying
mechanism that explains why forest sites with less stand density has more positive effects.
In addition, we found an intriguing trend as a result of additional analysis. There was
a difference in the distribution of the therapeutic effect by region and forest management.
The therapeutic effect of the forest reserve was the highest in all regions, and the order of
the therapeutic effect of an urban forest and commercial forest differed by region. Future
investigation on the impact of management type, landscape characteristics by country, and
public use pattern are required.
5. Conclusions
In this study, a systematic literature review and meta-analysis were conducted to
evaluate the relationship between the structural characteristics of forests and the therapeutic
effect. We systematically searched, selected, and statistically synthesized the literature
examining the therapeutic effects of forests with different stand density and canopy density.
Subgroup analysis showed that stand density modifies the therapeutic effects. Emotional
and cognitive restoration showed the largest effect size in low-density forests with a stand
density of less than 500/ha and the therapeutic effects diminished as the stand density
increases. The impact of canopy density has not been identified due to a lack of studies
reporting canopy density. In addition, there would be a risk of false positives as we did not
control the experimental design and control group. Although some limitations, we expect
that our findings that highlight the impact of forest structure on the therapeutic effects of
forests will contribute to advances in the therapeutic use of forests. We also expect that our
findings may be used as a basis for creating adequate forest sites for future forest therapy.

Healthcare 2021, 9, 1427
25 of 28
Supplementary Materials: The following are available online at https://www.mdpi.com/article/10
.3390/healthcare9111427/s1, Table S1: PRISMA 2020 checklist; Figure S1: result of sensitivity analysis.
Author Contributions: Conceptualization, E.K., G.K. and S.P.; methodology, E.K. and G.K.; software,
E.K., Y.C. and H.-r.C.; formal analysis, E.K., J.C. and Y.C.; investigation, E.K., Y.C. and G.K.; resources,
E.K., G.K. and S.P.; data curation, E.K. and G.K.; writing—original draft preparation, E.K., S.K. and
Y.C.; writing—review and editing, G.K., S.P. and S.-i.C.; visualization, E.K. and H.-r.C.; supervision,
G.K.; project administration, S.P. and S.-i.C. All authors have read and agreed to the published version
of the manuscript.
Funding: This research received no external funding.
Institutional Review Board Statement: Not applicable.
Informed Consent Statement: Not applicable.
Acknowledgments: We thank the anonymous reviewers for their constructive comments on the
manuscript.
Conflicts of Interest: The authors declare no conflict of interest.
References
1. Kaplan, R.; Kaplan, S. The Experience of Nature: A Psychological Perspective; Cambridge University Press: Cambridge, UK, 1989.
2. Kaplan, S. The restorative benefits of nature: Toward an integrative framework. J. Environ. Psychol. 1995, 15, 169–182. [CrossRef]
3. Hartig, T.; Mang, M.; Evans, G.W. Restorative effects of natural environment experiences. Environ. Behav. 1991, 23, 3–26.
[CrossRef]
4. Berman, M.G.; Jonides, J.; Kaplan, S. The cognitive benefits of interacting with nature. Psychol. Sci. 2008, 19, 1207–1212. [CrossRef]
5. Ulrich, R.S. Natural versus urban scenes: Some psychophysiological effects. Environ. Behav. 1981, 13, 523–556. [CrossRef]
6. Ulrich, R.S. Aesthetic and affective response to natural environment. In Behavior and the Natural Environment; Springer: Boston,
MA, USA, 1983; pp. 85–125.
7. Bratman, G.N.; Daily, G.C.; Levy, B.J.; Gross, J.J. The benefits of nature experience: Improved affect and cognition. Landsc. Urban.
Plan. 2015, 138, 41–50. [CrossRef]
8. Ulrich, R.S.; Simons, R.F.; Losito, B.D.; Fiorito, E.; Miles, M.A.; Zelson, M. Stress recovery during exposure to natural and urban
environments. J. Environ. Psychol. 1991, 11, 201–230. [CrossRef]
9. James, P.; Banay, R.F.; Hart, J.E.; Laden, F. A review of the health benefits of greenness. Curr. Epidemiol. Rep. 2015, 2, 131–142.
[CrossRef]
10. Hartig, T.; Mitchell, R.; De Vries, S.; Frumkin, H. Nature and health. Annu. Rev. Public Health 2014, 35, 207–228. [CrossRef]
11. Meyer, K.; Bürger-Arndt, R. How forests foster human health–Present state of research-based knowledge (in the field of Forests
and Human Health). Int. For. Rev. 2014, 16, 421–446. [CrossRef]
12. Miyazaki, Y.; Ikei, H.; Song, C. Forest medicine research in Japan. Nihon Eiseigaku Zasshi. Jpn. J. Hyg. 2014, 69, 122–135. [CrossRef]
13. Van Herzele, A.; Bell, S.; Hartig, T.; Podesta, M.T.C.; van Zon, R. Health benefits of nature experience: The challenge of linking
practice and research. In Forests, Trees and Human Health; Springer: Dordrecht, The Netherlands, 2011; pp. 169–182.
14. Morris, J.; O’Brien, E. Encouraging healthy outdoor activity amongst under-represented groups: An evaluation of the Active
England woodland projects. Urban. For. Urban. Green. 2011, 10, 323–333. [CrossRef]
15. Tsunetsugu, Y.; Park, B.-J.; Miyazaki, Y. Trends in research related to “Shinrin-yoku” (taking in the forest atmosphere or forest
bathing) in Japan. Environ. Health Prev. Med. 2010, 15, 27–37. [CrossRef]
16. Shin, W.S.; Yeoun, P.S.; Yoo, R.W.; Shin, C.S. Forest experience and psychological health benefits: The state of the art and future
prospect in Korea. Environ. Health Prev. Med. 2010, 15, 38. [CrossRef]
17. Jung, W.H.; Woo, J.-M.; Ryu, J.S. Effect of a forest therapy program and the forest environment on female workers’ stress. Urban.
For. Urban. Green. 2015, 14, 274–281. [CrossRef]
18. Chun, M.H.; Chang, M.C.; Lee, S.-J. The effects of forest therapy on depression and anxiety in patients with chronic stroke. Int. J.
Neurosci. 2017, 127, 199–203. [CrossRef]
19. Song, C.; Ikei, H.; Kagawa, T.; Miyazaki, Y. Effects of Walking in a Forest on Young Women. Int. J. Environ. Res. Public Health 2019,
16, 229. [CrossRef]
20. Song, C.; Ikei, H.; Park, B.J.; Lee, J.; Kagawa, T.; Miyazaki, Y. Psychological benefits of walking through forest areas. Int. J. Environ.
Res. Public Health 2018, 15, 2804. [CrossRef]
21. Hassan, A.; Tao, J.; Li, G.; Jiang, M.; Aii, L.; Zhihui, J.; Zongfang, L.; Qibing, C. Effects of walking in bamboo forest and city
environments on brainwave activity in young adults. Evid.-Based Complement. Altern. Med. 2018, 2018, 1–9. [CrossRef]
22. Im, S.G.; Choi, H.; Jeon, Y.-H.; Song, M.-K.; Kim, W.; Woo, J.-M. Comparison of effect of two-hour exposure to forest and urban
environments on cytokine, anti-oxidant, and stress levels in young adults. Int. J. Environ. Res. Public Health 2016, 13, 625.
[CrossRef]

Healthcare 2021, 9, 1427
26 of 28
23. Olafsdottir, G.; Cloke, P.; Schulz, A.; van Dyck, Z.; Eysteinsson, T.; Thorleifsdottir, B.; Vögele, C. Health Benefits of Walking in
Nature: A Randomized Controlled Study Under Conditions of Real-Life Stress. Environ. Behav. 2020, 52, 248–274. [CrossRef]
24. Rajoo, K.S.; Karam, D.S.; Aziz, N.A.A. Developing an effective forest therapy program to manage academic stress in conservative
societies: A multi-disciplinary approach. Urban. For. Urban. Green. 2019, 43, 126353. [CrossRef]
25. Park, B.J.; Tsunetsugu, Y.; Kasetani, T.; Hirano, H.; Kagawa, T.; Sato, M.; Miyazaki, Y. Physiological effects of Shinrin-yoku (taking
in the atmosphere of the forest) using salivary cortisol and cerebral activity as indicators. J. Physiol Anthr. 2007, 26, 123–128.
[CrossRef] [PubMed]
26. Tsunetsugu, Y.; Park, B.J.; Ishii, H.; Hirano, H.; Kagawa, T.; Miyazaki, Y. Physiological effects of Shinrin-yoku (taking in the
atmosphere of the forest) in an old-growth broadleaf forest in Yamagata Prefecture, Japan. J. Physiol. Anthropol. 2007, 26, 135–142.
[CrossRef] [PubMed]
27. Bielinis, E.; Bielinis, L.; Krupin´ ska-Szeluga, S.; Łukowski, A.; Takayama, N. The effects of a short forest recreation program on
physiological and psychological relaxation in young Polish adults. Forests 2019, 10, 34. [CrossRef]
28. Song, C.; Ikei, H.; Miyazaki, Y. Physiological effects of forest-related visual, olfactory, and combined stimuli on humans: An
additive combined effect. Urban. For. Urban. Green. 2019, 44, 126437. [CrossRef]
29. Song, C.; Ikei, H.; Miyazaki, Y. Sustained effects of a forest therapy program on the blood pressure of office workers. Urban. For.
Urban. Green. 2017, 27, 246–252. [CrossRef]
30. Song, C.R.; Ikei, H.; Kagawa, T.; Miyazaki, Y. Effect of Viewing Real Forest Landscapes on Brain Activity. Sustainability 2020,
12, 6601. [CrossRef]
31. Koselka, E.P.D.; Weidner, L.C.; Minasov, A.; Berman, M.G.; Leonard, W.R.; Santoso, M.V.; de Brito, J.N.; Pope, Z.C.; Pereira, M.A.;
Horton, T.H. Walking Green: Developing an Evidence Base for Nature Prescriptions. Int. J. Environ. Res. Public Health 2019,
16, 4338. [CrossRef] [PubMed]
32. Sung, J.; Woo, J.-M.; Kim, W.; Lim, S.-K.; Chung, E.-J. The effect of cognitive behavior therapy-based “forest therapy” program on
blood pressure, salivary cortisol level, and quality of life in elderly hypertensive patients. Clin. Exp. Hypertens. 2012, 34, 1–7.
[CrossRef] [PubMed]
33. Yu, C.-P.S.; Hsieh, H. Beyond restorative benefits: Evaluating the effect of forest therapy on creativity. Urban. For. Urban. Green.
2020, 51, 126670. [CrossRef]
34. Jia, B.B.; Yang, Z.X.; Mao, G.X.; Lyu, Y.D.; Wen, X.L.; Xu, W.H.; Lyu, X.L.; Cao, Y.B.; Wang, G.F. Health effect of forest bathing trip
on elderly patients with chronic obstructive pulmonary disease. Biomed. Environ. Sci. 2016, 29, 212–218. [PubMed]
35. Mao, G.; Cao, Y.; Wang, B.; Wang, S.; Chen, Z.; Wang, J.; Xing, W.; Ren, X.; Lv, X.; Dong, J.; et al. The salutary influence of forest
bathing on elderly patients with chronic heart failure. Int. J. Environ. Res. Public Health 2017, 14, 368. [CrossRef] [PubMed]
36. Mao, G.X.; Cao, Y.B.; Yang, Y.; Chen, Z.M.; Dong, J.H.; Chen, S.S.; Wu, Q.; Lyu, X.L.; Jia, B.B.; Yan, J.; et al. Additive Benefits of
Twice Forest Bathing Trips in Elderly Patients with Chronic Heart Failure. Biomed. Environ. Sci. 2018, 31, 159–162.
37. Peterfalvi, A.; Meggyes, M.; Makszin, L.; Farkas, N.; Miko, E.; Miseta, A.; Szereday, L. Forest bathing always makes sense: Blood
pressure-lowering and immune system-balancing effects in late spring and winter in central europe. Int. J. Environ. Res. Public
Health 2021, 18, 2067. [CrossRef] [PubMed]
38. Mukaida, N.; Harada, A.; Matsushima, K. Interleukin-8 (IL-8) and monocyte chemotactic and activating factor (MCAF/MCP-1),
chemokines essentially involved in inflammatory and immune reactions. Cytokine Growth Factor Rev. 1998, 9, 9–23. [CrossRef]
39. Lyu, B.; Zeng, C.; Xie, S.; Li, D.; Lin, W.; Li, N.; Jiang, M.; Liu, S.; Chen, Q. Benefits of a three-day bamboo forest therapy session
on the psychophysiology and immune system responses of male college students. Int. J. Environ. Res. Public Health 2019, 16, 4991.
[CrossRef]
40. Li, Q.; Kawada, T. Effect of forest therapy on the human psycho-neuro-endocrino-immune network. Nihon Eiseigaku Zasshi. Jpn. J.
Hyg. 2011, 66, 645–650. [CrossRef]
41. Li, Q. Effect of forest bathing trips on human immune function. Environ. Health Prev. Med. 2010, 15, 9–17. [CrossRef]
42. Lee, J.Y.; Lee, D.C. Cardiac and pulmonary benefits of forest walking versus city walking in elderly women: A randomised,
controlled, open-label trial. Eur. J. Integr. Med. 2014, 6, 5–11. [CrossRef]
43. Mao, G.X.; Cao, Y.B.; Lan, X.G.; He, Z.H.; Chen, Z.M.; Wang, Y.Z.; Hu, X.L.; Lv, Y.D.; Wang, G.F.; Yan, J. Therapeutic effect of
forest bathing on human hypertension in the elderly. J. Cardiol. 2012, 60, 495–502. [CrossRef]
44. Guan, H.; Wei, H.; He, X.; Ren, Z.; An, B. The tree-species-specific effect of forest bathing on perceived anxiety alleviation of
young-adults in urban forests. Ann. For. Res. 2017, 60, 327–341. [CrossRef]
45. Fujisawa, M.; Takayama, N.; Morikawa, T. Study on physiological response and subjective appraisal brought visually by a light
environment of a forest. Pap. Environ. Inf. Sci. 2012, 26, 103–106.
46. Joung, D.; Song, C.; Ikei, H.; Okuda, T.; Igarashi, M.; Koizumi, H.; Park, B.J.; Yamaguchi, T.; Takagaki, M.; Miyazaki, Y.
Physiological and psychological effects of olfactory stimulation with D-Limonene. Adv. Hortic. Sci. 2014, 28, 90–94.
47. Ikei, H.; Song, C.R.; Miyazaki, Y. Physiological effect of olfactory stimulation by Hinoki cypress (Chamaecyparis obtusa) leaf oil.
J. Physiol. Anthropol. 2015, 34, 1–7. [CrossRef]
48. Hansen, M.M.; Jones, R.; Tocchini, K. Shinrin-yoku (forest bathing) and nature therapy: A state-of-the-art review. Int. J. Environ.
Res. Public Health 2017, 14, 851. [CrossRef]
49. Tyrväinen, L.; Ojala, A.; Korpela, K.; Lanki, T.; Tsunetsugu, Y.; Kagawa, T. The influence of urban green environments on stress
relief measures: A field experiment. J. Environ. Psychol. 2014, 38, 1–9. [CrossRef]

Healthcare 2021, 9, 1427
27 of 28
50. Zeng, C.; Lyu, B.; Deng, S.; Yu, Y.; Li, N.; Lin, W.; Li, D.; Chen, Q. Benefits of a Three-Day Bamboo Forest Therapy Session on the
Physiological Responses of University Students. Int. J. Environ. Res. Public Health 2020, 17, 3238. [CrossRef] [PubMed]
51. Zhu, S.X.; Hu, F.F.; He, S.Y.; Qiu, Q.; Su, Y.; He, Q.; Li, J.Y. Comprehensive Evaluation of Healthcare Benefits of Different Forest
Types: A Case Study in Shimen National Forest Park, China. Forests 2021, 12, 207. [CrossRef]
52. Yamada, A.; Sato, Y.; Horike, T.; Miyanaga, M.; Wang, D.-H. Effects of a Forest Walk on Urinary Dityrosine and Hexanoyl-Lysine
in Young People: A Pilot Study. Int. J. Environ. Res. Public Health 2020, 17, 4990. [CrossRef]
53. Li, Q.; Morimoto, K.; Kobayashi, M.; Inagaki, H.; Katsumata, M.; Hirata, Y.; Hirata, K.; Suzuki, H.; Li, Y.J.; Wakayama, Y.; et al.
Visiting a forest, but not a city, increases human natural killer activity and expression of anti-cancer proteins. Int. J. Immunopathol.
Pharmacol. 2008, 21, 117–127. [CrossRef]
54. Li, Q.; Morimoto, K.; Kobayashi, M.; Inagaki, H.; Katsumata, M.; Hirata, Y.; Hirata, K.; Shimizu, T.; Li, Y.J.; Wakayama, Y.; et al. A
forest bathing trip increases human natural killer activity and expression of anti-cancer proteins in female subjects. J. Biol. Regul.
Homeost. Agents 2008, 22, 45–55. [PubMed]
55. Kim, G.; Park, S.; Kwak, D. Is It Possible to Predict the Concentration of Natural Volatile Organic Compounds in Forest
Atmosphere? Int. J. Environ. Res. Public Health 2020, 17, 7875. [CrossRef] [PubMed]
56. Song, C.R.; Ikei, H.; Miyazaki, Y. Physiological Effects of Nature Therapy: A Review of the Research in Japan. Int. J. Environ. Res.
Public Health 2016, 13, 781. [CrossRef] [PubMed]
57. Ochiai, H.; Ikei, H.; Song, C.; Kobayashi, M.; Takamatsu, A.; Miura, T.; Kagawa, T.; Li, Q.; Kumeda, S.; Imai, M.; et al. Physiological
and Psychological Effects of Forest Therapy on Middle-Aged Males with High-Normal Blood Pressure. Int. J. Environ. Res. Public
Health 2015, 12, 2532–2542. [CrossRef] [PubMed]
58. Bedimo-Rung, A.L.; Mowen, A.J.; Cohen, D.A. The significance of parks to physical activity and public health: A conceptual
model. Am. J. Prev. Med. 2005, 28, 159–168. [CrossRef]
59. Chiang, Y.C.; Li, D.; Jane, H.A. Wild or tended nature? The effects of landscape location and vegetation density on physiological
and psychological responses. Landsc. Urban. Plan. 2017, 167, 72–83. [CrossRef]
60. Lin, W.; Chen, Q.; Zhang, X.; Tao, J.; Liu, Z.; Lyu, B.; Li, N.; Li, D.; Zeng, C. Effects of Different Bamboo Forest Spaces on
Psychophysiological Stress and Spatial Scale Evaluation. Forests 2020, 11, 616. [CrossRef]
61. Gao, T.; Zhang, T.; Zhu, L.; Gao, Y.; Qiu, L. Exploring psychophysiological restoration and individual preference in the different
environments based on virtual reality. Int. J. Environ. Res. Public Health 2019, 16, 3102. [CrossRef]
62. Matthew, A.; Birgitta, G. Variations in perceptions of danger, fear and preference in a simulated natural environment. J. Environ.
Psychol. 2010, 30, 473–481.
63. Heyman, E.; Gunnarsson, B.; Stenseke, M.; Henningsson, S.; Tim, G. Openness as a key-variable for analysis of management
trade-offs in urban woodlands. Urban. For. Urban. Green. 2011, 10, 281–293. [CrossRef]
64. Lis, A.; Iwankowski, P. Why is dense vegetation in city parks unpopular? The mediative role of sense of privacy and safety.
Urban. For. Urban. Green. 2021, 59, 126988. [CrossRef]
65. An, K.W.; Kim, E.I.; Joen, K.S.; Setsu, T. Effects of forest stand density on human’s physiopsychological changes. J. Fac. Agric.
Kyushu Univ. 2004, 49, 283–291. [CrossRef]
66. Jiang, B.; Chang, C.-Y.; Sullivan, W.C. A dose of nature: Tree cover, stress reduction, and gender differences. Landsc. Urban. Plan.
2014, 132, 26–36. [CrossRef]
67. Antonio, T.; Luca, S.; Giuseppe, C.; Piermaria, C.; Luigi, P.; Mariagrazia, A. Restorative urban forests: Exploring the relationships
between forest stand structure, perceived restorativeness and benefits gained by visitors to coastal Pinus pinea forests. Ecol. Indic.
2018, 90, 594–605.
68. Hussain, R.I.; Walcher, R.; Eder, R.; Allex, B.; Wallner, P.; Hutter, H.-P.; Bauer, N.; Arnberger, A.; Zaller, J.G.; Frank, T. Management
of mountainous meadows associated with biodiversity attributes, perceived health benefits and cultural ecosystem services. Sci.
Rep. 2019, 9, 1–9. [CrossRef]
69. Arnberger, A.; Eder, R.; Allex, B.; Ebenberger, M.; Hutter, H.P.; Wallner, P.; Bauer, N.; Zaller, J.G.; Frank, T. Health-related effects of
short stays at mountain meadows, a river and an urban site—Results from a field experiment. Int. J. Environ. Res. Public Health
2018, 15, 2647. [CrossRef] [PubMed]
70. Bum-Jin, P.; Katsunori, F.; Tamami, K.; Norimasa, T.; Takahide, K.; Yoshifumi, M. Relationship between psychological responses
and physical environments in forest settings. Landsc. Urban. Plan. 2011, 102, 24–32.
71. Chang, L.; Changan, S.; Minkai, S.; Yu, Y.; Pengcheng, L. Effects of brightness levels on stress recovery when viewing a virtual
reality forest with simulated natural light. Urban. For. Urban. Green. 2020, 56, 126865.
72. Kasetani, T.; Takayama, N.; Park, B.-J.; Furuya, K.; Kagawa, T.; Miyazaki, Y. Relation between light/thermal environment in the
forest walking road and subjective estimations for taking in the atmosphere of the forest. J. Jpn. Inst. Lands Arch. 2008, 71, 713–716.
[CrossRef]
73. Bach Pages, A.; Peñuelas, J.; Clarà, J.; Llusià, J.; Campillo i López, F.; Maneja, R. How should forests be characterized in regard to
human health? Evidence from existing literature. Int. J. Environ. Res. Public Health 2020, 17, 1027. [CrossRef] [PubMed]
74. Herzog, T.R.; Kutzli, G.E. Preference and perceived danger in field/forest settings. Environ. Behav. 2002, 34, 819–835. [CrossRef]
75. Herzog, T.R.; Kropscott, L.S. Legibility, mystery, and visual access as predictors of preference and perceived danger in forest
settings without pathways. Environ. Behav. 2004, 36, 659–677. [CrossRef]
76. Herzog, T.R.; Chernick, K.K. Tranquility and danger in urban and natural settings. J. Environ. Psychol. 2000, 20, 29–39. [CrossRef]

Healthcare 2021, 9, 1427
28 of 28
77. Van der Jagt, A.P.N.; Craig, T.; Anable, J.; Brewer, M.J.; Pearson, D.G. Unearthing the picturesque: The validity of the preference
matrix as a measure of landscape aesthetics. Landsc. Urban. Plan. 2014, 124, 1–13. [CrossRef]
78. Kuper, R. Restorative potential, fascination, and extent for designed digital landscape models. Urban. For. Urban. Green. 2017, 28,
118–130. [CrossRef]
79. Edwards, D.; Jay, M.; Jensen, F.S.; Lucas, B.; Marzano, M.; Montagné, C.; Peace, A.; Weiss, G. Public preferences for structural
attributes of forests: Towards a pan-European perspective. For. Policy Econ. 2012, 19, 12–19. [CrossRef]
80. Higgins, J.P.T.; Thomas, J.; Chandler, J.; Cumpston, M.; Li, T.; Page, M.J.; Welch, V.A. Cochrane Handbook for Systematic Reviews of
Interventions; John Wiley & Sons: Chichester, UK, 2019.
81. Page, M.J.; McKenzie, J.E.; Bossuyt, P.M.; Boutron, I.; Hoffmann, T.C.; Mulrow, C.D.; Shamseer, L.; Tetzlaff, J.M.; Akl, E.A.;
Brennan, S.E. The PRISMA 2020 statement: An updated guideline for reporting systematic reviews. BMJ 2021, 372, 71. [CrossRef]
[PubMed]
82. Sterne, J.A.C.; Hernán, M.A.; Reeves, B.C.; Savovic´, J.; Berkman, N.D.; Viswanathan, M.; Henry, D.; Altman, D.G.; Ansari, M.T.;
Boutron, I.; et al. ROBINS-I: A tool for assessing risk of bias in non-randomised studies of interventions. BMJ 2016, 355, i4919.
[CrossRef]
83. Cohen, J. A power primer. Psychol. Bull. 1992, 112, 155. [CrossRef]
84. An, B.-Y.; Wang, D.; Liu, X.-J.; Guan, H.-M.; Wei, H.-X.; Ren, Z.-B. The effect of environmental factors in urban forests on blood
pressure and heart rate in university students. J. For. Res. 2019, 24, 27–34. [CrossRef]
85. Bach, A.; Maneja, R.; Zaldo-Aubanell, Q.; Romanillos, T.; Llusià, J.; Eustaquio, A.; Palacios, O.; Penuelas, J. Human absorption of
monoterpenes after a 2-h forest exposure: A field experiment in a Mediterranean holm oak forest. J. Pharm. Biomed. Anal. 2021,
200, 114080. [CrossRef] [PubMed]
86. Elsadek, M.; Liu, B.; Lian, Z.; Xie, J. The influence of urban roadside trees and their physical environment on stress relief measures:
A field experiment in Shanghai. Urban. For. Urban. Green. 2019, 42, 51–60. [CrossRef]
87. Lee, J.H.; Park, J.S.; Choi, S. Environmental influence in the forested area toward human health: Incorporating the ecological
environment into art psychotherapy. J. Mt. Sci. 2020, 17, 992–1000. [CrossRef]
88. Oishi, Y.; Kanehama, S.; Hiyane, A.; Taguchi, H. Comparison of Forest Image and Mood Psychological Examination in a Forest
Environment Using Profile of Mood States and Semantic Differential Method. J. Jpn. For. Soc. 2003, 85, 70–77.
89. Saito, H.; Horiuchi, M.; Takayama, N.; Fujiwara, A. Effects of managed forest versus unmanaged forest on physiological
restoration from a stress stimulus, and the relationship with individual traits. J. For. Res. 2019, 24, 77–85. [CrossRef]
90. Simkin, J.; Ojala, A.; Tyrväinen, L. Restorative effects of mature and young commercial forests, pristine old-growth forest and
urban recreation forest—A field experiment. Urban. For. Urban. Green. 2020, 48, 126567. [CrossRef]
91. Takayama, N.; Fujiwara, A.; Saito, H.; Horiuchi, M. Management Effectiveness of a Secondary Coniferous Forest for Landscape
Appreciation and Psychological Restoration. Int. J. Environ. Res. Public Health 2017, 14, 800. [CrossRef]
92. Takayama, N.; Saito, H.; Fujiwara, A.; Horiuchi, M. The effect of slight thinning of managed coniferous forest on landscape
appreciation and psychological restoration. Prog. Earth Planet. Sci. 2017, 4, 17. [CrossRef]
93. Yu, C.-P.; Lin, C.-M.; Tsai, M.-J.; Tsai, Y.-C.; Chen, C.-Y. Effects of short forest bathing program on autonomic nervous system
activity and mood states in middle-aged and elderly individuals. Int. J. Environ. Res. Public Health 2017, 14, 897. [CrossRef]
94. Zhou, C.; Yan, L.; Yu, L.; Wei, H.; Guan, H.; Shang, C.; Chen, F.; Bao, J. Effect of Short-term Forest Bathing in Urban Parks on
Perceived Anxiety of Young-adults: A Pilot Study in Guiyang, Southwest China. Chin. Geogr. Sci. 2019, 29, 139–150. [CrossRef]
95. FAO. Forests for Human Health and Well-Being—Strengthening the Forest–Health–Nutrition Nexus; Forestry Working Paper No. 18;
FAO: Rome, Italy, 2020; pp. 23–39.
96. Jäppinen, J.; Tyrväinen, L.; Reinikainen, M.; Ojala, A. Nature for Health and Well-Being in Finland–results and recommendations
from the Argumenta project Ecosystem Services and Human Health (2013–2014). Rep. Finn. Environ. Inst. 2014, 35, 104.
97. Maller, C.; Townsend, M.; St Leger, L.; Henderson-Wilson, C.; Pryor, A.; Prosser, L.; Moore, M. The Health Benefits of Contact with
Nature in a Park Context: A Review of Relevant Literature; Deakin University and Parks Victoria: Melbourne, Australia, 2008.
98. Li, Q. Forest Bathing: How Trees Can. Help You Find Health and Happiness; Penguin: London, UK, 2018.
99. Kotte, D.; Li, Q.; Shin, W.S.; Michalsen, A. International Handbook of Forest Therapy; Cambridge Scholars Publishing: Cambridge,
UK, 2019.
100. Corazon, S.; Stigsdotter, U.; Claudi Jensen, A.G.; Nilsson, K. Development of the nature-based therapy concept for patients with
stress-related illness at the Danish Healing Forest Garden Nacadia. J. Ther. Hortic. 2010, 20, 33–51.
101. Stamps, A.E. Mystery, complexity, legibility and coheren.n.nce: A meta-analysis. J. Environ. Psychol. 2004, 24, 1–16. [CrossRef]