

ORIGINAL RESEARCH
published: 01 October 2018
doi: 10.3389/fpubh.2018.00278
Forest Walking Affects Autonomic
Nervous Activity: A Population-Based
Study
Hiromitsu Kobayashi 1, Chorong Song 2, Harumi Ikei 2,3, Bum-Jin Park 4, Juyoung Lee 5,
Takahide Kagawa 3 and Yoshifumi Miyazaki 2*
1 Department of Nursing, Ishikawa Prefectural Nursing University, Ishikawa, Japan, 2 Center for Environment, Health and Field
Sciences, Chiba University, Kashiwa, Japan, 3 Forestry and Forest Products Research Institute, Tsukuba, Japan,
4 Department of Environment and Forest Resources, Chungnam National University, Daejeon, South Korea, 5 Department of
Landscape Architecture, Hankyong National University, Anseong-si, South Korea
Edited by:
Mohiuddin Md. Taimur Khan,
Washington State University,
United States
Reviewed by:
Jean Challacombe,
Colorado State University,
United States
Ellie Abdi,
Montclair State University,
United States
*Correspondence:
Yoshifumi Miyazaki
ymiyazaki@faculty.chiba-u.jp
Specialty section:
This article was submitted to
Environmental Health,
a section of the journal
Frontiers in Public Health
Received: 17 April 2018
Accepted: 10 September 2018
Published: 01 October 2018
Citation:
Kobayashi H, Song C, Ikei H,
Park B-J, Lee J, Kagawa T and
Miyazaki Y (2018) Forest Walking
Affects Autonomic Nervous Activity:
A Population-Based Study.
Front. Public Health 6:278.
doi: 10.3389/fpubh.2018.00278
The present study aimed to evaluate the effect of walking in forest environments on
autonomic nervous activity with special reference to its distribution characteristics. Heart
rate variability (HRV) of 485 male participants while walking for ∼15 min in a forest and
an urban area was analyzed. The experimental sites were 57 forests and 57 urban
areas across Japan. Parasympathetic and sympathetic indicators [lnHF and ln(LF/HF),
respectively] of HRV were calculated based on ∼15-min heart rate recordings. Skewness
and kurtosis of the distributions of lnHF and ln(LF/HF) were almost the same between
the two environments, although the means and medians of the indicators differed
significantly. Percentages of positive responders [presenting an increase in lnHF or a
decrease in ln(LF/HF) in forest environments] were 65.2 and 67.0%, respectively. The
percentage of lnHF was significantly smaller than our previous results on HRV during
the viewing of urban or forest landscapes, whereas the percentage of ln(LF/HF) was
not significantly different. The results suggest that walking in a forest environment has a
different effect on autonomic nervous activity than viewing a forest landscape.
Keywords: forest therapy, walking, heart rate variability (HRV), skewness, kurtosis, population approach
INTRODUCTION
“Shinrin-yoku” is a Japanese term for “forest bathing,” which was coined by the Director of the
Japanese Forestry Agency, Tomohide Akiyama, in 1982 (1). This term is now increasingly being
used internationally (1–3). Various studies on the psychological effects of natural environments
have been conducted, with consistent effects of reducing negative emotions, such as anger, fatigue,
or sadness, being demonstrated in previous studies (4). In addition to psychological effects,
beneficial effects of a forest environment in terms of physiological responses have also been
investigated (5). Decreases in blood pressure (6–8), in serum or salivary cortisol concentration
(6, 9, 10), and enhancements in immune system functioning (11–13) have been reported.
Heart rate variability (HRV) measurement is a method for evaluating autonomic nervous
functions. HRV measurement is the most frequently used physiological indicator in studies
on the effect of forest environments and demonstrates better results than other physiological
measurements, such as salivary cortisol concentration (10). The power spectrum of the heartbeat
interval sequence generally exhibits two spectral components: a high-frequency (HF; 0.15–0.40 Hz)
component and a low-frequency (LF; 0.04–0.15 Hz) component. The HF component of HRV is
Frontiers in Public Health | www.frontiersin.org
1
October 2018 | Volume 6 | Article 278

Kobayashi et al.
Forest Walking Affects Autonomic Functions
considered to be a marker of parasympathetic activity, whereas
the LF component or LF/HF ratio is considered to be a marker
of sympathetic activity (14, 15). Several studies have consistently
demonstrated increases in HF and/or decreases in LF/HF in
forest environments compared with the corresponding levels in
urban environments (16–18). These results suggest that being
present in a forest environment relaxes the autonomic nervous
system.
HRV measurements have the advantages of enabling
continuous ambulatory monitoring and robustness against
artifacts, such as body movement. These advantages might
be maximized in measurement performed during walking in
a field environment rather than during resting in laboratory
condition. HRV measurements have also been applied in studies
on the effects of walking in natural environments (19–21),
which also reported relaxation of autonomic nervous system in
forest environments similar to that in studies conducted on a
resting condition. The present study investigated the HRV of
485 young male participants during walking in forest and urban
environments.
In efforts to promote human health, there are two types
of strategy: a high-risk (individual) approach and a population
approach. The high-risk approach targets individuals with a
certain disease or impairment, whereas the population approach
targets an entire population. Nature therapy, including “shinrin-
yoku,” is one of the population approaches to promote health.
Although its effects on each individual are relatively small, at the
population level, it can achieve greater health improvement by
shifting the risk distribution curve of the entire population (22).
Thus, the beneficial effect of exposure to the natural environment
should be evaluated using a population-based analysis with
special reference to its distribution characteristics. However, most
previous studies on nature therapy have merely focused on the
change in the mean values of health-related variables [e.g., (6–
13)]. To adopt a population-level perspective, in this study, we
analyzed HRV indicators of 485 male participants with special
reference to their distribution characteristics. In addition, we
compared our results obtained during walking with those during
the viewing landscapes reported in a previous study (17).
MATERIALS AND METHODS
Study Sites and Participants
The study areas were 57 forests and 57 urban sites across Japan.
Urban areas were downtown or near a Japan railway station.
Although 684 young (aged 19–29 years) Japanese male university
students participated in the experiments, only 520 participants
whose complete data could be obtained at both forests and urban
sites were analyzed. Demographic parameters of the participants
are shown in Table 1. None of the participants reported a history
of physical or psychiatric disorders. During the study period,
alcohol and tobacco consumption was prohibited and caffeine
consumption was controlled.
Experimental Design
The experiment was performed at each experimental area over
2 consecutive days. Prior to the experiment, the aim of this
TABLE 1 | Demographics of the participants (n = 520).
Age (year)
Height (m)
Max
29
1.88
Min
19
1.55
Mean
21.7
1.72
SD
1.6
0.06
SD, standard deviation.
Body mass (kg)
110
42
64.6
9.5
study and the experimental protocol was explained and general
instructions were provided to the participants. The participants
participating in an experiment at each site were randomly divided
into two groups, and the order of the experimental conditions
(urban or forest) was counterbalanced among them. One group
performed the experiment in the forest area prior to the urban
area, and the other group performed the same experiment
in the urban area prior to the forest area. All participants
stayed in a waiting room before moving to the field site. All
participants were instructed to rest in a chair for ∼5 min, which
mitigated the physiological effects of physical activity before
the measurement period. The HRV data were obtained during
walking in a forest or an urban environment for ∼15 min.
On the second day, the participants switched field sites. The
experimental protocol for the second day was the same as the
first day.
Among the experiments at 57 locations, those at 44 locations
were performed with the experimental design of “Stay-in
Forest Therapy,” in which all participants were instructed to
reside in a hotel with identical single rooms. Meanwhile,
the experiments at 13 locations were performed with the
experimental design of “One-Day Forest Therapy,” in which
the participants returned home after the first day of the
experiment. To reduce the burden on participants and the
research expenses, eventually all experiments were switched
to the simplified experimental design of One-Day Forest
Therapy.
HRV Measurements
HRV was measured using a portable electrocardiograph
(Activtracer AC-301A; GMS, Japan). Spectral analyses of HRV
in 15-min recordings were conducted using HRV software
(MemCalc/Win; GMS, Tokyo, Japan) based on the maximum
entropy method. HF and LF components were obtained by
integrating the power spectra at their respective ranges of
0.15–0.40 and 0.04–0.15 Hz. The natural logarithms of the HRV
indices [lnHF, ln(LF/HF)] were then calculated because it has
been reported that the raw HRV components exhibit skewed
distributions (23).
In this study, HRV was measured during spontaneous
breathing, and paced breathing was not applied. The
participants were instructed to avoid irregular breathing
during the measurements. A previous study reported
that the effect of paced breathing on inter-individual
variations in the spectral components of HRV was
negligible (24).
Frontiers in Public Health | www.frontiersin.org
2
October 2018 | Volume 6 | Article 278

Kobayashi et al.
Forest Walking Affects Autonomic Functions
Outlier Processing
Outlier processing was performed on the results because
higher-moment statistics (skewness and kurtosis) are particularly
sensitive to outliers (25). The outlier processing was based on a
box-whisker plot (26). Upper and lower cut-offs (upperCO and
lowerCO, respectively) were defined as follows:
UpperCO = Q3 + 1.5 (IQR), (1)
LowerCO = Q1 – 1.5 (IQR), (2)
where
Q1: quartile 1 (25th percentile)
Q3: quartile 3 (75th percentile)
IQR: interquartile range (Q3–Q1)
The outlier processing was performed on the HRV indices
[lnHF and ln(LF/HF)] obtained in each environment (urban and
forest). The lowerCOs and upperCOs are summarized in Table 2.
The participants associated with outliers in either
environment were eliminated. As a result, 35 participants
were eliminated, and the data of the remaining 485 participants
were used for further analysis.
Statistical Analysis
HRV indicators of the 485 participants were plotted as
histograms by dividing the range [from 1.0 to 7.5 for lnHF, from
0.0 to 4.0 for ln(LF/HF)] into 40 segments. Changes in HRV
indices between urban and forest environments (forest–urban)
were also plotted as a histogram by dividing the range [from
−4.5 to +5.5 for lnHF, from −3.0 to +2.0 for ln(LF/HF)] into
40 segments.
The mean, median, standard deviation (SD), coefficient of
variation (CV), IQR, skewness, and kurtosis of the distribution
were calculated. Skewness is a measure of the symmetry of
distribution. Negative or positive skewness is indicated when
the left or right tail, respectively, of the research data in a
histogram is longer than the other tail. The skewness of a normal
distribution is zero. Meanwhile, kurtosis is a measure of whether
the distribution curve is peaked (positive) or flat (negative)
relative to the normal distribution. The kurtosis of normally
distributed data is defined as zero.
Differences in these statistics between urban and forest
environments were tested by performing a permutation test,
which is a statistical test with a non-parametric basis. Resampling
was performed 5,000 times. The p-value was calculated according
to the suggestion by Phipson and Smyth (27). The uncertainty of
a p-value near 0.05 was estimated to be 0.3%.
TABLE 2 | Cut-off values of heart rate variability for the outlier processing.
lnHF
Urban
Forest
ln(LF/HF)
Urban
Forest
LowerCO
0.85
1.09
0.49
0.22
UpperCO
6.95
7.54
3.83
3.76
CO, Cut-off value for the outlier processing.
For further analysis, results of this study were compared
with those of our previous study (17). In the previous study,
autonomic responses to urban and forest environments were
studied in 625 young male participants. The participants viewed
the landscape (forest or urban environment) for 15 min while
sitting on a chair. When viewing the landscapes, HRV was
monitored continuously.
Number of participants who indicated positive or negative
responses were calculated for present (walking) and the
previous (viewing) results. Positive and negative responses
to forest environments were defined as a decrease in lnHF
and an increase in ln(LF/HF), respectively. The difference
between the present and previous studies with respect to
the ratio of negative/positive responders was compared using
Chi-squared test. p-values < 0.05 were considered indicative
of statistical significance for permutation and Chi-squared
tests.
ETHICAL CONSIDERATIONS
The study was conducted in accordance with the Declaration
of Helsinki, and the protocol was approved by the Ethics
Committee of the Forestry and Forest Products Research
Institute, Japan (project identification code number: 16-
558), or the Center for Environment, Health and Field
Sciences, Chiba University, Japan (project identification
code number: 5). Participants were informed about the
purposes and procedures of the study and provided written
informed consent prior to enrollment. They were free to
not attend or cease participation in the program at any
time.
RESULTS
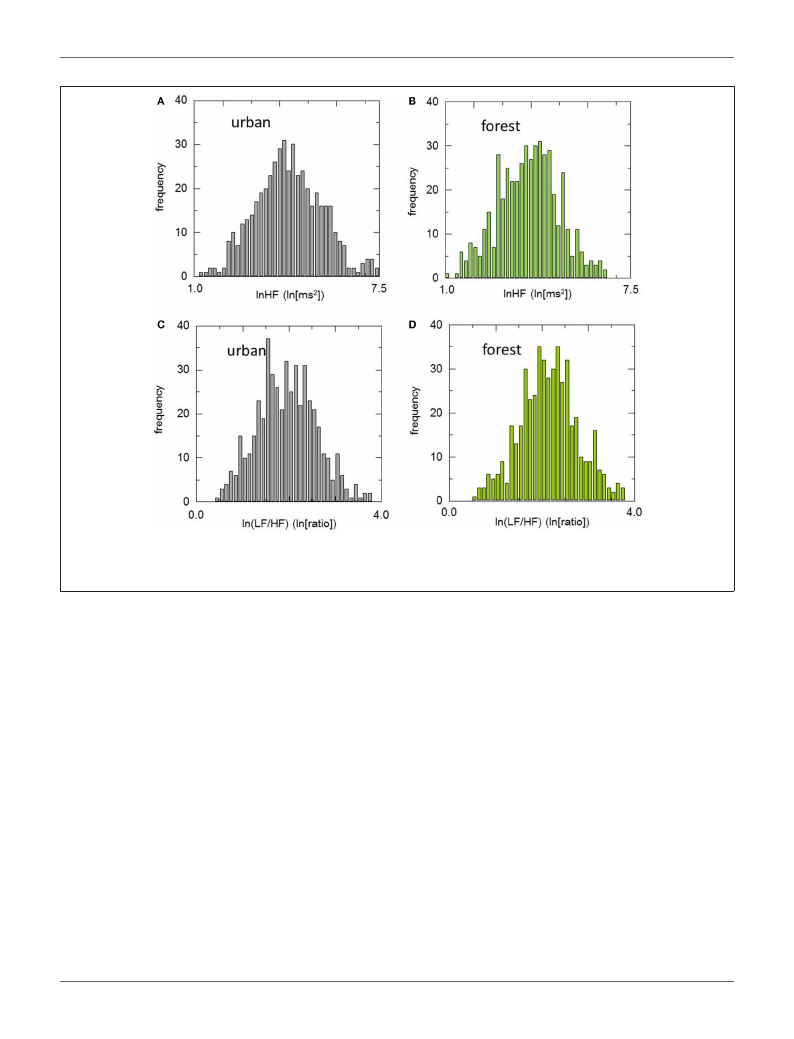
Histograms of HRV indicators during walking in urban and
forest environments are shown in Figure 1, and statistics of
these indicators are summarized in Table 3. The means of lnHF
were 3.93 and 4.33 for the urban and forest environments,
respectively. The permutation test revealed that mean lnHF
during walking in a forest was significantly larger than during
walking in an urban area (p < 0.01). The medians of lnHF
were 3.96 and 4.27 for the urban and forest environments,
respectively, which were also significantly different (p < 0.01).
Although the difference was not significant (p = 0.06), SD
was slightly greater in the forest environment than in the
urban environment, resulting in CV being almost unchanged
(p = 0.83). Both Q1 and Q3 were larger in forest walking
(p < 0.01), and as a result, there was no difference in IQR
(p = 0.62).
In regards to In(LF/HF) the means were 2.16 in the
urban environment and 1.96 in the forest environment, and
significantly larger ln(LF/HF) was observed in the urban
environment than in the forest environment (p < 0.01). As for the
median of Q1 and Q3, the differences between urban and forest
areas were statistically significant, but the differences in SD and
IQR were not as significant. These results were similar to those
Frontiers in Public Health | www.frontiersin.org
3
October 2018 | Volume 6 | Article 278
Kobayashi et al.
Forest Walking Affects Autonomic Functions
FIGURE 1 | Histograms of heart rate variability during walking in urban and forest environments. Upper panels show the distribution of lnHF in urban (A) and forest
(B) environments, and lower panels show the distribution of ln(LF/HF) in urban (C) and forest (D) environments. For both lnHF and ln(LF/HF), no significant differences
in the shape of the distribution curve were observed between urban and forest environments.
of lnHF, although the direction of the change was the opposite.
Unlike the results of lnHF, nevertheless, CV of ln(LF/HF) was
significantly larger in the forest environment (32.1) than in the
urban environment (28.5) (p < 0.01).
The mean and median values were very close in both
HRV indicators and in both environments. For example, the
values were 3.93 (mean) and 3.96 (median) for lnHF in
an urban area. This suggested that the distribution curves
of this variable were almost symmetric. This symmetrical
distribution was also confirmed by higher moment statistics.
Skewness and kurtosis were close to zero for both HRV
indicators and both environments, suggesting nearly normal
distributions.
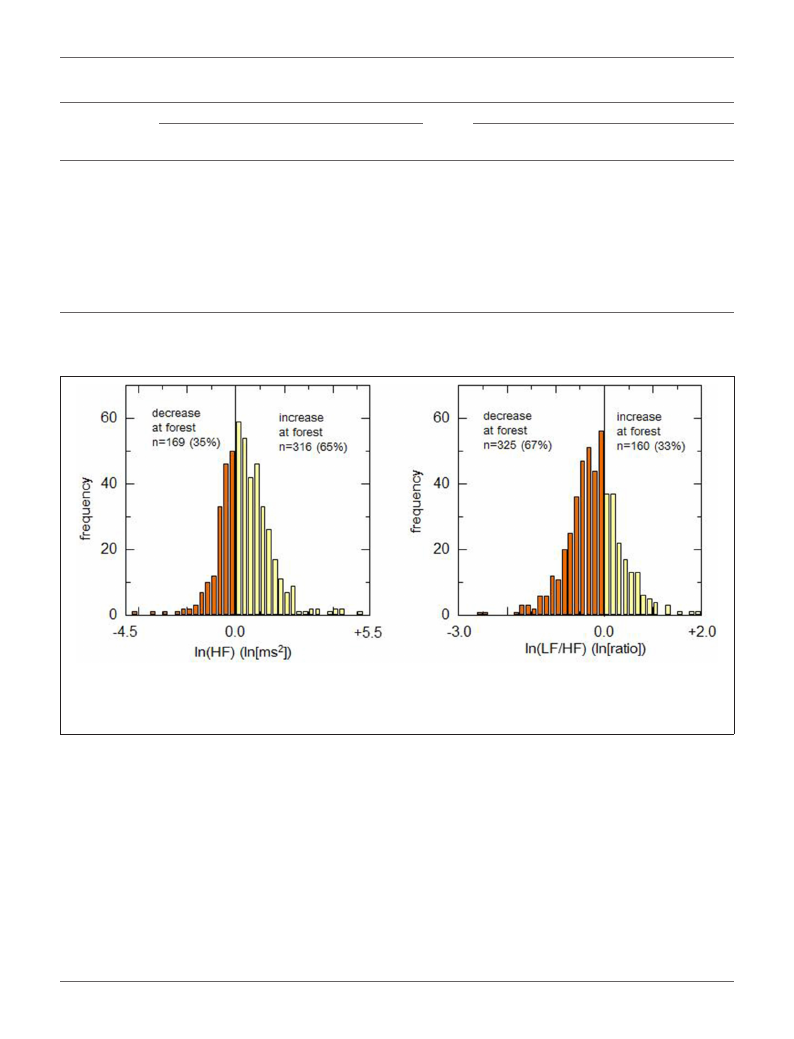
The differences between urban and forest environments for
lnHF and ln(LF/HF) were plotted in a histogram (Figure 2).
Positive and negative values in the abscissa represent increases
and decreases in the HRV indicator in a forest environment,
respectively. Due to an increase in lnHF or a decrease
in ln(LF/HF) is considered to represent relaxation, it was
defined that these changes are positive responses. Conversely,
a decrease in lnHF and an increase in ln(LF/HF) were defined
as negative responses. As for lnHF, 316 (65.2%) participants
showed positive responses in the forest environment rather
than in the urban environment, and the remaining 169 (34.8%)
participants exhibited negative responses. The ln(LF/HF), 325
(67.0%) showed decreases in the forest environment and the
remaining 160 (33.0%) exhibited negative responses.
The present results of HRV during walking were compared
with the previously reported results on HRV during the
viewing of landscapes (17). The numbers of participants who
indicated positive/negative responses in HRV indicators in a
forest are summarized in Table 4. In our previous results (17),
79.2% participants exhibited positive responses (increases in the
forest environment) in lnHF during the viewing of landscapes.
The proportion of positive responders during viewing was
considerably larger than the proportion during walking. A chi-
square test revealed significant difference in the proportion
of positive responders in lnHF between walking and viewing
(p < 0.01).
On the other hand, the proportion of positive responders in
ln(LF/HF) during viewing was 64.0%, which was close to the
proportion during walking (67.0%) demonstrated in this study.
Frontiers in Public Health | www.frontiersin.org
4
October 2018 | Volume 6 | Article 278
Kobayashi et al.
Forest Walking Affects Autonomic Functions
TABLE 3 | Distribution characteristics of heart rate variability indices urban and forest environments.
Urban
lnHF
Forest
Difference
(p-value)
Urban
ln(LF/HF)
Forest
Difference
(p-value)
Mean
Median
SD
CV (%)
Q1
Q3
IQR
Skewness
Kurtosis
3.93
3.96
1.06
27.0
3.17
4.65
1.49
−0.03
−0.30
4.33
4.27
1.16
26.74
3.56
5.11
1.55
0.13
−0.13
p < 0.01
p < 0.01
p = 0.06
p = 0.83
p < 0.01
p < 0.01
p = 0.62
p = 0.24
p = 0.43
2.16
2.18
0.62
28.5
1.74
2.54
0.80
0.10
−0.15
1.96
1.95
0.63
32.1
1.53
2.39
0.86
0.18
−0.24
p < 0.01
p < 0.01
p = 0.55
p < 0.01
p < 0.01
p < 0.01
p = 0.34
p = 0.47
p = 0.64
SD, standard deviation; CV, coefficient of variation; Q1, quartile 1 (25th percentile); Q3, quartile 3 (75th percentile); IQR, interquartile range; Skewness, a measure of symmetry
of distribution; Kurtosis, a measure of whether the distribution curve is peaked (positive) or flat (negative) relative to the normal distribution. Differences between urban and forest
environments were tested by a permutation test.
FIGURE 2 | Histograms of difference in heart rate variability indicators between urban and forest environments. Left and right panels demonstrate histograms for the
difference in lnHF and ln(LF/HF), respectively. As for the parasympathetic indicator (lnHF), the percentage of positive responders (presenting an increase in forest
environment) was ∼65%. Regarding the sympathetic indicator [ln(LF/HF)], the percentage of positive responders (presenting a decrease in forest environment) was
∼67%.
A chi-square test revealed that this difference in ln(LF/HF) was
not statistically significant (p = 0.30).
DISCUSSION
Analysis of Distribution Characteristics
One of this study’s feature is the inclusion of an analysis with
special reference to the distribution characteristics of individual
variations in the HRV response. Skewness and kurtosis of HRV
indices did not change in either lnHF or ln(LF/HF), although
significant changes in the mean values were observed between
urban and forest environments. In other words, walking in a
forest environment shifted the distribution curve higher (lnHF)
or lower [ln(LF/HF)] while maintaining its shape. This was
similar to the results in HRV during the viewing of urban and
forest landscapes in a previously reported study (17).
Not all physiological indicators, however, maintain the shape
of their distribution curve in response to natural environments.
Salivary cortisol concentration indicated a significant decrease in
forest environments compared with that in urban environments,
accompanying a more skewed and kurtotic distribution (10). This
modification of the distribution curve might be attributed to a
floor effect (28, 29). Therefore, an unchanged distribution curve
is a specific response in log-transformed HRV indicators.
Frontiers in Public Health | www.frontiersin.org
5
October 2018 | Volume 6 | Article 278

Kobayashi et al.
Forest Walking Affects Autonomic Functions
TABLE 4 | Number of participants who indicated positive / negative response of
HRV indices in forest environment.
lnHF
ln(LF/HF)
Positive
response
Negative
response
Positive
response
Negative
response
Walking (n = 485)
Viewing* (n = 625)
316
(65.2%)
495
(79.2%)
169
(34.8%)
130
(20.8%)
325
(67.0%)
400
(64.0%)
160
(33.0%)
225
(36.0%)
Chi-squared
27.4 (p < 0.01)
1.0 (p = 0.30)
*Results on HRV during viewing urban or forest landscapes were presented in our previous
report (17).
Effects of Natural Environment on HRV
During walking in forest environments, larger lnHF and smaller
ln(LF/HF) were observed compared with those upon walking in
urban environments. As the lnHF and ln(LF/HF) are indicators
of parasympathetic and sympathetic nervous activity, the present
results implied that the autonomic relaxation occurred during
walking in forest environments. The results are consistent
to those in our previous study (17). Therefore, walking in
forest environments and viewing forest landscapes demonstrated
qualitatively similar effects on autonomic functions.
Controversy, quantitative comparisons between the present
and previous results revealed a different tendency in the
autonomic response to walking and viewing. During walking
in forest environments, 65.2% participants exhibited a positive
response in the parasympathetic indicator (lnHF), which was
significantly lower than the percentage of positive responders
during viewing of forest landscape (79.2%). Contrary, for the
sympathetic indicator, the percentage of positive responders
during walking (67.0%) was almost identical to that during
viewing (64.0%). Therefore, the effect of a forest environment
on parasympathetic nervous activity was more apparent during
viewing than walking, whereas sympathetic activity exhibited
almost the same responses to viewing and walking regarding the
percentage of positive responders.
Positive and Negative Effects of a Natural
Environment
In 1984, the distinguished biologist Edward O. Wilson proposed
the biophilia hypothesis (30). Biophilia is defined as the “innate
tendency to focus on life and life-like processes” (31). For millions
of years, our ancestors lived in the savannas of Africa. Within
this environment, natural features, such as trees or forests, could
provide food, water, or shelter, thereby increasing the probability
of survival. Thus, biophilia can be regarded as an adaptive
characteristic.
Alternatively, it is known that certain people show a strong
dislike for natural settings. This tendency is called biophobia
(32). Biophobia includes certain specific phobias, such as
arachnophobia (irrational fear of spiders) or entomophobia
(fear of insects). There is also a term referring to the fear
of forests (hylophobia/xylophobia) (33). Biophobia is also an
adaptive psychological trait because of inherent dangers in the
natural environment (e.g., predators and poisonous organisms).
Therefore, the effect of the natural environment on humans is
two-sided.
From the perspective of evolutionary psychology, a model
for the effects of the natural environment on humans has been
proposed, which includes three factors: drive, contentment, and
threat (34, 35). Drive includes emotions such as joy, approach,
appetite, stimulation, and positiveness. As an endocrine response,
it is related to dopamine secretion. In contrast, contentment
is concerned with emotions such as calmness, relaxation, and
safety and is related to the oxytocin and opiate systems. In terms
of autonomic regulation, drive and contentment are associated
with sympathetic and parasympathetic activities, respectively
(35). A relaxation in autonomic nervous activity [increase in
lnHF and decrease in ln(LF/HF)] was observed in the forest
environment during both walking and viewing; therefore, it
can be considered that exposure to a forest environment
mainly confers contentment rather than drive. Furthermore, a
comparison between present and our previous results suggested
that viewing a forest landscape could provide more contentment
than walking in a forest environment.
A major limitation of this study is that it included
only Japanese young male subjects. The tendency for
biophilia/biophobia may be affected by difference in age,
gender, and ethnicity of participants. Effects of demographic
and geographic factors on physiological responses to
natural environments should be investigated in a future
study.
CONCLUSION
The autonomic relaxation (increases in parasympathetic
indicator and/or decreases in sympathetic indicator) in forest
environments has been demonstrated by HRV analysis in
previous studies. This result was also confirmed in this study.
However, a comparison between the present and our previous
study (17) suggested that the response of HRV differ between
viewing and walking.
The effect of forest environments consists of several factors,
including negative emotions. It is reasonable that a certain
percentage of a population exhibits a negative response to forest
environments. Therefore, population-based analysis is required
in which the existence of negative responders is taken into
consideration.
AUTHOR CONTRIBUTIONS
HK contributed to statistical analysis, interpretation of the
results, and manuscript preparation. CS and HI were involved
with data acquisition and initial analysis of the results. B-JP, JL,
and TK participated in data acquisition and study design. YM had
an important role in the research, particularly in experimental
design, data acquisition, and manuscript preparation. All authors
contributed to the preparation of the manuscript and are
responsible for the final editing and approval.
Frontiers in Public Health | www.frontiersin.org
6
October 2018 | Volume 6 | Article 278

Kobayashi et al.
Forest Walking Affects Autonomic Functions
FUNDING
ACKNOWLEDGMENTS
This study was partially supported by a JSPS KAKENHI grant,
number JP16107007 and a research project by the Vehicle Racing
Commemorative Foundation.
The authors thank Takeshi Morikawa of the Forestry and
Forest Products Research Institute and Yuko Tsunetsugu of the
University of Tokyo for their assistance in the experiments.
REFERENCES
1. Selhub EM, Logan AC. Your Brain on Nature: the Science of Nature’s Influence
on Your Health, Happiness and Vitality. Mississauga, ON: John Wiley & Sons
(2012). p. 18–9.
2. Hansen MM, Jones R, Tocchini K. Shinrin-yoku (forest bathing) and nature
therapy: a state-of-the-art review. Int J Environ Res Public Health (2017)
14:851. doi: 10.3390/ijerph14080851
3. Miyazaki Y. Shinrin-yoku: the Japanese Way of Forest Bathing for Health and
Relaxation. London: Octopus Publishing Group Ltd (2018).
4. Bowler DE, Buyung-Ali LM, Knight TM, Pullin AS. A systematic review of
evidence for the added benefits to health of exposure to natural environments.
BMC Public Health (2010) 10:456. doi: 10.1186/1471-2458-10-456
5. Song C, Ikei H, Miyazaki Y. Physiological effects of nature therapy: a review
of the research in Japan. Int J Environ Res Public Health (2016) 13:781.
doi: 10.3390/ijerph13080781
6. Ochiai H, Ikei H, Song C, Kobayashi M, Takamatsu A, Miura T, et al.
Physiological and psychological effects of forest therapy on middle-age males
with high-normal blood pressure. Int J Environ Res Public Health (2015)
12:2532–42. doi: 10.3390/ijerph120302532
7. Song C, Ikei H, Miyazaki Y. Sustained effects of a forest therapy program on
the blood pressure of office workers. Urban Urban Green (2017) 27:246–52.
doi: 10.1016/j.ufug.2017.08.015
8. Ohe Y, Ikei H, Song C, Miyazaki Y. Evaluating the relaxation effects of
emerging forest-therapy tourism: a multidisciplinary approach. Tourism
Manage (2017) 62:322–34. doi: 10.1016/j.tourman.2017.04.010
9. Ochiai H, Ikei H, Song C, Kobayashi M, Miura T, Kagawa T, et al.
Physiological and psychological effects of a forest therapy program on
middle-aged females. Int J Environ Res Public Health (2015) 12:15222–32.
doi: 10.3390/ijerph121214984
10. Kobayashi H, Song C, Ikei H, Park BJ, Lee J, Kagawa T, et al. Population-based
study on the effect of forest environment on salivary cortisol concentration.
Int J Environ Res Public Health (2017) 14:931. doi: 10.3390/ijerph14080931
11. Li Q, Morimoto K, Kobayashi M, Inagaki H, Katsumata M, Hirata Y, et al.
A forest bathing trip increases human natural killer activity and expression
of anti-cancer proteins in female subjects. J Biol Regul Homeost Agents (2008)
22:45–55. Available online at: http://www.biolifesas.org/jbrha/Jbrha22n1.pdf
12. Li Q, Kobayashi M, Wakayama Y, Inagaki H, Katsumata M,
Hirata Y, et al. Effect of phytoncide from trees on human natural
killer function. Int J Immunopathol Pharmacol. (2009) 22:951–59.
doi: 10.1177/039463200902200410
13. Li Q. Effect of forest bathing trips on human immune function. Environ
Health Prev Med. (2010) 15:9–17. doi: 10.1007/s12199-008-0068-3
14. Task Force of the European Society of Cardiology and the North American
Society of Pacing and Electrophysiology. Heart rate variability. standards
of measurement, physiological interpretation, and clinical use. Circulation
(1996) 93:1043–65. doi: 10.1161/01.CIR.93.5.1043
15. Kobayashi H, Ishibashi K, Noguchi H. Heart rate variability; an index for
monitoring and analyzing human autonomic activities. Appl Human Sci.
(1999) 18:53–9. doi: 10.2114/jpa.18.53
16. Tsunetsugu Y, Lee J, Park BJ, Tyrväinen L, Kagawa T, Miyazaki Y.
Physiological and psychological effects of viewing urban forest landscapes
assessed by multiple measurements. Landscape Urban Plan (2013) 113:90–3.
doi: 10.1016/j.landurbplan.2013.01.014
17. Kobayashi H, Song C, Ikei H, Kagawa T, Miyazaki Y. Analysis of
individual variations in autonomic responses to urban and forest
environments. Evid Based Complement Alternat Med. (2015) 2017:671094.
doi: 10.1155/2015/671094
18. Song C, Ikei H, Kobayashi M, Miura T, Li Q, Kagawa T, et al. Effects of
viewing forest landscape on middle-aged hypertensive men. Urban Urban
Green (2017) 21:247–52. doi: 10.1016/j.ufug.2016.12.010
19. Song C, Joung D, Ikei H, Igarashi M, Aga M, Park BJ, et al. Physiological and
psychological effects of walking on young males in urban parks in winter.
J Physiol Anthropol. (2013) 32:18. doi: 10.1186/1880-6805-32-18
20. Lee J, Tsunetsugu Y, Takayama N, Park BJ, Li Q, Song C, et al. Influence
of forest therapy on cardiovascular relaxation in young adults. Evid Based
Complement Alternat Med. (2014) 2014:834360. doi: 10.1155/2014/834360
21. Song C, Ikei H, Kobayashi M, Miura T, Taue M, Kagawa T, et al. Effect
of forest walking on autonomic nervous system activity in middle-aged
hypertensive individuals. Int J Environ Res Public Health (2015) 12:2687–699.
doi: 10.3390/ijerph120302687
22. Rose G. Sick individuals and sick populations. Int J Epidemiol. (2001) 30:427–
32. doi: 10.1093/ije/30.3.427
23. Kobayashi H, Park BJ, Miyazaki Y. Normative references of heart rate
variability and salivary alpha-amylase in a healthy young male population.
J Physiol Anthropol. (2012) 31:9. doi: 10.1186/1880-6805-31-9
24. Kobayashi H. Does paced breathing improve the reproducibility of heart
rate variability measurements? J Physiol Anthropol. (2009) 28:225–30.
doi: 10.2114/jpa2.28.225
25. Kim TH, White H. On more robust estimation of skewness and kurtosis.
Financ Res Lett. (2004) 1:56–73. doi: 10.1016/S1544-6123(03)00003-5
26. Schwertman NC, Owens MA, Adnan RA. A simple more general boxplot
method for identifying outliers. Comput Stat Data Anal. (2004) 47:165–74.
doi: 10.1016/j.csda.2003.10.012
27. Phipson B, Smyth GK. Permutation p-values should never be zero: calculating
exact P-values when permutation are randomly drawn. Stat App Genet Mol
Biol. (2010) 9:39. doi: 10.2202/1544-6115.1585
28. Kobayashi H, Miyazaki Y. Distribution characteristics of salivary cortisol
measurements in a healthy young male population. J Physiol Anthropol. (2015)
34:30. doi: 10.1186/s40101-015-0068-0
29. Kobayashi H, Song C, Ikei H, Kagawa T, Miyazaki Y. Diurnal changes
in distribution characteristics of salivary cortisol and immunoglobulin
A concentrations. Int J Environ Res Public Health (2017) 14:987.
doi: 10.3390/ijerph14090987
30. Wilson EO. Biophilia: the Human Bond With Other Species. Cambridge, MA:
Harvard University Press (1984).
31. Gullone E. The biophilia hypothesis and life in the 21st century: increasing
mental health or increasing pathology? J Happiness Stud. (2000) 1:293–322.
doi: 10.1023/A:1010043827986
32. Ulrich RS. Biophilia, biophobia, and natural landscapes. In: Kellert SR, Wilson
EO, editors. The Biophilia Hypothesis. Washington, DC: Island Press (1993).
p. 73–137.
33. Griffin CJ. Space and place–popular perceptions of forests. In: Ritter E,
Dauksta D, editors. New Perspectives on People and Forests. Dordrecht:
Springer Science & Business Media (2011). p. 139–58.
34. Gilbert P. The origins and nature of compassion focused therapy. Br J Clin
Psychol. (2014) 53:6–41. doi: 10.1111/bjc.12043
35. Richardson M, McEwan K, Maratos F, Sheffield D. Joy and calm: how an
evolutionary functional model of affect regulation informs positive emotions
in nature. Evol Psychol Sci. (2016) 2:308–20. doi: 10.1007/s40806-016-0065-5
Conflict of Interest Statement: The authors declare that the research was
conducted in the absence of any commercial or financial relationships that could
be construed as a potential conflict of interest.
Copyright © 2018 Kobayashi, Song, Ikei, Park, Lee, Kagawa and Miyazaki. This is an
open-access article distributed under the terms of the Creative Commons Attribution
License (CC BY). The use, distribution or reproduction in other forums is permitted,
provided the original author(s) and the copyright owner(s) are credited and that the
original publication in this journal is cited, in accordance with accepted academic
practice. No use, distribution or reproduction is permitted which does not comply
with these terms.
Frontiers in Public Health | www.frontiersin.org
7
October 2018 | Volume 6 | Article 278