

International Journal of
Environmental Research
and Public Health
Article
Let Nature Be Thy Medicine: A Socioecological
Exploration of Green Prescribing in the UK
Jake M. Robinson 1,2,3,* , Anna Jorgensen 1 , Ross Cameron 1 and Paul Brindley 1
1 Department of Landscape, University of Sheffield, Sheffield S10 2TN, UK; a.jorgensen@sheffield.ac.uk (A.J.);
R.W.cameron@sheffield.ac.uk (R.C.); p.brindley@sheffield.ac.uk (P.B.)
2 inVIVO Planetary Health, of the Worldwide Universities Network (WUN), West New York, NJ 10704, USA
3 Healthy Urban Microbiome Initiative (HUMI), Adelaide, SA 5005, Australia
* Correspondence: jmrobinson3@sheffield.ac.uk
Received: 16 April 2020; Accepted: 13 May 2020; Published: 15 May 2020
Abstract: Prescribing nature-based health interventions (green prescribing)—such as therapeutic
horticulture or conservation activities—is an emerging transdisciplinary strategy focussed on reducing
noncommunicable diseases. However, little is known about the practice of, and socioecological
constraints/opportunities associated with, green prescribing in the UK. Furthermore, the distribution
of green prescribing has yet to be comprehensively mapped. In this study, we conducted a
socioecological exploration of green prescribing. We deployed online questionnaires to collect data
from general practitioners (GPs) and nature-based organisations (NBOs) around the UK and conducted
spatial analyses. Our results indicate that GPs and NBOs perceive and express some common and
distinct constraints to green prescribing. This highlights the need to promote cross-disciplinary
communication pathways. Greenspace presence and abundance within close proximity (100 and
250 m) to GP surgeries (but not greenness—as a proxy for vegetation cover) and NBO presence within
5 km were associated with higher levels of green prescribing provision. Lower levels of deprivation
were associated with higher frequency of NBOs. This suggests that the availability of greenspaces and
NBOs could be important for green prescribing provision, but there could be greater opportunities
in less deprived areas. Important foci for future research should be to establish transdisciplinary
collaborative pathways, efficient infrastructure management and a common vocabulary in green
prescribing—with the overall aim of reducing inequalities and enhancing planetary health.
Keywords: green prescriptions; planetary health; nature-based interventions; urban nature;
biodiversity; mental health; nature connectedness; greenspace; noncommunicable diseases; upstream
health interventions
1. Introduction
It is now widely accepted that spending time in natural or semi-natural environments (e.g., forests,
grasslands, gardens and parks) can result in significant positive mental and physical health benefits [1–3].
For example, the Japanese practice of Shinrin-yoku or ‘forest bathing’ has been shown to enhance
innate immunity via lymphocyte cell activity and can reduce diastolic and systolic blood pressure [4,5];
gardening can provide relief from acute stress and improve symptoms of depression [6,7]; and simply
spending time in nature can enhance psychological restoration (the ability to recover from stress)
and can facilitate healthy child development [8–10]. Through the biophilia hypothesis, Wilson (1984)
argues that humans hold an innate affinity to seek connections with nature. Furthermore, there is
evidence to suggest that the environmental microbiome—the diverse consortium of microorganisms in
a given environment—can have positive developmental and regulatory influences on the immune
system and potentially anxiolytic effects [11–13]. This latter claim is supported by a recent mouse study,
Int. J. Environ. Res. Public Health 2020, 17, 3460; doi:10.3390/ijerph17103460
www.mdpi.com/journal/ijerph

Int. J. Environ. Res. Public Health 2020, 17, 3460
2 of 24
in which exposure to trace levels of biodiverse soil dust was significantly associated with reduced
anxiety like behaviours [13]. Natural environments can also provide important places for reflection and
introspection, for cultivating feelings of awe, inspiration and freedom, and for facilitating group-based
convivial activities, which could help to improve social cohesion and enhance mental health [14–17].
Interacting with nature for salutogenic effects is by no means a novel concept. From a Western
societal perspective, the fundamental principles of nature-based therapies can be traced back to the
Hippocratic era (460–370 BC), when changing environments and lifestyle practices were advised
by the physicians of the time [18]. Furthermore, the Greeks and Romans established thermal spa
baths to improve health and well-being [19–21]. From a traditional ecological knowledge perspective,
indigenous Australians recognised the deep connections between mental and physical health and the
“land and river”, and Canadian First Nations’ holistic view of health highlights the interrelatedness of
human well-being and the environment [22,23]. It is important to recognise that our complex societies
have evolving views, social behaviours and health-related needs, and it is unrealistic to view spending
‘time in nature’ as a panacea—i.e., it is unlikely to be suitable for everyone and for all conditions.
However, there is growing interest in ‘green prescribing’ (GRx) as a contemporary practice of
prescribing nature-based health interventions, particularly for noncommunicable diseases [24–26]. Green
prescribing builds on the earlier concept of prescribing exercise and diet-based interventions [27]—a
variant that was pioneered by general practitioners (GPs) in New Zealand in the 1990s [28]. It also
builds on the recent social prescribing movement, which can be defined as: “a way of linking patients
in primary care with sources of support within the community—usually provided by the voluntary
and community sector, offering GPs a non-medical referral option that can operate alongside existing
treatments to improve health and well-being”, [29] (p. 7) [30,31].
Green prescriptions are typically administered to patients with a defined need and can be used
to complement orthodox medical practices [32,33]. Nature-based intervention activities can include
therapeutic horticulture, biodiversity conservation activities, care farming (i.e., farming practices for
health, socialising and education), nature walks, and social activities in greenspaces [34–36]—and
although the social element is often important, it is not a necessity. To establish effective and
sustainable green prescribing schemes, cooperative interactions between primary care professionals
and nature-based organisations (NBOs) are typically required, and the ability to speak multiple
disciplinary ‘languages’ is considered an essential asset [37].
There is potential for green prescribing to contribute to health care (reactive) and sustainable health
promotion (proactive), while potentially bringing important co-benefits (e.g., social, environmental,
and economic benefits) [38]. However, it is still an emerging and unorthodox strategy. As such, initial
adoption may be sporadic and limited. In the UK, little is known about the status of (distribution
and practice), and socioecological constraints and opportunities associated with green prescribing. To
our knowledge, no one has explicitly mapped nationwide green prescribing services/infrastructure.
To this end, mapping could be a useful policy action (e.g., for informing targeted resource allocation).
Moreover, gaining insights into the perceived constraints of green prescribing from the view of
primary care professionals and NBOs could help to synchronise knowledge and empathy and identify
disciplinary barriers to aid in future management and delivery. Furthermore, exploring ecological,
spatial and social factors that may affect green prescribing could also provide important insights for
policy makers.
In this study, we conducted a socioecological exploration of the green prescribing health
intervention model in the UK. Our primary aims for this study were to (a) explore awareness,
constraints and opportunities associated with green prescribing, focusing on general practitioners
(as potential prescribers) and nature-based organisations (as potential providers) around the UK;
(b) collect spatial data to estimate the general distribution of green prescribing; and (c) to explore
whether available services, geography, greenspace, and deprivation influenced green prescribing
awareness, provision and constraints.
Int. J. Environ. Res. Public Health 2020, 17, 3460
3 of 24
2. Materials and Methods
2.1. Online Questionnaire and the Web-Scrape Process
We formulated two online-based questionnaires—one for GPs (as potential service prescribers)
and one for nature-based organisations (as potential service providers). The questionnaires included
8–10 structured questions, formulated with the aid of a pilot study and a group of GP volunteers
prior to commencing the research. The questionnaires were ethically reviewed by the University of
Sheffield’s Department of Landscape internal review committee and by the National Health Service’s
(NHS) Health Research Authority (HRA); Integrated-Research Application System (IRAS) reference
number: 261514.
The research questionnaires included key questions regarding geolocation, awareness and status
of green prescribing, and a question to ascertain what the respondents considered to be the main
constraints to green prescribing. The questions are set out in Figures A1 and A2 in Appendix A.
The online questionnaires were distributed to GPs and NBOs across the UK (between March
and September 2019) via an introductory email with a detailed participant information sheet, consent
form and a secure link to the questionnaire. The questionnaires were hosted by the University of
Sheffield’s Google Forms account. Contact details for the GPs were obtained via the publicly-available
NHS online contact directory (www.nhs.uk/service-search/find-a-gp) and by contacting the Clinical
Commissioning Groups (CCG) directly. The protocol for approaching GPs was also ethically reviewed
by the HRA.
The contact details for the NBOs were obtained via a web-scrape process (web data searched and
copied into a central local database) combined with an approach based on the Preferred Reporting
Items for Systematic Reviews and Meta-Analyses (PRISMA) workflow [39,40].
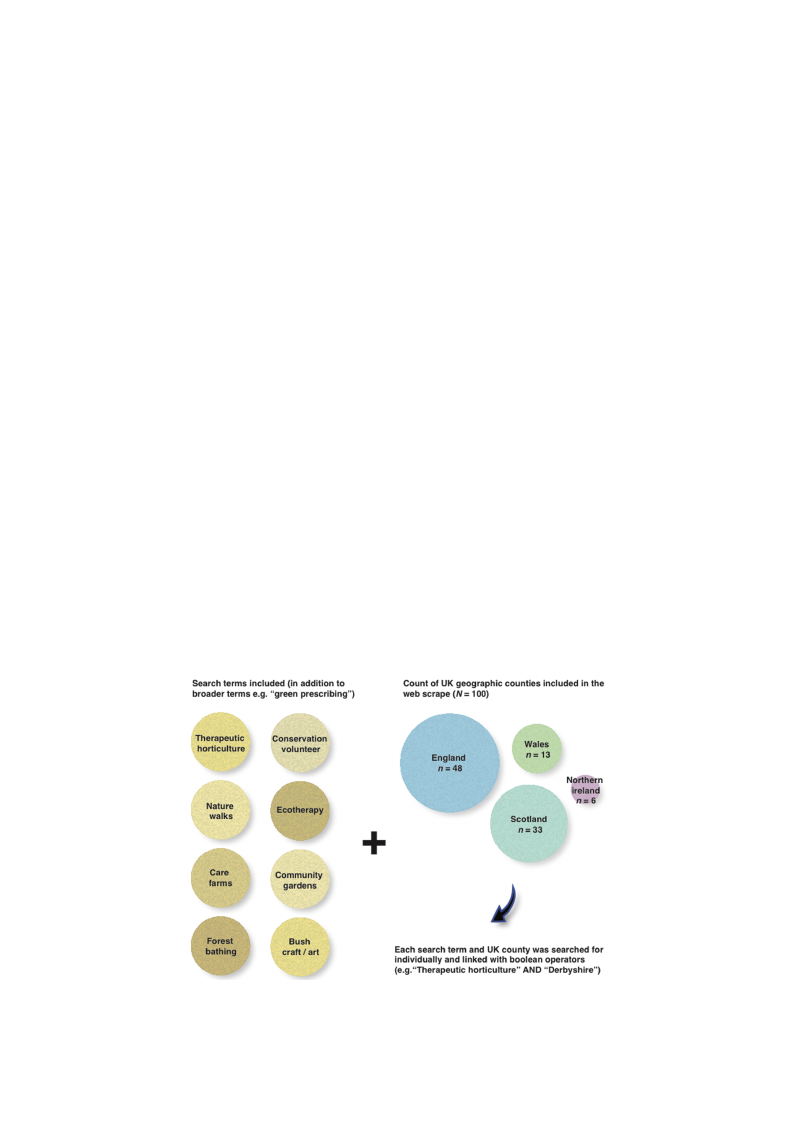
To obtain a list of all the relevant organisations either currently facilitating or having the potential
to facilitate green prescribing schemes in the UK, a set of relevant search terms were compiled (e.g.,
“green prescriptions”; “green care”; “nature-based intervention”). These were then tested and refined
in the Google search engine and filters were applied to include only UK results. Additionally, green
prescribing activity search terms were used for each of the 100 geographic counties (subnational
divisions) Iinnt. Jt. hEnevirUonK. Re(sF. PiugbluicrHeea1lth).20W20,h17e, xre possible, email contact details were obtained an4dof 2g5eographic
coordinates were acquired for subsequent GIS analysis.
Figure 1. Green prescribing web scrape search method for nature-based organisations. Search terms
are shownFoignurtehe1. lGerfet,enanprdesacrciboiungnwt bebresacrkadpeosweanrcohfmUetKhocdofuornntiaetusrpe-ebrasceoduonrgtraynisoantiotnhse. Sreiagrhcht.terms
are shown on the left, and a count breakdown of UK counties per country on the right.
A detailed participant information sheet and informed consent form was also provided to the
nature-based organisations. Once the responses were entered and submitted, they were downloaded
by the researchers in a comma separated values (.csv) format for subsequent processing and analysis.
The questionnaire structure and plan for maximizing response rate was informed by references [41–
43].
Int. J. Environ. Res. Public Health 2020, 17, 3460
4 of 24
A detailed participant information sheet and informed consent form was also provided to the
nature-based organisations. Once the responses were entered and submitted, they were downloaded
by the researchers in a comma separated values (.csv) format for subsequent processing and analysis.
The questionnaire structure and plan for maximizing response rate was informed by references [41–43].
2.2. Coding of Open-Ended Responses
For the perceived barriers question (Q.7 Figure A1 in Appendix A), the open-ended response
format was chosen to allow respondents to “use their own language and express their own views” [44]
(p. 9). To classify and “clean” the data for subsequent analysis, the responses to the questions with the
open-ended answer format (descriptive) were coded.
The approach to interpret these textual responses was to read through each answer several times
in a spreadsheet, seeking key recurring themes. These themes specifically related to the focal topics
and respondent views. A set of theme codes were generated, providing “the basis for surfacing the
frequency of occurrence of themes” in preparation for subsequent quantitative analysis [44] (p. 29).
A short and perfunctory response or more in-depth response could be assigned the same code—for
example, “lack of funding” and a detailed response with an obvious focus on the lack of funding
would be given the code ‘Funding’ (as a key constraint to green prescribing).
2.3. GIS Data
Once the spreadsheets containing the responses and geolocations were cleaned, they were saved
as .csv files and imported into QGIS 3.4 as vectors layers. These were then converted to ESRI
point shapefiles.
2.3.1. BuffIenrt. JA. Ennvairloyn.sRiess. Public Health 2020, 17, x
5 of 25
The p2o.3i.n1t. BfiuleffserwAenraelysseisparated into four categories, as follows: “Yes” to green prescribing provision
(responses froTmhe GpoPins)t;fi“leNs ow”erteosegpraereantedpirnetsocrfoiburincgatepgroorivesi,siaosnfo(lrloewsps:o“nYsees”s tforogmreeGn Pprse)s;cr“iYbiensg” to green
prescriptiopnrofvaicsiiolinta(rteisopnon(rseesspfroomnsGePssf)r;o“mNoN” tBo Ogrse)e;n“pNreosc”ritboinggrpereonvipsiroens(crreispptoinosnesffarcoimlitGaPtiso);n“Y(rees”sptoonses from
nature-basgeredenorpgraenscirsipattiioonnsfa)c. ilitation (responses from NBOs); “No” to green prescription facilitation
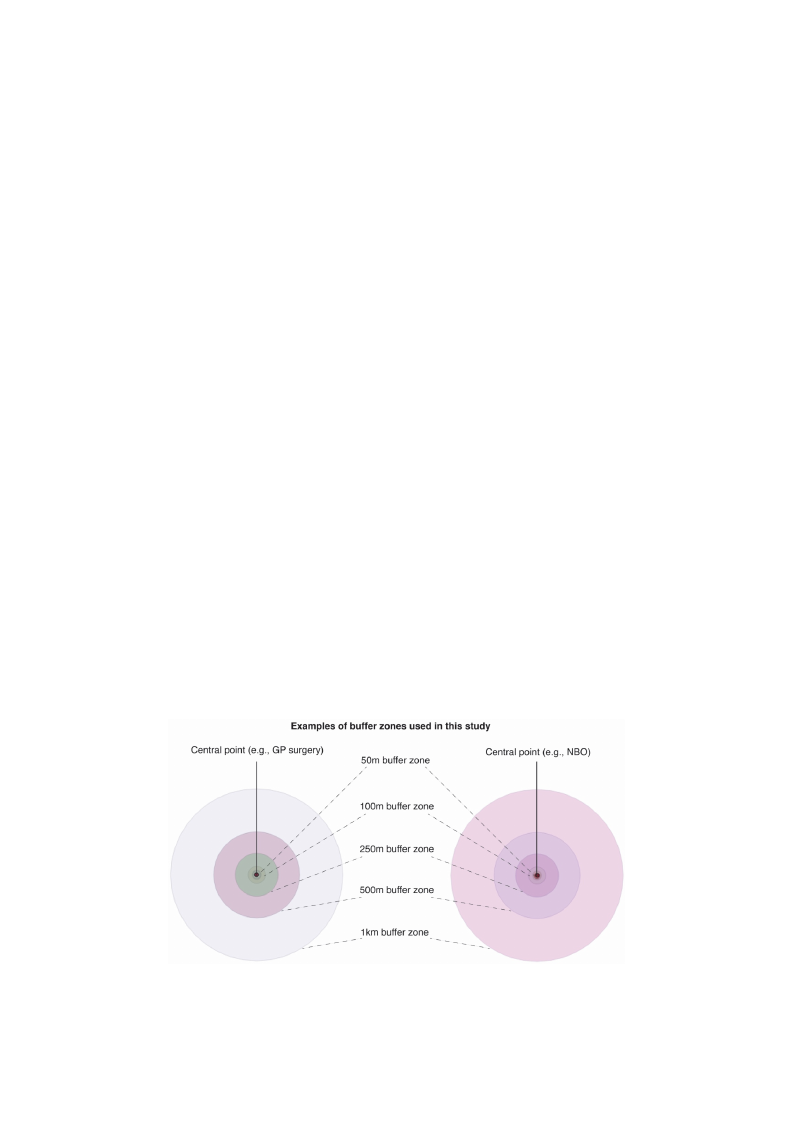
Using(rvesepcotnosresgferoopmrnoacteusrse-ibnagsetdooorlsg,anciisractuiolnasr).buffer zones (radii from central coordinate of GP surgery
Using vector geoprocessing tools, circular buffer zones (radii from central coordinate of GP
or NBO) osfu5rg0emry,o1r0N0BmO) 2o5f 050mm,, 510000mm2,510 kmm, 50a0nmd,51 kkmmawnder5ektmhewnercertehaetnecdreaartoeduanrdouenadcehacphopinoitntto facilitate
spatial anatolyfasceilsita(tFeisgpuatrieal2a)n.alTyhseess(eFigraurdei2i)h. Tahveesebreadeini huavsee dbeienn usseevdeirnaslevsepraaltisaplatsiatul sdtuideisesininvvoollvviinngg the built
environmethnet,buuirltbeannvigrornemenenst,puarcbeans garneednhspuamceasnanhdehaulmthan[4h5e–al4th7][.45–47].
Figure 2. FEigxuarme 2p.lEexoamf pblue ffoferbuzfofenr ezsoncersecarteeadtedaraorouunndd eeaachchpopinotinfilteficolentcaionnintgaianttirnibgutaetdtraitba u(stpeatdiaalta (spatial
informatioinnfoarnmdatqiouneasntdioqnunesatiiornenraeirseproesnpsoenss)esf)ofrorGGPPss annddnnatautrue-rbea-sbeadsoerdgaonrisgaatinonisaintitohnesUiKn. the UK.
2.3.2. Graduated Symbology
To provide map outputs and descriptive statistics of the web-scrape results, UK county
boundary datasets were obtained from UK government sources (e.g.,
https://ckan.publishing.service.gov.uk/dataset and https://opendatani.gov.uk/dataset).
Green prescribing activity attributes were then joined ‘by location’ to the county boundary
datasets using vector data management tools. The symbologies were subsequently graduated and
classified to provide a visual representation of quantitative differences in values using defined colour

Int. J. Environ. Res. Public Health 2020, 17, 3460
5 of 24
2.3.2. Graduated Symbology
To provide map outputs and descriptive statistics of the web-scrape results, UK county boundary
datasets were obtained from UK government sources (e.g., https://ckan.publishing.service.gov.uk/
dataset and https://opendatani.gov.uk/dataset).
Green prescribing activity attributes were then joined ‘by location’ to the county boundary datasets
using vector data management tools. The symbologies were subsequently graduated and classified to
provide a visual representation of quantitative differences in values using defined colour ramps.
2.3.3. Landscape/Environmental Datasets
To analyse aspects of greenspace and infrastructure, the OS Open Greenspace dataset
(a comprehensive dataset of publicly accessible urban greenspaces) was imported into QGIS as
a polygon vector layer with a point layer for greenspace access locations. These datasets have been
used in several urban greenspace studies [48,49].
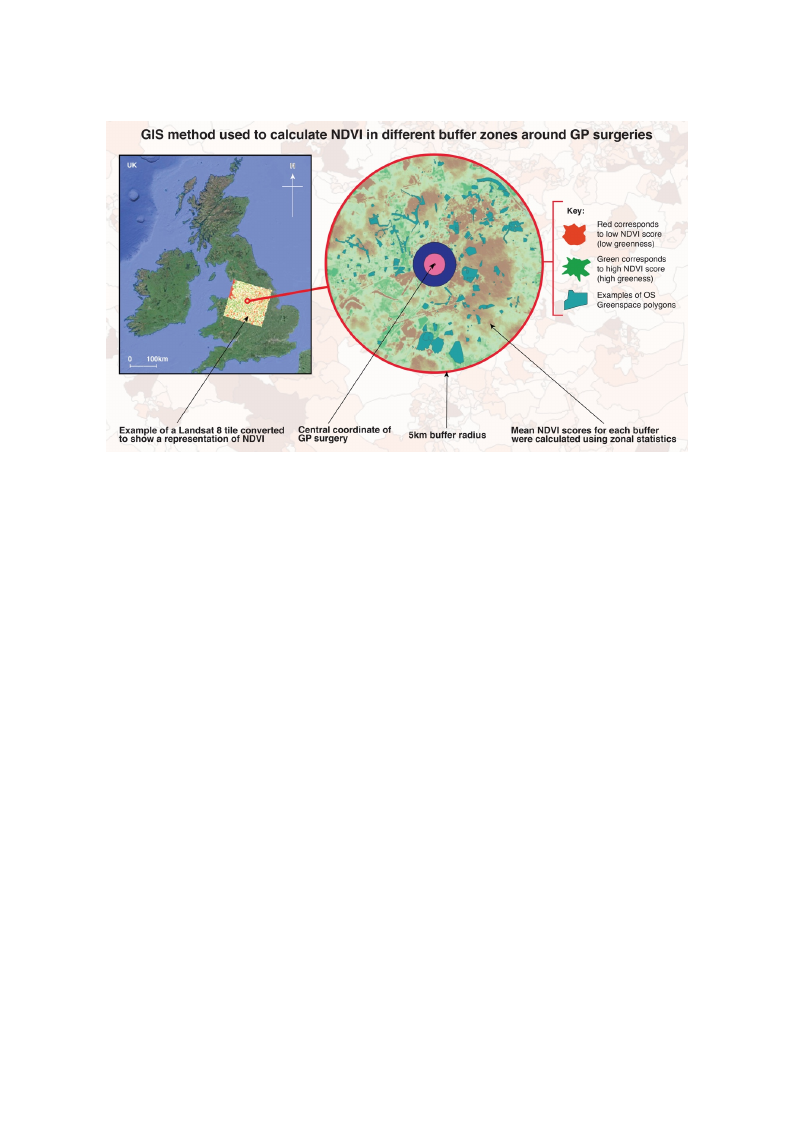
A measure of greenness (mean greenness for each buffer zone) was also calculated using NASA
Landsat 8 Imagery (30 m resolution), isolating spectral bands 4 (Red) and 5 (Near Infrared) and
applying the equation for the Normalised Difference Vegetation Index (NDVI). This process provides a
score of estimated landcover greenness, where 0 represents no greenness and 1 represents high levels
of greenness—used as a proxy for vegetation cover. The equation to obtain this metric is as follows:
Near In f rared Light − Red
Near In f rared Light + Red
Using the Raster algebraic expression calculator, the above equation was applied to the two spectral
band layers, i.e., Red and Near Infrared (NIR). The resulting outputs were subsequently rendered into
a single band pseudocolour and represented using a RdYlGn (Red-Yellow-Green) colour ramp.
2.3.4. Deprivation Data
To explore relationships between green prescribing and deprivation, quintile scores from an
Index of Multiple Deprivation (IMD) dataset previously adjusted for each UK country was used [50].
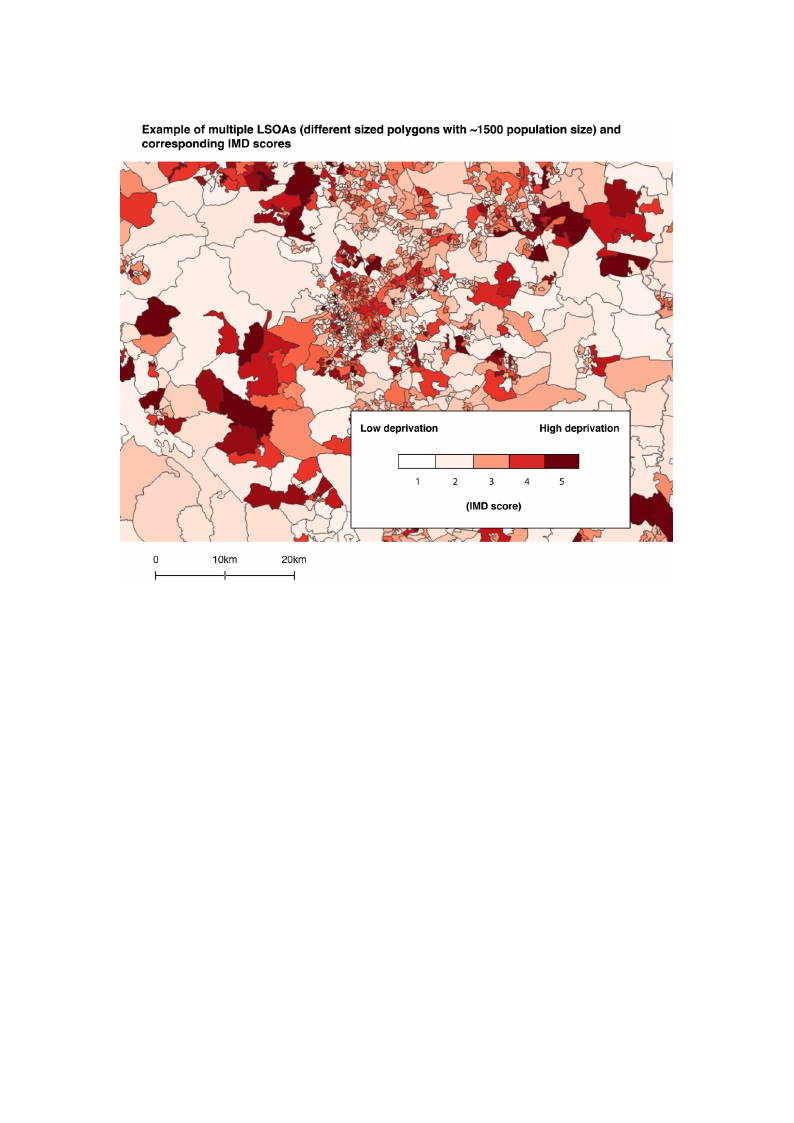
IMD data have been used in several greenspace epidemiology studies [51–53]. The IMD provides
multivariate data on relative deprivation in Lower Super Output Areas (LSOAs) for England, Wales and
Northern Ireland and data zone layers for Scotland (Figure 3). LSOAs are boundary areas containing an
average population of approximately 1500 and up to 1000 in data zones. These geographic boundaries
have been used in similar socioecological studies [54–56].
2.4. Spatial and Statistical Analyses
To facilitate quantitative analysis and maximise UK-wide representation, the aim was to acquire
n = 367 responses from GPs based on an approximate population size (of UK GP practices) of 8000 [57],
with a 95% Confidence Level and a 5% Margin of Error. For NBOs, the aim was to acquire a sample
size of n = 251. This was based on the n = 714 results from the web-scrape, with a 95% Confidence
Level and a 5% Margin of Error.
To facilitate quantitative analysis of potential relationships between the presence or absence of
green prescriptions and the independent variables (e.g., greenspaces; deprivation etc.), the ‘Yes’/’No’
questionnaire responses for Question 3 (i.e., “Does your GP practice provide green prescriptions?”)
were extracted and recoded to numerical binary variables, where 1 = Yes/Present; and 0 = No/Absent.
We used a combination of parametric and nonparametric statistical tests and qualitative coding to
facilitate the analyses.
IMD data have been used in several greenspace epidemiology studies [51–53]. The IMD provides
multivariate data on relative deprivation in Lower Super Output Areas (LSOAs) for England, Wales
and Northern Ireland and data zone layers for Scotland (Figure 3). LSOAs are boundary areas
containing an average population of approximately 1500 and up to 1000 in data zones. These
Ignet.oJg. Eranpvihroinc. bRoesu. PnudbalirciHeesalhtha2v0e20b,e1e7,n34u6s0ed in similar socioecological studies [54–56].
6 of 24
Figure 3. Example of Lower Super Output Areas (LSOAs) (boundaries) with Index of Multiple
DepFriigvuarteio3n. E(IxMamD)pslecoorfesLouwsinergS‘cuapteergoOruistepdu’tsAymrebaosl(oLgSyOiAn sQ) G(bIoSu. ndaries) with Index of Multiple
Deprivation (IMD) scores using ‘categorised’ symbology in QGIS.
2.4.1. Landscape and Environmental Metrics
2.4. Spatial and Statistical Analyses
OS Open Greenspace
To facilitate quantitative analysis and maximise UK-wide representation, the aim was to acquire
n = 3T6o7 rdeestpeornmsiensefrwomheGthPesr bthaseedproenseannceap(apnrodxicmouatnet)poopf uglraeteionnspsaizcees(owf iUthKinG(Panpdractotiucecsh)inogf ,80i.0e0.,
g[5r7e]e,nwspitahceas 9p5a%rtiaClloynifnidtehnecbeuLffeevrezloannedwaer5e%inMcluardgeidn) oafcEerrtraoirn. rFaodriuNsBoOf Gs,Pthseuragiemriews awsatsoaascsqouciiarteeda
wsaimthpglereseinzeporef sncr=ibi2n5g1.pTrohvisiswioans, bthaeseOdSoOn ptehne Gn r=ee7n1s4parecesudltastafsroetmanthdethweebg-esocrreafpeere, nwcietdh bain9a5r%y
rCeosnpfoindseenscfeoLr eQvueel satniodna35w%eMreaimrgpinorotfedErirnotro. QGIS. The greenspace polygons within each buffer zone
(50 m, 100 m, 250 m, 500 m, 1 km and 5 km) were extracted and counted using vector data management
tools. The joined data were then exported to a .csv file for subsequent statistical analysis in the R
statistical computing environment via the R Studio interface version 1.2.1335.
Due to the nonnormal (right skew) distribution of the samples, nonparametric statistical tests
were selected. A Mann–Whitney U test was conducted to explore differences between the number of
greenspaces within 100 and 250 m of the GP surgeries that provided green prescribing vs. GP surgeries
that did not provide them (500 m and 1 km radii were excluded due to no relationships for these
ranges, and the 50 m buffer was excluded due to an absence of greenspaces within this radius).
NDVI
For the NDVI analysis, firstly we reprojected the vector (buffer) layers to match the coordinate
reference system (CRS) of the Landsat 8 raster files and then calculated the mean NDVI values for all
buffer zones using the zonal statistics raster analysis tool (Figure 4). The updated attribute table was
exported as a .csv file for subsequent statistical analysis.
Int. J. Environ. Res. Public Health 2020, 17, 3460
Int. J. Environ. Res. Public Health 2020, 17, x
7 of 24
8 of 25
FFiigguurree44.. EExxaammppllee ooff bbuuffffeerr zzoonneess aarroouunndd GGPP ssuurrggeerriieess wwiitthhaavviissuuaallrreepprreesseennttaattiioonnoofftthheeNNoorrmmaalliisseedd
DDiiffffeerreenncceeVeVgeegteattaiotinonIndInedxe(xND(NVDI)V. TI)h.eTmheeanmveaalnuevsawluiethsinwtihtheisne bthueffseersbwuaffsecraslcwualastecdalacnudlaetexdpoarntedd
feoxrpfourrttehderfoarnfaulyrtshise.r Tanhaelywshiso. lTehoef wthheoUleKofwtahse oUvKerlwaiads wovitehrlathide wNiAthSAtheLaNnAdsSaAt 8Latinledssatot 8fatcilielistattoe
NfaDciVliItactaelcNuDlaVtiIocnasl.culations.
2.4.2O. Dnecpertihveatmioenan NDVI scores were calculated, a binomial logistic regression model was used to
prediFctorwthheethaenralmyseiasnoNf dDeVpIri(vaatrieopnr,eUseKntqatuioinntiolef sgcroereensnfersosm) in1 e(laocwhebsut ffdeerprziovnaetiohna)dtoa s5ig(hniigfihceasntt
idneflpureivnacteioonv)erwtehree beixntararcyteddepfreonmdetnhtevaadrjiuasbtleed(wIMhDered1at=as“eYt.eTs”hetsoersecporreessenwtetrheejoGinPesdthtaotedaochpLroSvOidAe
naantdurdea-btaaszeodnienatenrdveunsteiodnfso;rasnudbs0e=qu“eNnto”antaolyresipsr.eTsoenetxtphleorGePwshthetahtedr odenportivpartoivonideinnflauteunrcee-bdatsheed
ipnrteorvviseinotnioonfsn).ature-based interventions, Mann–Whitney U tests were conducted. This approach was
2s.u4i.2ta. bDleepforirvcaotimonparing IMD scores between the four variables (GPs that did and did not prescribe
GRx; and NBOs who did and did not provide GRx).
FToor ttehset awnhaelythseisr oafrdeleaptrioivnasthiiopn,exUisKteqdubinettiwleeesncolreevseflrsoomf d1e(ploriwvaetsitodneapnrdivaNtiBoOn)ptroes5en(hcieg,hweset
djoeipnreivdatthioenw) webe-rsecreaxptreacrteesdulftrsomforthNeBaOdjsuwsteitdhItMheDUdKataIMseDt. Tanhdesbeosuconrdeasrwyedreatjaosinetesd. WtoeeascuhbLseSqOuAenatnlyd
dcaotnadzuocnteedanCdhiuSsqed(Xfo2)rtseusbtssetoqucoenmtpaanraelyesxips.ecTtoedexvpsl.oarcetuwahl eotbhseerrdvaeptiroinvsa.tiTohnisinteflsutepnrcoevdidthede pwrhoavtistihoen
opfrnoabtaubriel-itbyaswedasintthearvt ednitfifoenrse,nMceasninn–Wvahliutnesey(fUretqeustesnwcyeroefcoonbdseurcvtaetdio. nTsh)isaareppbryoacchhawncaes suunitdaebrlethfoer
caosmsupmarpintigonIMofDinsdcoerpeesnbdeetnwceee.n the four variables (GPs that did and did not prescribe GRx; and NBOs
who did and did not provide GRx).
2.4.3T. oNtaetsutrwe-hBeatsheedr Oa reglaantiiosantsihoinpPerxeisteendcebeatnwdeGenRlxevPerlosvoisfidoenprivation and NBO presence, we joined
tCFhhoeirwSthWqebi(se-Xsea2cll)resamtopesteeetnsrstetteswoducelwtosemhxfoepptrlahoNrereerBedpOxrtspehesweecintptehcodettehvonseft.NiUaaBlKctOiunIMsacilwdDoaebasnsncaedesrsvoboafoctutiiahontnedesdNa. rwTByhOidtishsatctpaeorssnoetftvpisir.rsmoiWovinneidgoseufGdbGRswRexqhxfuabatecyntilhGtiletyPaptcsiroouonnrbgda(eufbrrciiolteimestdy.
wthaesqtuheasttidoinffneariernecreesspinonvsaeslu) easnd(farelsqoudeantcayfroofmobthseerwveabti-osncrsa)paereofbNyBcOhsa(nnce= 7u1n4d).eWr tehueseadssauMmpantino–n
oWf ihnidtneepyenUdteensctea.nd a 2-sample test for equality of proportions.
2.4.3. Nature-Based Organisation Presence and GRx Provision
3. Results
We also tested whether presence of NBOs was associated with provision of GRx by GP surgeries.
F3o.1r. tDheisscreilpetmiveenStawtiseticesxplored the potential incidence of the NBOs confirming GRx facilitation
(fromAthteoqtauleostfionnn=ai2r8e4rersepspononsedse)natnsdcoalmsopldeatetadfrthome rtehseeawrcehb-sqcureaspteioonfnNaiBreO. sT(hne=n7u1m4)b. eWr eouf sGedPsa
Mpaarntinc–ipWahtiintngeiynUthteessttuanddy aw2a-ssanm=p1le14te(sftrfoomr enqu=a2li1t1y oCfCpGrospaonrdtionn=s. 625 individual practices). The
Confidence Level and Margin of Error for this sample size are 95% and 9%, respectively. For NBOs
(from n = 714 identified by the manual web-scrape), a total of n = 170 responded. The Confidence
Level and Margin of Error for this sample size are 95% and 6.6%, respectively. The majority of
responses came from England-based practices and organisations.
Int. J. Environ. Res. Public Health 2020, 17, 3460
8 of 24
3. Results
3.1. Descriptive Statistics
A total of n = 284 respondents completed the research questionnaire. The number of GPs
participating in the study was n = 114 (from n = 211 CCGs and n = 625 individual practices).
The Confidence Level and Margin of Error for this sample size are 95% and 9%, respectively. For NBOs
(from n = 714 identified by the manual web-scrape), a total of n = 170 responded. The Confidence Level
and Margin of Error for this sample size are 95% and 6.6%, respectively. The majority of responses
caInmt. Je. Efnrvoirmon.ERnesg. Plaubnlidc H-beaaltshe2d02p0,r1a7,cxtices and organisations.
9 of 25
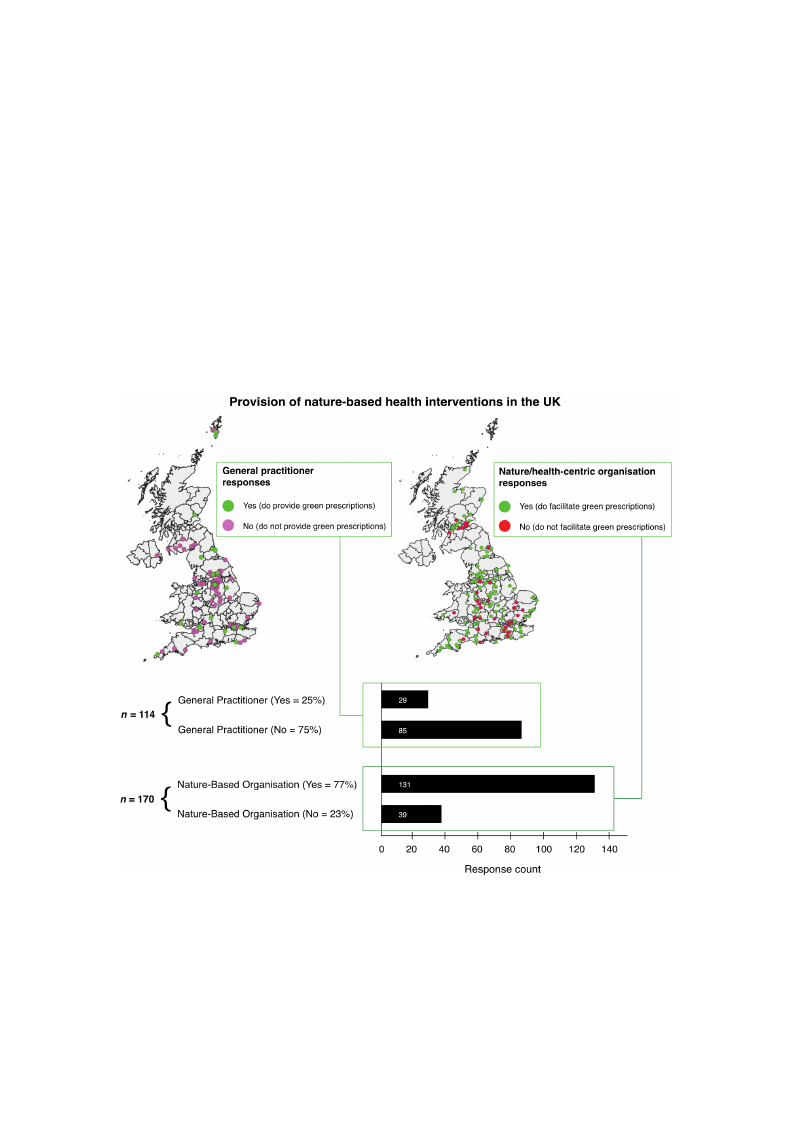
3.31.1.1.1. .RReessuullttss ffrroommththeeQQueusetisotinonnaniraei(rPer(ePserenscee/nAcbes/AenbcseeonfcGeroefenGPrereesncrPipretisocnriPprtoivoinsiPonro) vision)
BBaasseedd oonn tthheeccoouunnt tofofquqeusetisotnionnainreairreespreosnpseosnbsyesGbPys,GnP=s,29nG=P2s9dGidPpsredsicdribperensactruirbee-bnaasetdure-based
inaintcetteirvrvvieteinenstti)ioonnnasstuaarnned-dbnans=e=d858in5GtGePrsPvdesniddtiinodnonts.oaIntn.dtIennrm=tes3r9omfdsNidoBfnOoNtrBe(FsOpigorunersseep5so,).nns=es1,31n d=id13p1rodviiddep(rio.ev.,ifdaeci(liit.aet.e, facilitate
activities) nature-based interventions and n = 39 did not (Figure 5).
Figure 5. Provision of nature-based health interventions (green prescriptions) in the UK based on the
qFuiegsutrieon5.nPariorveirseiosnpofnnsaetsu. rTe-hbiassfiedguhreealsthhoinwtesrvthenetlioncsat(igorneeannpdredsicsrtipritbiountsio) innothf ereUsKpobnaseeds toon tthe question
“DquoeesstiyoonunraGirPe rseusrpgoenrysepsr.oTvhidisefgigrueerne pshreoswcrsipthtieonlosc?a”ti(oonraansdimdiisltarribquutieosntioofnrefospronnasteusrteo-bthaeseqdueosrtgioannisations).
“Does your GP surgery provide green prescriptions?” (or a similar question for nature-based
3.1.2. oRrgeasnuilstastiofrnos)m. the Coding of the Perceived Constraints Question (for GPs)
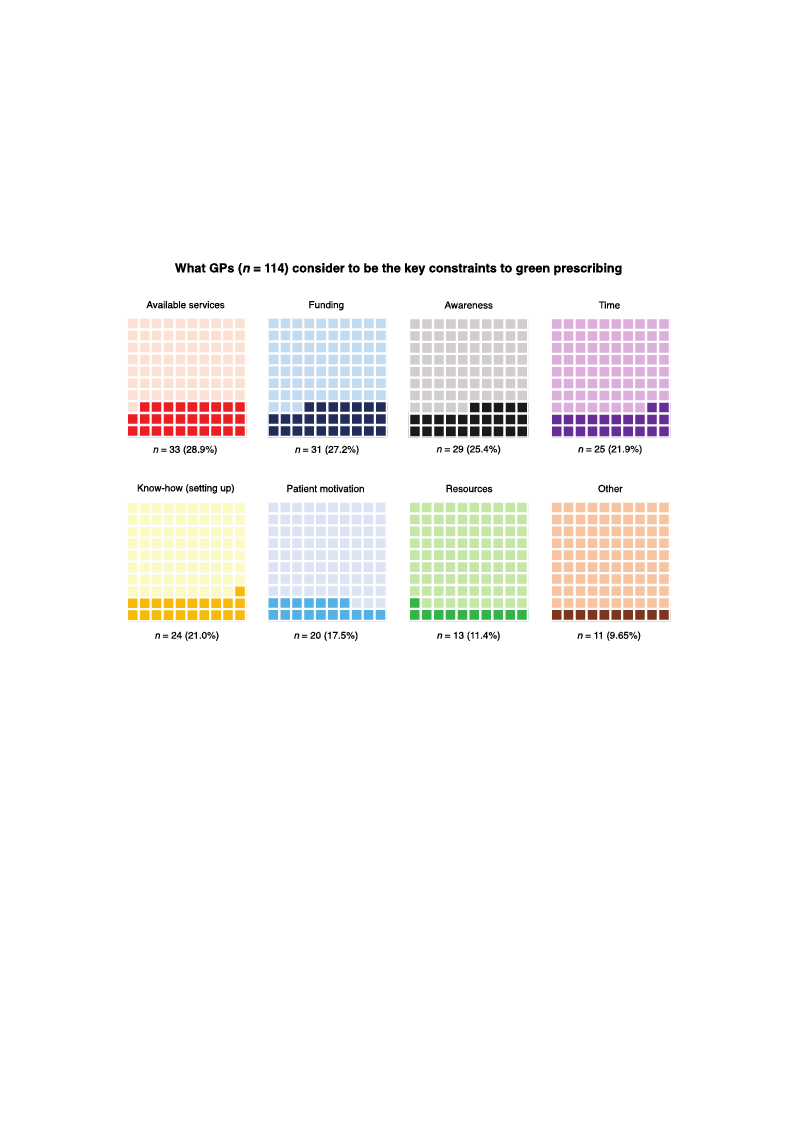
3.1.2T. hReesruelstsuflrtsomoftthheeCaondainlygsoisf tohfewPehracteiGvePds CpoenrcsteriavientassQkueeystcioonn(sftorraGinPtss)to green prescribing showed
that ‘available services’ (organisations and processes that facilitate nature-based interventions) was
mentiTohneerdestuhletsmofotshtefraenqaulyesnistloyf wbyhaGt PGsP(snp=erc3e3iv).eFaus nkedyincgonfsotrratihnetssteorgvrieceenapnrdesacwribairnegnsehsoswoefdthe green
that ‘available services’ (organisations and processes that facilitate nature-based interventions) was
mentioned the most frequently by GPs (n = 33). Funding for the service and awareness of the green
prescribing concept were also frequently mentioned (n = 31 and n = 29, respectively). However, we
are unable to confirm whether ‘awareness’ refers to GPs, patients or both.
Time constraints (n = 25) (note: there is an assumption here that this refers to GP time), ‘know-
how’ (i.e., knowledge of how to set up a green prescribing service) (n = 24), patient motivation (and
Int. J. Environ. Res. Public Health 2020, 17, 3460
9 of 24
prescribing concept were also frequently mentioned (n = 31 and n = 29, respectively). However, we are
unable to confirm whether ‘awareness’ refers to GPs, patients or both.
Int. J. TEinmvireonc.oRness.trPauibnlitcsH(enal=th22502)0(,n1o7,tex: there is an assumption here that this refers to GP time), ‘know1-0hoofw25’
(i.e., knowledge of how to set up a green prescribing service) (n = 24), patient motivation (and
cgorneefindepnrceesctroibaitntgensdertvhiecein(ttehrivs ecnotuioldnso)v(enrl=ap20s)o, manedwhhaavt iwngiththteimapeparnodprfiuantedirnegso) u(nrce=s1t3o) pwroerveidaelsao
gmreeenntiopnreesdcrbiybisnegvesrearlvGicPes(t(hFiisgucoreu6ld). overlap somewhat with time and funding) (n = 13) were also
mentioned by several GPs (Figure 6).
Figure 6. Waffle charts showing what GPs consider to be the key constraints to green prescribing.
TFhigeuserech6a. rWtsasfhfloewchparrotsposhrtoiwonins gwwithaatcGtuPasl rceosnpsoidnesre tcooubnettshaenkdeycocrorenssptroanindtisngtopgerrecentpagreesscrbieblionwg.
TThheesperochpaorrttsiosnhsowareprporpeosretniotends winitdheascetunadlinregspoordnseer c(io.eu.n, tosfarnedspcoonrrseespfroenqduienngcyp)erfcreonmtatgoeps bleefltowto.
bTohtetopmrorpigohrtti.ons are presented in descending order (i.e., of response frequency) from top left to bottom
right.
3.1.3. Results from the Coding of the Perceived Constraints Question (for Nature-Based Organisations)
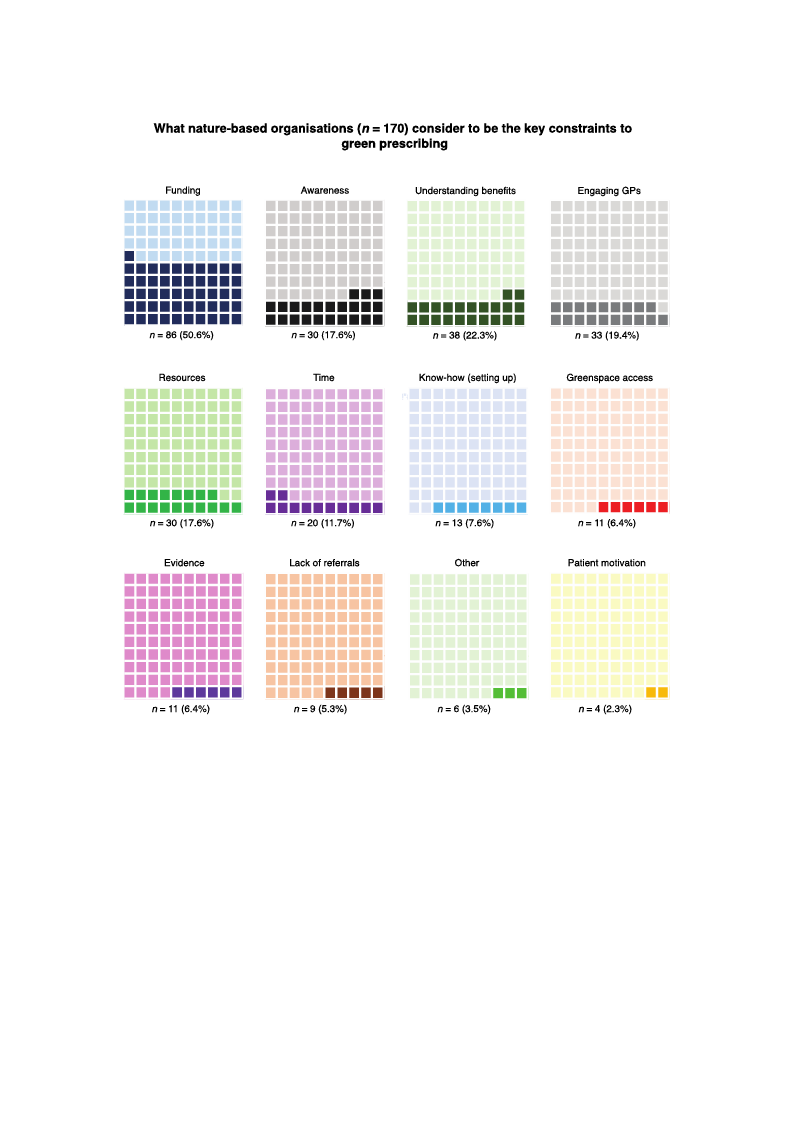
3.1.3T. Rhesruelstuslftrsoomf tthheeaCnoadlyisnigs of wthheaPt eNrcBeOivsepdeCrcoenivsetraasinktesyQcuoenssttiroanin(tfsotroNgarteuernep-Breascerdibing showed
tOhragt afuninsdatiniogn(si).e., the organisations typically have small financial budgets) was the most frequently
mentiTohneedrecsounltsstroafinthte(nan=a8ly6s).isAowf awrhenaet sNsBaOnds upnerdceerisvteanads iknegyocfotnhsetrbaeinnetsfittos ogfrespenenpdriensgcrtiibmineginshnoawtuerde
wtheartefaulnsodicnognv(ie.ey.e, dthaesoimrgpanoristaantitocnosntsytpraicinaltlsyshevaevreasl mtimalel sfibnyanNcBiaOl sbu(ndg=e3ts0)awnadsnth=e3m8,orsetsfpreecqtuiveenltyly).
Imt iesnltikioenlyedthcaot nthsetrsaeincot n(sntr=ai8n6ts).aArewaaimreendesast GanPds aunnddpeorstetanntidailnlygaolsfotpheatibeenntsefaitssthoef rsepsepnodnisnegs stuimggeeisnt
tnhaattu, rine gweenreeraall,sNo BcOonsvaeryeeadwaasreiomfpthoertpanottecnotinasltbraeinnetfis tsse. veral times by NBOs (n = 30 and n = 38,
respeDcitsivtienlcyt)i.vIetlyisNliBkOel-ybathseadt tthheesmeecsoinnsctlruadinetds eanregaagiminegdGaPtsG(nPs=a3n3d) (psoomtenetrieasllpyoanldseonptsatsiuegngtsesatsitthise
dreiffispcounltsetos s“uegnggeasgteththaet,NinHgSenateraalll,lNevBeOlss, aanred adwisasreemoifntahtienpgoitnefnotrimalabteionneftihtsr.ough the NHS can [also]
be diffiDicsutilnt”c,tiavnedlyGNPBsOa-rbea“snedottahbelme eosr iwncillluindgedtoenggreaegninpgreGsPcrsib(ne”=),3g3r)e(esnosmpeacreesapcocnesdse(nnts=su11g)g(ees.tgi.t,
liasnddioffwicnueltr tpoer“menisgsaiogne,tthreanNspHoSrtactoasltls,lebvuetlsa,lsaonsdomdiesspeemoipnlaetianrge “inhfooursmeabtoiounndth”r)o, ugrgehenthpereNscHriSbicnagn
‘[raelfseorr]ablse’dwifhfiicchulct”o,ualdndbeGsPysnaorney“mnoout sabwleithorenwgiallgininggtoGgPrse(enn=p9re),sacrnidbe‘”e)v,idgreenecnes’ptoacseuapcpcoerstsb(enn=efi1t1s)
o(ef.ggr.,eelnanpdroeswcrniebrinpge(rnm=is1s1io) n(s,otmraenrsepsoprotncdoesnttss, fbeueltthaelsroe issosmtilel npoetoapsletroanrge e“nhoouugshe ebvoiduenndc”e),bagsreeeton
pperressucaridbeinhgea‘rltehfeprrroalfse’sswiohniachls ctoouelndgabgeesiynntohneyimntoeruvsenwtiitohnse)n(gFaigguinrge 7G).Ps (n = 9), and ‘evidence’ to
support benefits of green prescribing (n = 11) (some respondents feel there is still not a strong enough
evidence base to persuade health professionals to engage in the interventions) (Figure 7).
IInntt..JJ..EEnnvviriroonn..RReess. .PPuublbilcicHHeaelatlhth22002200, ,1177, ,x3460
1110ooff2254
Figure 7. Waffle charts showing what nature-based organisations consider to be the key constraints
Ftoiggurreee7n.pWreasfcfrleibcinhgar.tTs hsehsoewcihnagrtws hshaot wnapturorep-obratsioednsowrgiathniascattuioanl srecsopnosnidseercotounbtestahnedkceoyrcreosnpsotrnadinintsg
tpoegrcreeenntapgreessbcreilboiwng. .TThheepserocphoarrttsiosnhsoawrepprorepsoerntitoendsinwditehsaccetnudailnrgesoprodnesre(ic.eo.u, notfsraenspdocnosrerefsrepqounednincyg)
pfreormcentotapgleesftbteolobwot.tTomherpigrhotp.ortions are presented in descending order (i.e., of response frequency)
3.1.4f.rRomestuolptsleffrtotmo btohtetoWmerbig-Shct.rape Process (for Nature-Based Organisations)
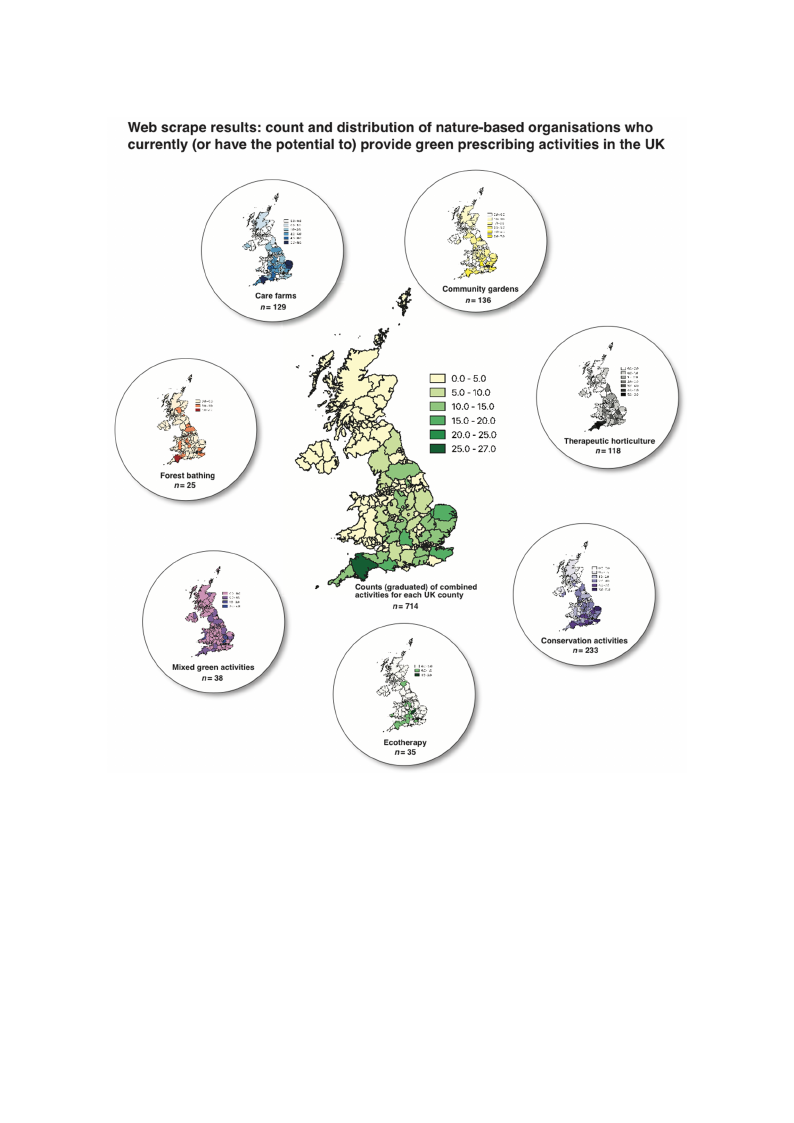
3.1.4.TRheesuwltesbf-rsocrmaptehereWsueltbe-dScinratpheeParcoqcueissisti(ofonroNf nat=ur7e1-4BNasBeOd sOwrghaoneisitahteiornpsr)ovided green prescribing
activities or had the potential to do so based primarily on organisation/service type. These fall into
seveTnhthe ewmeebs-isnccrlaupdeinrgescualrteedfarimn sth(ne =ac1q2u9)i,sictoiomnmoufninty=ga7r1d4enNsB(nO=s 1w3h6o), tehiethraepr epurtoicvhidoerdticugrlteuerne
p(nre=sc1r1ib8i)n, gcoanctsievrivtiaetsioonr hacatdivthiteiepso(tnen=ti2a3l3t)o, decoostohebraaspedy p(nri=m3a5ri)l,ymoinxeodrggarneiesnataiocnti/vsietrievsic(esutycphea. sTbhuesseh
fcarlal fitnstaondsewveanlktsh; enm=e3s8i)n, calnuddifnogresctabreatfhairnmgs(n(n==251)2(9F)i,gcuorme 8m).unity gardens (n = 136), therapeutic
horticulture (n = 118), conservation activities (n = 233), ecotherapy (n = 35), mixed green activities
(such as bush crafts and walks; n = 38), and forest bathing (n = 25) (Figure 8).
IInntt..JJ..EEnnvviriroonn..RReess. .PPuubblilcicHHeaelatlhth22002200, ,1177, ,x3460
1121ooff2254
Figure 8. UK map of counties showing count (n = 714) and distribution of nature-based organisations
Fwighuicrhe 8c.uUrrKenmtlyap(oorf choauvnetitehsesphootwenintigalcotou)npt r(onv=id7e14g)raenedn dpirsetsrcibriubtiinogn oacf tnivaittuieres-(biansleedtsosrhgoawniscaotuionntss/
wdihsitcrhibuctuiorrnenfotlry in(odrivihdauvael athcteivpitoietse)n.tiaTlhetoq)upanrotivtaidtievegdreieffnerepnrceesscriinbinvagluaecstiavrietiepsre(siennlettesd suhsoinwg
cgoruandtusa/dteisdtrsiybmutbioonlogfoyrainnddiavnidaupaplroapctriivaitteiecso)l.oTuhreraqmupa.ntTithaitsivweasdipffreorceenscseeds iinn QvaGluISe.s are presented
using graduated symbology and an appropriate colour ramp. This was processed in QGIS.
Conservation activities/organisations returned the highest number of records (n = 233) and forest
bathCinogntsheervlaotwioenstac(ntiv=it2ie5s)/.oTrghaenreisaarteiocnlsearertduirffneerdenthceeshbigehtwesetennutmhebenruomf rbeecroordf sa(dnv=er2t3is3e)danNdBfOorsesint
bEantghlianngdth(ie.el.o, mweosrte (anbu=n2d5a).nTt)hceorme apraerecdletaor NdiofrfethreenrnceIsreblaentwd,eeSncotthlaennduamndbeWr aolfeas.dZveerrtoisreedcoNrdBsOwseirne
Erentgulrannedd(fio.er.,smevoerrealaUbuKncdoaunntt)iecsom(e.pga.,rKedintcoaNrdoinrtehsehrinreIirnelSacnodtl,aSncdo)t,lawnhdearenads Wn =al2e7s.rZeceorordrse(ctohredhsiwgheerset
rneutumrnbeedr) wfoerreserveeturarlneUdKfocroDunevtioens (ine.gth.,eKsoinuctahrwdienset sohfiErenginlanSdco. tland), whereas n = 27 records (the
highest number) were returned for Devon in the southwest of England.
3.2. Results from Spatial and Inferential Statistical Analyses
The following section presents the results from both the spatial analyses conducted in QGIS
using landscape/environmental and sociological (deprivation) datasets and the statistical analyses
cIanrtr. iJe. dEnoviurotnp. Rriems. aPruibllyiciHneatlhthe2R02s0t,a1t7i,s3t4ic60al computing environment.
12 of 24
3.2.1. Landscape and Environmental Metrics
3.2. Results from Spatial and Inferential Statistical Analyses
The data for greenspace presence within different buffer zones around GP surgeries were found
to havTehneofnonlloorwmianlg(rsiegchtitosnkepwre)sdenisttsritbhuetrioesnusl.tTshfreormefobroet,hnothnepsapraamtiaeltraincatleysstseswceorneduuscetdedfoirnsQtaGtiIsSticuasling
alnaanldyscisa.pWe/encvoinrdouncmteedntaalWanildcosxoocniorlaongkicsaul m(detepsrtivwaittihonc)odnatitnauseittys caonrdretchteiosntaatnisdticfoaluanndatlhyaset smceaarnried
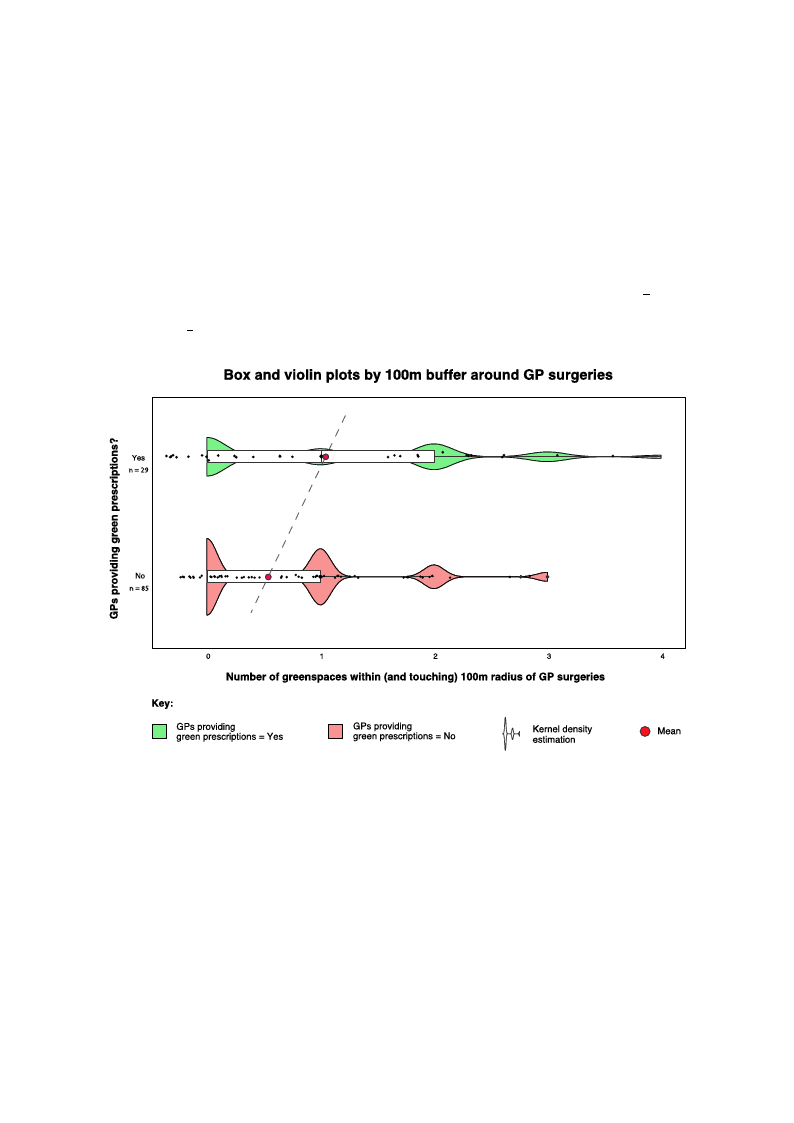
gorueetnpsrpimacaerailbyuinndtahnecRe wstiatthiisntic1a0l0cmomofpgurtoinugpe1n(vGiProsnpmreesnctr.ibing nature-based interventions; x̄ = 1.17)
was significantly different (greater) to the same radius for group 2 (GPs not prescribing nature-based
in3.t2e.r1v.eLnatinodnssc; axp̄ =e0a.n51d)E(Wnv=iro85n3m, pen=ta0l.0M05e)tr(iFcisgure 9).
ATh2-esadmatpalefotresgtrfeoernesqpuacaelitpyreosfepnrcoepworittihoinnsdailffsoerceonntfbirumffeedr zthoanteas gareoautnerdpGroPpsourrtgioenrioesf GwPesrewfhouond
ptroeshcarvibeendonnantourrme-abla(sreigdhitnstekrevwe)ndtiiosntrsibhuatdioangs.reTehnesrpeafocerep, nreosnepnat rwamitheitnric(intecsltusdwinegrepuasretidalfoinrtsetrasteicstt)ical
1a0n0amlysriasd. iWuse (c1o7noduutcotefd29a W oril5c8o.6x8o%n)racnomk psuamredtetsot twhiotshecwonhtoinduiidtyncootr(r3e1ctoiount oafnd85foourn3d6.t4h%a)t (mXe- an
sgqrueaernesdp=ac5e.0a5b,udnfd=a1n,cpe=w0i.t0h4i7n).1T00hemsaomf geraonuaply1si(sGbPustpfroersgcrriebeinnsgpnacaetus rfeu-lblyaswedithinintetrhveen10ti0onms;rxad=iu1s.17)
bwufafsersi(g6noifiuctaonftl2y9doirffe2r0e.6n8t%(g)rceoamtepr)atroedthteostahmoseerwadhiousdfiodrngortou(4po2u(tGoPf s8n5ootrp3r.e4s%cr)ibalisnogrneastuultreed-biansed
sitnattiesrtviceanltliyosnisg;nxif=ica0n.5t1d)i(fWfer=en8c5e3s,(pX-=sq0u.0a0r5e)d(=Fi5g.u05re, d9f).= 1, p = 0.02).
Figure 9. Boxplot showing differences in greenspace abundance within the 100 m buffer zone around
FGigPurseur9g. eBroiexspltohtasthdoiwd i(nggredeinff)earenndcedsidinngorte(ernesdp)apcreeasbcruinbdeannacteuwrei-tbhainsetdhein1t0e0rvmenbtuioffnesr. zTohnee maraoxuinmdum
GnPusmubrgererwieisththinat1d00idm(gorfeeann)yapnrdacdtiidcenwota(srend=) p4.reTshcreibveionliantuprleo-tbsasshedowinkteerrvneenltdioennss.itTyheesmtimaxaitmiounm, i.e.,
nruemprbeesrenwtiinthginth1e0d0imstroibfuatnioynpsrhaacptieceowf tahsenda=t4a.aTnhdetvhieoplioninptlsothsasvheoawsmkearlnl ealmdoeunnsittyofersatnimdoatmionva, ri.iea.t,ion
re(jpitrteesre)ntotinregdtuhcee odvisetrr-ipbulottiotinngs.hape of the data and the points have a small amount of random
variation (jitter) to reduce over-plotting.
A 2-sample test for equality of proportions also confirmed that a greater proportion of GPs who
presTcrhiebetydpneastoufreg-rbeaesnesdpaincetewrviethnitniotnhseh1a0d0 amgbreuefnfesrpsaacreepprreesseennttewditbheinlo(winicnluTdaibnlge p1a. rWtiaelfiunrttehresrect)
e1x0p0lomredrathdeiu‘tsyp(1e7’ oofugtreoefn2sp9aocers5a8r.o6u8%nd) tchoism1p0a0rmedratodituhsoasnedwuhseoddGidoongolet S(t3r1eeot uVtieowf (8G5SoVr) 3as6.a4%)
m(Xa-nsuqaulacroendfi=rm5.a0t5io, ndfto=ol1.,Fpol=lo0w.0in4g7)G. STVhepusabmlicepaanraklyosrigsabrudtenfoarngarleyesinss,pitawceassfaulslloydwisictohvinertehdet1h0a0t m
radius buffer (6 out of 29 or 20.68%) compared to those who did not (4 out of 85 or 3.4%) also resulted
in statistically significant differences (X-squared = 5.05, df = 1, p = 0.02).
The types of greenspace within the 100 m buffers are presented below in Table 1. We further
explored the ‘type’ of greenspaces around this 100 m radius and used Google Street View (GSV) as a
manual confirmation tool. Following GSV public park or garden analysis, it was also discovered that
Int. J. Environ. Res. Public Health 2020, 17, 3460
13 of 24
in four of the 100 m buffers for GPs that did prescribe GRx, there were additional large greenspaces
(public parks, n = 2; sports field, n = 1, and scrub/grassland, n = 1) not registered in the OS Open
Greenspace dataset, and only one additional greenspace (sports field, n = 1) within 100 m of GPs that
did not prescribe GRx (highlighted with asterisks). These additional greenspaces were included in the
aforementioned analysis.
A 2-sample test for equality of proportions confirmed that in terms of greenspace presence within
a 250 m radius of GPs who prescribed nature-based interventions (23 out of 29 or 79.3%) compared to
those who did not (69 out of 85 or 81.1%), there was no significant difference (X-squared = 1.78 × 10⁻³⁰,
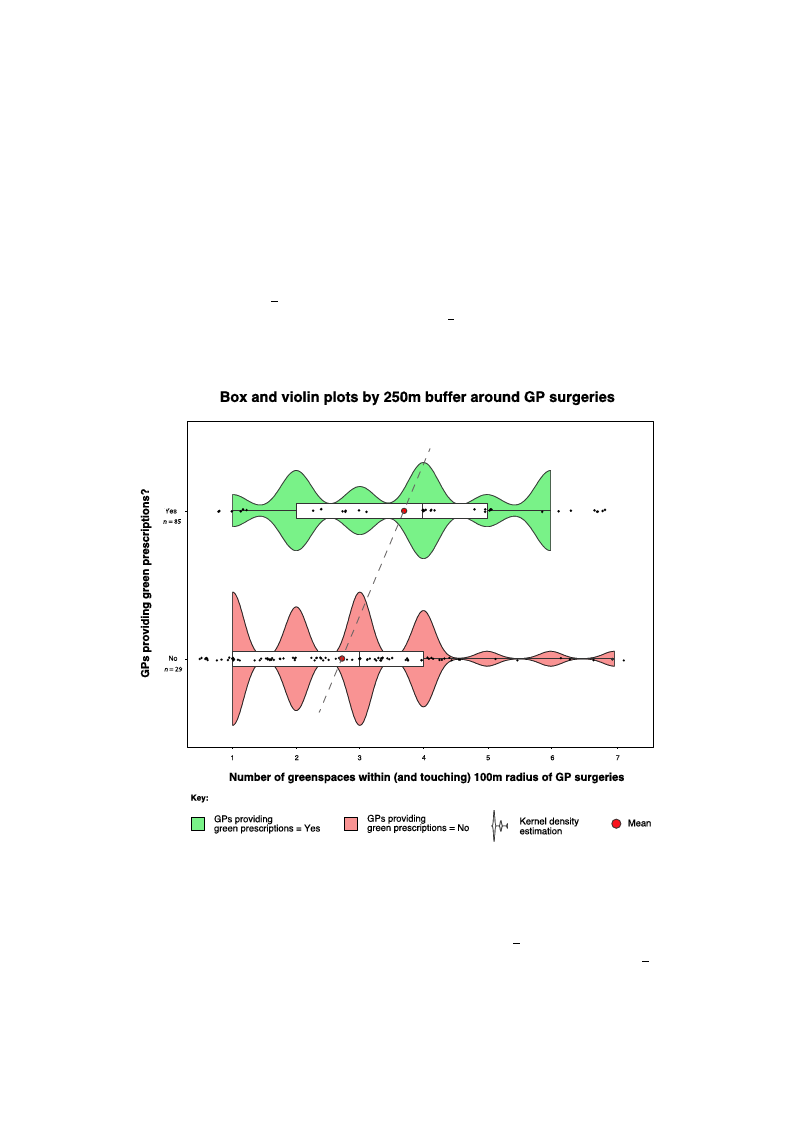
df = 1, p = 1). However, we conducted the Wilcoxon rank sum test with continuity correction on the
250 m buffer and found that mean greenspace abundance within 250 m of group 1 (GPs prescribing
nature-based interventions; x = 3.69) was significantly different (greater) from the same radius for
group 2 (GPs not prescribing nature-based interventions; x = 2.74) (W = 524, p = 0.013) (Figure 10).
Table 2 shows the abundance of greenspaces for all buffer radii between 100 m and 5000 m around
GInPt. sJ.uErngveirroine.sR. es. Public Health 2020, 17, x
15 of 25
FFigiguurree1100. .BBooxxaannddvviioolliinnpplloottsshhoowwiinnggddiiffffeerreenncceessininggrreeeennssppaacceeaabbuunnddaanncceewwiitthhiinntthhee225500mmbbuufffeferr
zzoonneeaarorouunnddGGPPssuurgrgeerireiessththaat tddidid(g(grereenen) )aannddddididnnoot t(r(erded) )pprersecsrcirbiebenantauturer-eb-absaesdedinitnetrevrevnetniotinosn.s.
ITnaitbialel 2in. Gdirceaetnisopnascesuabgugnedsatendcetfhoar talgl rbeuefnfesrpraacdeiiabbeutwnedeann1c0e0 wmaasnhdi5ghkemr (f5o0rmtheexcrleumdeadindiunegtoradii.
Howedvaetar,dtehfeicsieenfcayil)eadrotuonrdeGacPhsustragteirsiteisc.al significance. For example, greenspace abundance within
5 km of the GP surgeries that prescribed nature-based interventions ( x = 280) was higher compared
to areas (Rwaidtihuisn 5 km) wherTeoGtaPl Gsrueregnesrpiaecseds id not pMreeasncribe nMateudriea-nbased inStetarnvdenartdioDnesv(iaxti=on234).
Howe1v0e0rm, foGllRoxwYinesg a Wilcoxon rank3s4um test with con1ti.n17uity correc1tion, these failed to r1e.1a2ch statistical
signifi1c0a0nmceG(RWx =No1044, p = 0.22). 85
0.51
0
0.81
250 m GRx Yes
85
3.69
4
1.66
250 m GRx No
188
2.72
3
1.49
500 m GRx Yes
239
8.24
8
3.80
500 m GRx No
554
6.50
6
3.50
1000 m GRx Yes
602
20.70
21
11
1000 m GRx No
1669
19.60
19
9
5000 m GRx Yes
8120
280.00
297
210
Int. J. Environ. Res. Public Health 2020, 17, 3460
14 of 24
Table 1. A list of greenspace type within a 100 m buffer radius of GPs that do and do not prescribe GRx.
Type of Greenspace
Number in 100 m of GRx = “Yes” Number in 100 m of GRx = “No”
(n = 29)
(n = 85)
Playing field
5
6
Other sports facility
5
3
Play space
3
6
Cemetery
1
1
Allotment or community garden
3
5
Religious grounds
7
8
Public park or garden
6
10
Bowling green
1
1
Tennis court
1
1
Golf course
0
1
Public park *
2
0
Sports field *
1
1
Grassland/scrub *
1
0
* Additional greenspaces not registered in the OS Open Greenspace dataset.
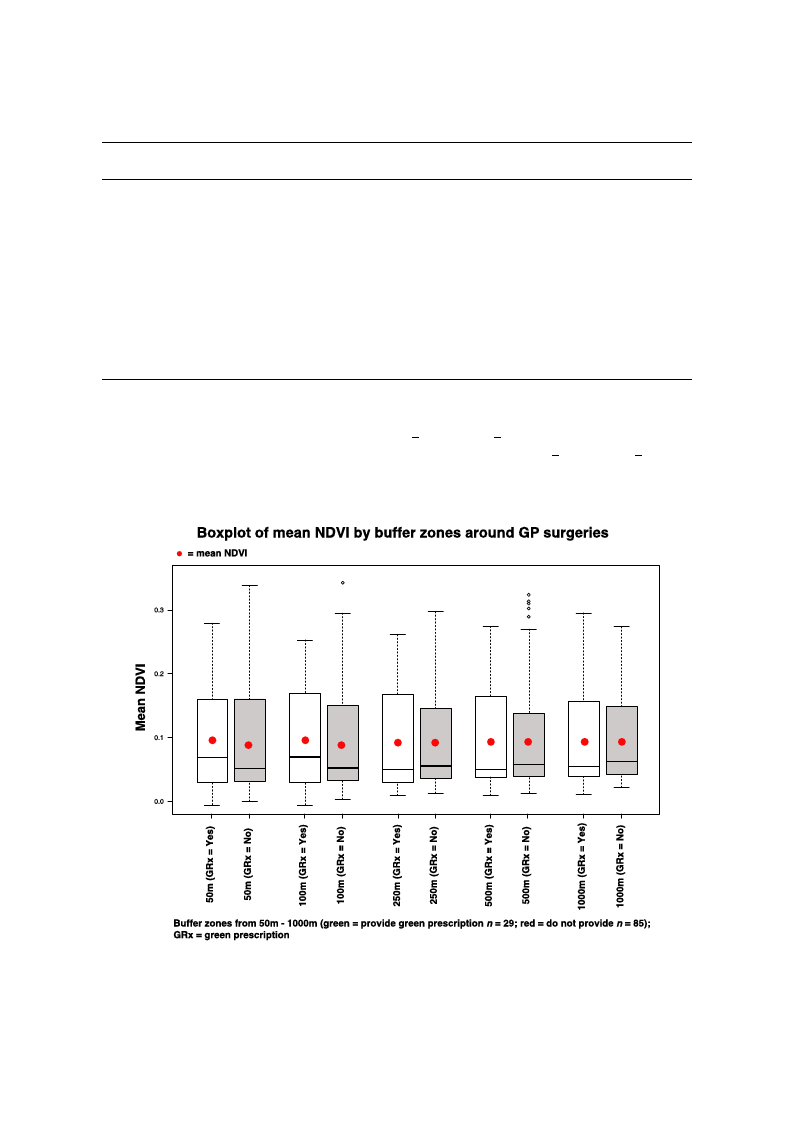
For the NDVI analysis, the mean NDVI values (within 50 and 100 m buffer zones) where GPs
pInrte.sJ.cErinbveirdonn. Raetsu. Preu-bblicaHseedalthin2t0e2r0v, 1e7n, txions were higher ( x = 0.095 and x = 0.098, respectively) comp16aoref d25
to the same radii where GPs did not prescribe nature-based interventions ( x = 0.085 and x = 0.086)
((FFiigguurree1111).).HHoowweevveer,rw, we egegneenreartaetdeda bainboinmoimalialol gloisgtiicstriecgrreegsrseiossniomnomdeoldfoelr ftohrestehepsaerapmareatemrse,tearnsd, athned
dthiffeedreifnfceeresnwceesrewsehroewsnhotwo bnetonobnesnigonnisfiigcanniftic(GanLtM(G, LpM= ,0p.5=390.f5o3r95f0omr 5;0pm=;0p.4=970.f4o9r71f0o0r m10)0. m).
FFiigguurree 1111.. BBooxxpplloottss sshhoowwiinngg mmeeaann NNDDVVII ssccoorreess ffoorr eeaacchh bbuuffffeerr zzoonnee ((5500 mm––11000000 mm)) aarroouunndd GGPP
ssuurrggeerriieesstthhaatteeiitthheerrddiiddpprreessccrribibeennaattuurree-b-baasseeddininteterrvveenntitoionnss(G(GRRxx==YYeess))oorrddididnnoott((GGRRxx== NNoo))..
3.2.2. Deprivation Analyses
Mean IMD scores for areas (LSOAs) where GPs did prescribe GRx (x̄ = 3.58) were higher than
mean IMD scores for areas where GPs did not prescribe GRx (x̄ = 3.18). However, based on the results
of a Wilcoxon rank sum test with continuity correction in R, these were not statistically significant
(W = 1339, p = 0.1703).
When analysing NBOs from the web-scrape (a combination of confirmed and unconfirmed GRx
Int. J. Environ. Res. Public Health 2020, 17, 3460
15 of 24
Table 2. Greenspace abundance for all buffer radii between 100 m and 5 km (50 m excluded due to data
deficiency) around GP surgeries.
Radius
100 m GRx Yes
100 m GRx No
250 m GRx Yes
250 m GRx No
500 m GRx Yes
500 m GRx No
1000 m GRx Yes
1000 m GRx No
5000 m GRx Yes
5000 m GRx No
Total Greenspaces
34
85
85
188
239
554
602
1669
8120
19,936
Mean
1.17
0.51
3.69
2.72
8.24
6.50
20.70
19.60
280.00
234.00
Median
1
0
4
3
8
6
21
19
297
190
Standard Deviation
1.12
0.81
1.66
1.49
3.80
3.50
11
9
210
209
3.2.2. Deprivation Analyses
Mean IMD scores for areas (LSOAs) where GPs did prescribe GRx (x = 3.58) were higher than
mean IMD scores for areas where GPs did not prescribe GRx ( x = 3.18). However, based on the results
of a Wilcoxon rank sum test with continuity correction in R, these were not statistically significant
(W = 1339, p = 0.1703).
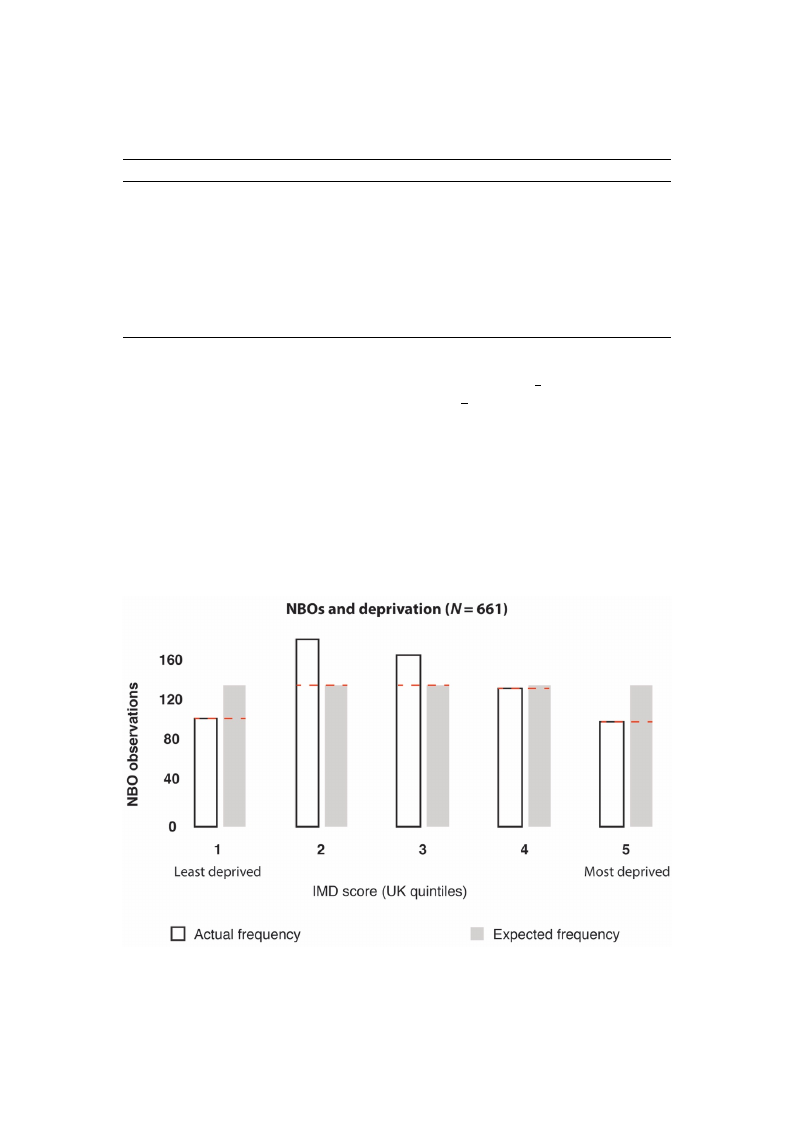
When analysing NBOs from the web-scrape (a combination of confirmed and unconfirmed GRx
providers; n = 714), we found significant differences in the frequency of NBOs between areas with
different levels of deprivation (X2 = 35.36, df = 4, p = 3.71966 × 10⁻⁷) (Figure 12). For sensitivity
analysis, we also converted IMD quintile scores 1 and 2 into a “low” deprivation category, and quintile
scores 4 and 5 into a “high” deprivation category, which confirmed statistically significant differences
(X2 = 4.4, df = 1, p = 0.035) (Figure 13). This test calculated what the probability was that the difference
iInntv. Ja. lEunevisro(nf.reRqesu. Peunbcliyc Hoefaoltbh s2e02r0v,a1t7i,oxns) was by chance under the assumption of independence. 17 of 25
Figure 12. Output of X2 results: The frequencies of nature-based organisations (NBOs) were significantly
dFiiffgeurreent1b2e.twOeuetnpuarteaosf wXi2thrdesiffueltrse:ntTlheeveflsreoqfudeenpcrieivsatoiof nn(abtausreed-boanseUdKoIrMgaDniqsuaitniotinles s(cNorBeOs)s,)wwheerree
1si=gnleifaisctadntelpyrdivieffderaenndt b5e=twmeoesnt adreeparsivweidth. Ndiofftee,renn=t l5e3veNlsBoOf rdeecporridvsactioonnta(binaesdedzeorno UIMKDIMdaDtaq. uintile
scores), where 1 = least deprived and 5 = most deprived. Note, n = 53 NBO records contained zero
IMD data.
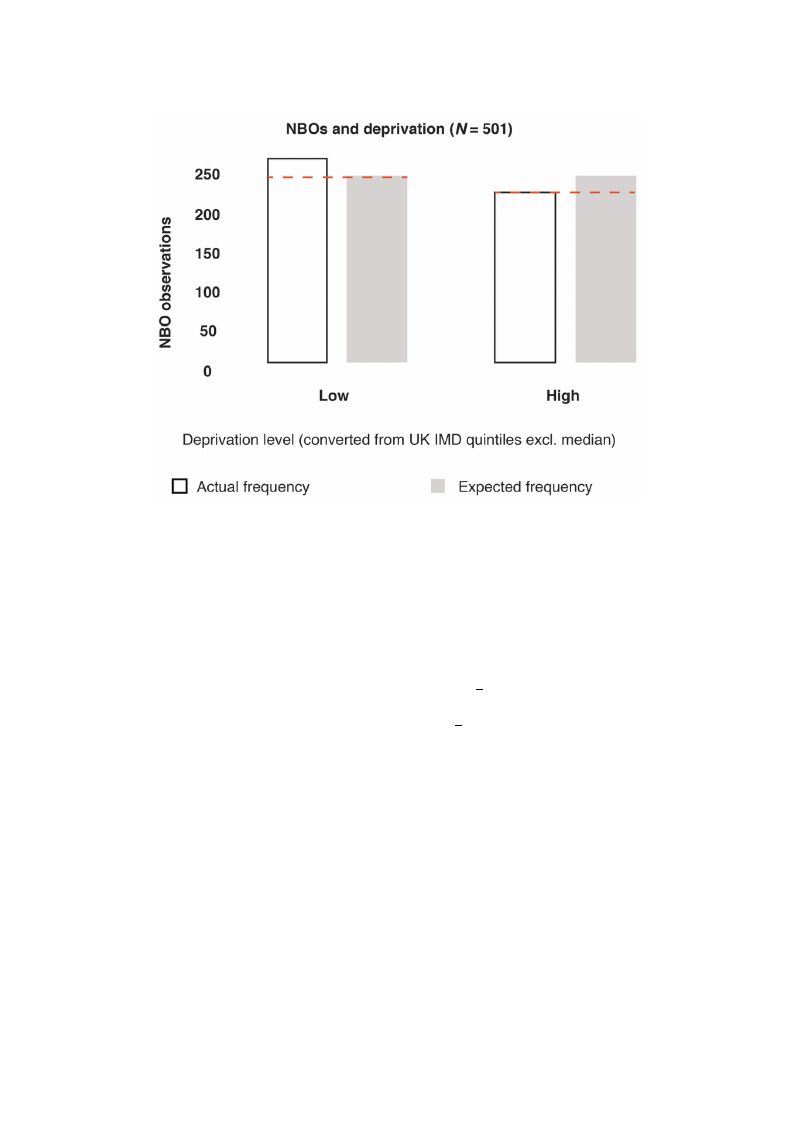
Figure 12. Output of X2 results: The frequencies of nature-based organisations (NBOs) were
significantly different between areas with different levels of deprivation (based on UK IMD quintile
scores), where 1 = least deprived and 5 = most deprived. Note, n = 53 NBO records contained zero
Int. J. EInMviDrond. aRteas. Public Health 2020, 17, 3460
16 of 24
Figure 13. Output of X2 results: the frequencies of NBOs were significantly different between areas
wFiitghulroew13a.nOd uhtipguhtleovf eXls2 orefsduelptsr:ivthaetiofrneq(buaesnecdieosnofcoNnBvOerstiwngerUe KsigIMniDficqauntinlytidleifsfceorerenst ibnettowleoewn-aarnedas
hwigihth-dleopwriavnatdiohnigchatleegvoerliseso)f. deprivation (based on converting UK IMD quintile scores into low- and
high-deprivation categories).
3.2.3. Geographical Presence of NBOs (Confirmed and Unconfirmed GRx Providers)
There were more likely to be NBOs who did provide GRx activities present within 5 km of GP
surgeries that did prescribe nature-based interventions (14 out of 29 or 48.3%) compared to GP surgeries
that did not prescribe nature-based interventions (22 out of 85 or 25.8%). This was confirmed by a
2-sample test for equality of proportions (X-squared = 4.0355, df = 1, p= 0.04455).
When including all NBO records acquired by the web-scrape (a combination of confirmed and
unconfirmed providers; n = 714), the mean number of NBOs ( x = 2.7) within 5 km of GP surgeries
prescribing nature-based interventions (n = 29) was greater than the mean number of NBOs within 5 km
of GP surgeries not prescribing nature-based interventions ( x = 1.7; n = 85). However, this difference
was not statistically significant (W = 1481, p = 0.09187).
4. Discussion
In this study, we aimed to contribute to the growing but still limited knowledge base underlying
green prescribing (i.e., prescribing nature-based health interventions) as a practical service. To this end,
we mapped green prescribing services in the UK, explored spatial and socioecological relationships,
and acquired the views from both GPs (as potential prescribers) and NBOs (as potential providers).
A diverse suite of studies now supports the concept that spending time in nature can improve
one’s health and well-being [58–60], and calls have been made to integrate nature-based and social
prescribing into public health strategies [61–63]. There is also growing advocacy to support holistic
integrative strategies such as green prescribing to enhance planetary health (through co-benefits to
humans and the environment) [38,64,65]. However, there is limited understanding of the current status
of (awareness and distribution), and socioecological relationships and constraints associated with
green prescribing as a practical model of health care. An improved understanding of this could aid the
optimization of management strategies and spur further research to overcome the constraints.

Int. J. Environ. Res. Public Health 2020, 17, 3460
17 of 24
Our study confirms that green prescribing is active in numerous areas of the UK. We mapped some
of the potential prescribers (GPs) and providers (NBOs) and acquired a diverse list of nature-based
activities across the UK via a comprehensive web-scrape. With additional collaborative input, this
latter process could form the basis of an expandable/editable database to allow primary health
care professionals to search for local nature-based organisations and services that could support
their patients.
Our results suggest that GPs and NBOs perceived and expressed some common but also distinct
constraints to green prescribing. Some of the common constraints included a shortfall of funding
and time, and a lack of awareness of the green prescribing concept. The constraint most frequently
expressed by GPs was not funding but the perceived lack of available services (i.e., organisations
to support patients in engaging with interventions). Interestingly, a key constraint expressed by
NBOs was the inability to engage with GPs and other primary care professionals. This disharmonic
perception exemplifies the importance of establishing transdisciplinary collaborative pathways that
are time efficient, and a common vocabulary in the area of green prescribing. Alongside the research
that is needed to gain a greater understanding of the interventions themselves (as evidence may be
lagging behind practice) [66,67], additional action is needed to improve the infrastructure management
required to connect the different stakeholders (e.g., primary and social care, NBOs and patients)
and to establish effective referral and monitoring processes—with personalised approaches in mind.
In the UK, the recent formation of primary care networks (PCNs) (networks of practices that serve
30,000–50,000 patients)—and the provision of funding to employ ‘social prescribers’—could provide
an important opportunity for early integration of green prescribing and could stimulate support for
the additional research that is needed.
It is widely accepted that greenspaces have an important role to play—ecologically and socially—in
supporting personal, community and planetary health [68–71]. Furthermore, greenspaces are a
fundamental resource (e.g., the archetypal setting) for GRx activities [72–75]. The significant association
between greenspace presence and abundance within a 100 and 250 m radius of GP surgeries and
the likelihood of providing green prescriptions was an interesting finding. This prompts a suite of
additional questions such as: does the presence of local greenspaces influence the decisions by the GPs
to prescribe GRx, or the decision by patients to enquire about GRx? Is the presence of greenspaces
an indication of potential GRx activities in the area, and as such, does the availability of services
equate to increased GRx provision and vice versa, i.e., does the lack of available services/infrastructure
equate to limited GRx provision? Another of our findings suggests that significantly more NBOs were
present within 5 km of GP practices that did prescribe GRx. This implies that the presence of available
services could indeed affect the provision of GRx. However, further research is needed to verify this.
Promisingly, collaborative networks involving medical authorities and nature-based organisations are
increasing in presence and activity (e.g., the Centre for Sustainable Health care; www.sustainablehealth
care.org.uk). Providing more support for these kinds of networks at a local scale would likely bring
considerable value.
Other future pertinent questions include does surrounding greenspace influence the decision
of eco-centric GPs (who may be more likely to prescribe GRx) to move to a given practice? Does
the presence of greenspace reflect the socioeconomic status of an area, and does this increase the
likelihood of GRx provision? And what element/s of the greenspace are important (e.g., size, type,
quality, greenness, biodiversity)? We have made an initial contribution towards understanding this
latter point—i.e., our results suggest that greenness (based on mean NDVI calculations for different
buffer radii around GP surgeries) may not be a significant factor. Further research into the quality
of greenspaces may be beneficial and there are several dimensions that could be explored, such as:
maintenance, biodiversity, aesthetics, accessibility and the presence of facilities [52,76–78].
Studies have suggested that less deprived areas have a much higher prevalence of voluntary
organisations than more deprived areas [79,80]. Considering that the majority of NBOs fall into the
voluntary sector category, our results echo these previous studies and support the calls for governments,

Int. J. Environ. Res. Public Health 2020, 17, 3460
18 of 24
local authorities and also the NBOs themselves, to help secure ecological justice and provision of
resources in areas of greatest need.
Nonetheless, it is positive to see the initial indication of no significant differences between provision
of GRx in areas of low and high deprivation—however, the small sample size calls for a cautionary
approach to interpretation. Equitable access to high-quality greenspaces is likely to be important
for personal and planetary health, and should therefore be a primary goal of health-centric urban
policies [81]. If green prescribing is to play a key role in future health care strategies—alongside research
that is needed to personalise these strategies—additional research into infrastructure management
is needed to strengthen transdisciplinary collaborations. Further research into how local greenspace
accessibility and quality may influence GRx would be beneficial, as would research that further
scrutinises the equitable status of GRx resources. It could also prove valuable to explore the professional
development experiences of prescribers and NBOs to identify their backgrounds and motivations—this
could allow for a stronger indication of why and how their GRx strategies become successful.
Limitations
Our study has some important limitations to consider. For example, the relatively small
sample size for the questionnaire element means that our findings should be interpreted with
caution—particularly in the realm of representativeness (for both the significant and nonsignificant
results). Our questionnaires did not reach all of the GP practices in the UK due to ethical and
hierarchical issues, and the lack of a comprehensive list of contacts. Secondly, the results of our study
are correlational and, as such, more conclusive evidence is required to infer causation for any of the
findings. Thirdly, our list of NBOs from the web-scrape process is highly unlikely to be an exhaustive
list of these organisations in practice. The records only represent NBOs that are sufficiently advertised
(with appropriate search engine optimization, e.g., the inclusion of relevant keywords) and have an
active web presence. We were unable to isolate the intended stakeholder for ‘awareness’ category
in the questionnaire (i.e., whether this refers to GP, patients or both). There are several categories in
the questionnaire results for perceived constraints that may have a degree of overlap—for example,
“funding” and “resources” may overlap, as may “engaging GPs” and “lack of referrals”. However,
these were considered to not significantly affect the interpretation the results. “Ecotherapy” is also a
vague category from the web-scrape that could include several the other activities.
5. Conclusions
We have shown that green prescribing is happening in numerous parts of the UK. We created GIS
outputs to highlight (based on the questionnaire results) the distribution of GPs that did prescribe
nature-based interventions and the GPs that did not. We also plotted where NBOs facilitated green
prescribing activities and where they did not, and we provided a comprehensive distribution map
of NBOs (i.e., those with an online presence) via the web-scrape process. Our results suggest that
GPs and NBOs perceive and express some common but also distinct constraints to green prescribing.
Greenspace presence (but not greenness) and abundance within close proximity (100 and 250 m) to
GP surgeries and NBO presence within 5 km were associated with higher levels of green prescribing
provision. Lower levels of deprivation were associated with a higher frequency of NBOs but not with
higher levels of green prescribing provision.
We hope that mapping green prescribing resources, acquiring views from GPs and NBOs, and
conducting spatial/socioecological analyses will spur further research in this area. Establishing
transdisciplinary collaborative pathways and a common vocabulary in the area of green prescribing
would no doubt bring immense value, as would more research on personalised interventions. Action
is needed to improve infrastructure management, particularly strategies that optimize stakeholder
connectivity, referral mechanisms and monitoring processes. Further research into how local greenspace
accessibility and quality may influence green prescribing could also bring value. Green prescribing has

Int. J. Environ. Res. Public Health 2020, 17, 3460
19 of 24
the potential to make an important contribution to personal and planetary health, but more support
and research are needed to initiate, optimize and sustain these strategies.
Author Contributions: Conceptualization, J.M.R. and A.J.; methodology, J.M.R., P.B., and A.J.; software, J.M.R.;
validation, J.M.R. and A.J.; formal analysis, J.M.R. and P.B.; investigation, J.M.R.; resources, J.M.R. and A.J.;
data curation, J.M.R.; writing—original draft preparation, J.M.R.; writing—review and editing, J.M.R., P.B., R.C.
and A.J.; visualization, J.M.R.; supervision, A.J. and R.C.; project administration, J.M.R., A.J. and R.C.; funding
acquisition, J.M.R. and A.J. All authors have read and agreed to the published version of the manuscript.
Funding: J.R. is undertaking a PhD funded by the Economic and Social Research Council (ESRC), grant number:
ES/J500215/1
Conflicts of Interest: The authors declare no conflict of interest. The funders had no role in the design of the
study; in the collection, analyses, or interpretation of data; in the writing of the manuscript, or in the decision to
publish the results.
Appendix A
Int. J. Environ. Res. Public Health 2020, 17, x
21 of 25
Questionnaire for Green Prescribing Research
1. What is the name of your practice, first line of address and postcode?
2. Does your GP practice provide any form of non-medical interventions (e.g. social prescribing)?
Yes - please describe
No
3. Does your GP practice provide Green Prescriptions* (nature-based health interventions)? (see footnote for definition)
3a. If you answered ‘Yes’ to Q3, what kind of activities are prescribed? If you answered ‘No’
- Nature walks
- Conservation volunteering
- Horticulture
- Other: please provide details
4. Which of these apply to your Green Prescribing referral process?
- Self referrals (where patients ask you for this service)
- GP-led referrals (where you suggest this service)
- Other: please provide details
3b. What are your reasons for not prescribing
nature-based activities?
- I do not know enough about Green Prescribing
- Lack of funding
- I do not know how to initiate a green prescribing service
- Other: please provide details
3c. Would you like to know more about
Green Prescribing? Yes / No
5. Do you signpost patients to other organisations or direct patients to a nature-based activity?
- Other organisations (e.g. voluntary action groups, conservation charities etc.)
- Directly to a Green Prescribing activity (e.g. walking, horticulture)
- Other: please provide details
6. How is the Green Prescribing service you are involved with funded?
7. What do you consider to be the main barriers to Green Prescribing?
8. Do you think spending time in nature is beneficial for health and wellbeing?
9. If you answered ‘ Yes’ to Q8, what do you think are the mechanisms responsible for the health benefit?
FFigure A1. Greenn pprreessccrriibbiinnggqquueessttiioonnnnaaiirreeffoorrGGPPss..
7. What do you consider to be the main barriers to Green Prescribing?
8. Do you think spending time in nature is beneficial for health and wellbeing?
9. If you answered ‘ Yes’ to Q8, what do you think are the mechanisms responsible for the health benefit?
Int. J. Environ. Res. Public Health 2020, 17, 3460
Figure A1. Green prescribing questionnaire for GPs.
20 of 24
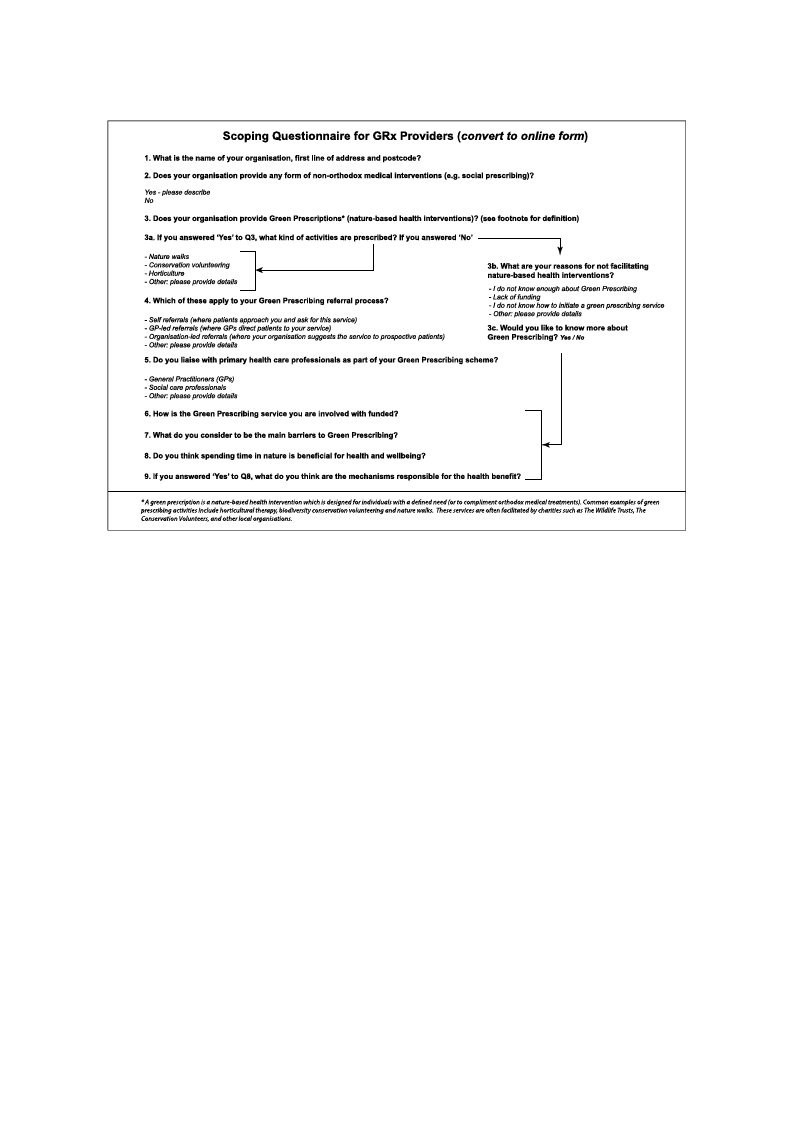
Figure A2. GGrreeeenn pprreessccrriibbiinnggqquueessttiioonnnnaairireeffoorrNNBBOOss. .
References
1. McEwan, K.; Richardson, M.; Sheffield, D.; Ferguson, F.J.; Brindley, P. A smartphone app for improving
mental health through connecting with urban nature. Int. J Environ Res Public Health. 2019, 16, 3373.
[CrossRef] [PubMed]
2. Sarris, J.; Manincor, D.; John, M.; Hargraves, F.; Tsonis, J. Harnessing the four elements for mental health.
Front. Psychiatry 2019, 10, 256. [CrossRef] [PubMed]
3. White, M.P.; Alcock, I.; Grellier, J.; Wheeler, B.W.; Hartig, T.; Warber, S.L.; Bone, A.; Depledge, M.H.;
Fleming, L.E. Spending at least 120 minutes a week in nature is associated with good health and wellbeing.
Sci. Rep. 2019, 9, 7730. [CrossRef] [PubMed]
4. Ideno, Y.; Hayashi, K.; Abe, Y.; Ueda, K.; Iso, H.; Noda, M.; Lee, J.S.; Suzuki, S. Blood pressure-Lowering
effect of Shinrin-yoku (Forest bathing): A systematic review and meta-analysis. BMC Complement. Altern.
Med. 2017, 17, 409. [CrossRef] [PubMed]
5. Li, Q. Effect of forest bathing trips on human immune function. Environ. Health Prev. Med. 2010, 15, 9.
[CrossRef]
6. Soga, M.; Gaston, K.J.; Yamaura, Y. Gardening is beneficial for health: A meta-analysis. Prev. Med. Rep. 2017,
5, 92–99. [CrossRef]
7. Clatworthy, J.; Hinds, J.M.; Camic, P. Gardening as a mental health intervention: A review. Ment. Health
Rev. J. 2013, 18, 214–225. [CrossRef]
8. Pasanen, T.P.; Johnson, K.A.; Lee, K.E.; Korpela, K.M. Can nature walks with psychological tasks improve
mood, self-reported restoration, and sustained attention? Results from two experimental field studies. Front.
Psychol. 2018, 9, 2057. [CrossRef]
9. Wyles, K.J.; White, M.P.; Hattam, C.; Pahl, S.; King, H.; Austen, M. Are some natural environments more
psychologically beneficial than others? The importance of type and quality on connectedness to nature and
psychological restoration. Environ. Behav. 2019, 51, 111–143. [CrossRef]

Int. J. Environ. Res. Public Health 2020, 17, 3460
21 of 24
10. Largo-Wight, E.; Guardino, C.; Wludyka, P.S.; Hall, K.W.; Wight, J.T.; Merten, J.W. Nature contact at school:
The impact of an outdoor classroom on children’s well-being. Int. J. Environ. Health Res. 2018, 28, 653–666.
[CrossRef]
11. Sbihi, H.; Boutin, R.C.; Cutler, C.; Suen, M.; Finlay, B.B.; Turvey, S.E. Thinking bigger: How early-life
environmental exposures shape the gut microbiome and influence the development of asthma and allergic
disease. Allergy 2019, 74, 2103–2115. [CrossRef] [PubMed]
12. Deckers, J.; Lambrecht, B.N.; Hammad, H. How a farming environment protects from atopy. Curr. Opin.
Immunol. 2019, 60, 163–169. [CrossRef]
13. Liddicoat, C.; Sydnor, H.; Cando-Dumancela, C.; Dresken, R.; Liu, J.; Gellie, N.J.; Mills, J.G.; Young, J.M.;
Weyrich, L.S.; Hutchinson, M.R.; et al. Naturally-diverse airborne environmental microbial exposures
modulate the gut microbiome and may provide anxiolytic benefits in mice. Sci. Total Environ. 2020, 701,
134684. [CrossRef] [PubMed]
14. Bethelmy, L.C.; Corraliza, J.A. Transcendence and Sublime Experience in Nature: Awe and Inspiring Energy.
Front. Psychol. 2019, 10, 509. [CrossRef] [PubMed]
15. Barrable, A. The Case for Nature Connectedness as a Distinct Goal of Early Childhood Education. Int. J.
Early Child. 2019, 6, 59–70.
16. Jennings, V.; Bamkole, O. The Relationship between Social Cohesion and Urban Green Space: An Avenue for
Health Promotion. Int. J. Environ. Res. Public Health 2019, 16, 452. [CrossRef]
17. Fuller, R.A.; Irvine, K.N.; Devine-Wright, P.; Warren, P.H.; Gaston, K.J. Psychological benefits of greenspace
increase with biodiversity. Biol. Lett. 2007, 3, 390–394. [CrossRef]
18. Van Tubergen, A.; van der Linden, S. A brief history of spa therapy. Ann. Rheum. Dis. 2002, 61, 273.
[CrossRef]
19. Jackson, R. Waters and spas in the classical world. Med Hist. 1990, 34, 1–13. [CrossRef]
20. Vladeva, E.; Bacheva, D.; Todorov, I. SPAs and wellness–a new philosophy for harmony in life. Scr. Sci. Salut.
Publicae 2016, 2, 60–64. [CrossRef]
21. Gianfaldoni, S.; Tchernev, G.; Wollina, U.; Roccia, M.G.; Fioranelli, M.; Gianfaldoni, R.; Lotti, T. History of the
Baths and Thermal Medicine. Open Access Maced. J. Med Sci. 2017, 5, 566. [CrossRef]
22. Wheatley, B.; Wyzga, R. Mercury as a Global Pollutant: Human Health Issues; Wheatley, B., Wyzga, R., Eds.;
Kluwer: Dordrecht, The Netherlands, 1997.
23. Ganesharajah, C. Indigenous Health and Wellbeing: The Importance of Country; Native Title
Research Unit, 2009. Australian Institute for Aboriginal and Torres Strait Islander Studies.
Available online: https://aiatsis.gov.au/sites/default/files/products/report_research_outputs/ganesharajah-
2009-indigenous-health-wellbeing-importance-country.pdf (accessed on 1 January 2020).
24. Shanahan, D.F.; Astell–Burt, T.; Barber, E.A.; Brymer, E.; Cox, D.T.; Dean, J.; Depledge, M.; Fuller, R.A.;
Hartig, T.; Irvine, K.N.; et al. Nature–Based Interventions for Improving Health and Wellbeing: The Purpose,
the People and the Outcomes. Sports 2019, 7, 141. [CrossRef] [PubMed]
25. Crnic, M.; Kondo, M.C. Nature Rx: Reemergence of Pediatric Nature-Based Therapeutic Programs From the
Late 19th and Early 20th Centuries. AJPH 2019. [CrossRef] [PubMed]
26. Margoliers, J. Refill as needed: To help ailing patients, Park Rx America prescribes a dose of nature. Landsc.
Archit. 2018, 108, 212.
27. Patel, A.; Schofield, G.M.; Kolt, G.S.; Keogh, J.W. General practitioners’ views and experiences of counselling
for physical activity through the New Zealand Green Prescription program. BMC Fam. Pract. 2011, 12, 119.
[CrossRef]
28. Swinburn, B.A.; Walter, L.G.; Arroll, B.; Tilyard, M.W.; Russell, D.G. The green prescription study: A
randomized controlled trial of written exercise advice provided by general practitioners. Am. J. Public Health
1998, 88, 288–291. [CrossRef]
29. Bragg, R.; Leck, C. Good Practice in Social Prescribing for Mental Health: The Role of Nature-Based Interventions;
Natural England Commissioned Reports: York, UK, 2017.
30. Aggar, C.; Caruana, T.; Thomas, T.; Baker, J.R. Social prescribing as an intervention for people with
work-related injuries and psychosocial difficulties in Australia. Adv. Health Behav. 2020, 3, 101–111.
[CrossRef]

Int. J. Environ. Res. Public Health 2020, 17, 3460
22 of 24
31. Gearey, M.; Robertson, L.; Anderson, J.; Barros, P.; Cracknell, D. Planning Cities with Nature. Re-Naturing the
City for Health and Wellbeing: Green/Blue Urban Spaces as Sites of Renewal and Contestation; Springer: Cham,
Switzerland, 2019; pp. 153–168.
32. Van den Berg, A.E. From green space to green prescriptions: Challenges and opportunities for research and
practice. Front. Psychol. 2017, 8, 268. [CrossRef]
33. Bragg, R.; Atkins, G. A Review of Nature-Based Interventions for Mental Health Care; Natural England
Commissioned Reports: York, UK, 2016.
34. Elsey, H.; Murray, J.; Bragg, R. Green fingers and clear minds: Prescribing ‘care farming’ for mental illness.
Br. J. Gen. Pract. 2016, 66, 99–100. [CrossRef]
35. Husk, K.; Lovell, R.; Garside, R. Prescribing gardening and conservation activities for health and wellbeing
in older people. Maturitas 2018, 110, A1–A2. [CrossRef]
36. Hart, J. Prescribing nature therapy for improved mental health. Altern. Complement. Ther. 2016, 22, 161–163.
[CrossRef]
37. Bloomfield, D. What makes nature-based interventions for mental health successful? BJPsych Int. 2017, 14,
82–85. [CrossRef] [PubMed]
38. Robinson, J.M.; Breed, M.F. Green prescriptions and their co-benefits: Integrative strategies for public and
environmental health. Challenges 2019, 10, 9. [CrossRef]
39. Moher, D.; Shamseer, L.; Clarke, M.; Ghersi, D.; Liberati, A.; Petticrew, M.; Shekelle, P.; Stewart, L.A. Preferred
reporting items for systematic review and meta-analysis protocols (PRISMA-P) 2015 statement. Syst. Rev.
2015, 4, 1. [CrossRef] [PubMed]
40. Tricco, A.C.; Lillie, E.; Zarin, W.; O’Brien, K.K.; Colquhoun, H.; Levac, D.; Moher, D.; Peters, M.D.; Horsley, T.;
Weeks, L.; et al. PRISMA extension for scoping reviews (PRISMA-ScR): Checklist and explanation. Ann.
Intern. Med. 2018, 169, 467–473. [CrossRef] [PubMed]
41. Williams, A. How to . . . Write and analyse a questionnaire. J. Orthod. 2003, 30, 245–252. [CrossRef]
42. Brace, I. Questionnaire Design: How to Plan, Structure and Write Survey Material for Effective Market Research;
Kogan Page Publishers: London, UK, 2018.
43. Patten, M.L. Questionnaire Research: A Practical Guide; Routledge: Abingdon, UK, 2016.
44. Rowley, J. Designing and using research questionnaires. Manag. Res. Rev. 2014, 37, 308–330. [CrossRef]
45. Browning, M.; Lee, K. Within what distance does “greenness” best predict physical health? A systematic
review of articles with GIS buffer analyses across the lifespan. Int. J. Environ. Res. Public Health 2017, 14, 675.
[CrossRef]
46. Houston, D. Implications of the modifiable areal unit problem for assessing built environment correlates of
moderate and vigorous physical activity. Appl. Geogr. 2014, 50, 40–47. [CrossRef]
47. Hochadel, M.; Heinrich, J.; Gehring, U.; Morgenstern, V.; Kuhlbusch, T.; Link, E.; Wichmann, H.E.; Krämer, U.
Predicting long-term average concentrations of traffic-related air pollutants using GIS-based information.
Atmos. Environ. 2006, 40, 542–553. [CrossRef]
48. Mears, M.; Brindley, P.; Maheswaran, R.; Jorgensen, A. Understanding the socioeconomic equity of publicly
accessible greenspace distribution: The example of Sheffield, UK. Geoforum 2019, 103, 126–137. [CrossRef]
49. Dennis, M.; Barlow, D.; Cavan, G.; Cook, P.A.; Gilchrist, A.; Handley, J.; James, P.; Thompson, J.; Tzoulas, K.;
Wheater, C.P.; et al. Mapping urban green infrastructure: A novel landscape-based approach to incorporating
land use and land cover in the mapping of human-dominated systems. Land 2018, 7, 17. [CrossRef]
50. Abel, G.A.; Barclay, M.E.; Payne, R.A. Adjusted indices of multiple deprivation to enable comparisons within
and between constituent countries of the UK including an illustration using mortality rates. BMJ Open 2016,
6, e012750. [CrossRef] [PubMed]
51. Southon, G.E.; Jorgensen, A.; Dunnett, N.; Hoyle, H.; Evans, K.L. Perceived species-richness in urban green
spaces: Cues, accuracy and well-being impacts. Landsc. Urban Plan. 2018, 172, 1–10. [CrossRef]
52. De Keijzer, C.; Tonne, C.; Sabia, S.; Basagaña, X.; Valentín, A.; Singh-Manoux, A.; Antó, J.M.; Alonso, J.;
Nieuwenhuijsen, M.J.; Sunyer, J.; et al. Green and blue spaces and physical functioning in older adults:
Longitudinal analyses of the Whitehall II study. Environ. Int. 2019, 122, 346–356. [CrossRef]
53. Coldwell, D.F.; Evans, K.L. Visits to urban green-space and the countryside associate with different
components of mental well-being and are better predictors than perceived or actual local urbanisation
intensity. Landsc. Urban Plan. 2018, 175, 114–122. [CrossRef]

Int. J. Environ. Res. Public Health 2020, 17, 3460
23 of 24
54. Brindley, P.; Cameron, R.W.; Ersoy, E.; Jorgensen, A.; Maheswaran, R. Is more always better? Exploring field
survey and social media indicators of quality of urban greenspace, in relation to health. Urban For. Urban
Green. 2019, 39, 45–54. [CrossRef]
55. Mears, M.; Brindley, P.; Jorgensen, A.; Ersoy, E.; Maheswaran, R. Greenspace spatial characteristics and
human health in an urban environment: An epidemiological study using landscape metrics in Sheffield, UK.
Ecol. Indic. 2019, 106, 105464. [CrossRef]
56. Houlden, V.; Weich, S.; Jarvis, S. A cross-sectional analysis of green space prevalence and mental wellbeing
in England. BMC Public Health 2017, 17, 460. [CrossRef]
57. Royal College of General Practitioners. GP Practices Supported to Recommend Active Lifestyles
to Patients and Staff with Launch of New UK-Wide Active Practice Charter. 2019. Available
online: https://www.rcgp.org.uk/about-us/news/2019/august/gp-practices-supported-to-recommend-active-
lifestyles-to-patients-and-staff.aspx (accessed on 1 August 2019).
58. Rogerson, M.; Wood, C.; Pretty, J.; Schoenmakers, P.; Bloomfield, D.; Barton, J. Regular Doses of Nature:
The Efficacy of Green Exercise Interventions for Mental Wellbeing. Int. J. Environ. Res. Public Health 2020,
17, 1526. [CrossRef]
59. Song, C.; Ikei, H.; Kagawa, T.; Miyazaki, Y. Effects of walking in a forest on young women. Int. J. Environ.
Res. Public Health 2019, 16, 229. [CrossRef]
60. Garrett, J.K.; White, M.P.; Huang, J.; Ng, S.; Hui, Z.; Leung, C.; Tse, L.A.; Fung, F.; Elliott, L.R.; Depledge, M.H.;
et al. Urban blue space and health and wellbeing in Hong Kong: Results from a survey of older adults.
Health Place 2019, 55, 100–110. [CrossRef] [PubMed]
61. Hunter, M.R.; Gillespie, B.W.; Chen, S.Y.P. Urban nature experiences reduce stress in the context of daily life
based on salivary biomarkers. Front. Psychol. 2019, 10, 722. [CrossRef] [PubMed]
62. La Puma, J. Nature Therapy: An Essential Prescription for Health. Altern. Complement. Ther. 2019, 25, 68–71.
[CrossRef]
63. Husk, K.; Elston, J.; Gradinger, F.; Callaghan, L.; Asthana, S. Social prescribing: Where is the evidence? Br. J.
Gen. Pract. 2019, 69, 6–7. [CrossRef]
64. Nelson, D.H.; Prescott, S.L.; Logan, A.C.; Bland, J.S. Clinical Ecology—Transforming 21st-Century Medicine
with Planetary Health in Mind. Challenges 2019, 10, 15. [CrossRef]
65. Cook, P.A.; Howarth, M.; Wheater, C.P. Biodiversity and Health in the Face of Climate Change: Implications
for Public Health. In Biodiversity and Health in the Face of Climate Change; Springer: Cham, Switzerland, 2019;
pp. 251–281.
66. Husk, K.; Blockley, K.; Lovell, R.; Bethel, A.; Lang, I.; Byng, R.; Garside, R. What approaches to social
prescribing work, for whom, and in what circumstances? A realist review. Health Soc. Care Community 2019,
28, 1–16. [CrossRef]
67. Leavell, M.A.; Leiferman, J.A.; Gascon, M.; Braddick, F.; Gonzalez, J.C.; Litt, J.S. Nature-Based Social
Prescribing in Urban Settings to Improve Social Connectedness and Mental Well-being: A Review. Curr.
Environ. Health Rep. 2019, 6, 297–308. [CrossRef]
68. Barbosa, O.; Tratalos, J.A.; Armsworth, P.R.; Davies, R.G.; Fuller, R.A.; Johnson, P.; Gaston, K.J. Who benefits
from access to green space? A case study from Sheffield, UK. Landsc. Urban Plan. 2007, 83, 187–195.
[CrossRef]
69. Larson, L.R.; Jennings, V.; Cloutier, S.A. Public parks and wellbeing in urban areas of the United States.
PLoS ONE 2016, 11, e0153211. [CrossRef]
70. Wood, L.; Hooper, P.; Foster, S.; Bull, F. Public green spaces and positive mental health–investigating the
relationship between access, quantity and types of parks and mental wellbeing. Health Place 2017, 48, 63–71.
[CrossRef] [PubMed]
71. Flies, E.J.; Skelly, C.; Negi, S.S.; Prabhakaran, P.; Liu, Q.; Liu, K.; Goldizen, F.C.; Lease, C.; Weinstein, P.
Biodiverse green spaces: A prescription for global urban health. Front. Ecol. Environ. 2017, 15, 510–516.
[CrossRef]
72. Barton, J.; Griffin, M.; Pretty, J. Exercise-, nature-and socially interactive-based initiatives improve mood and
self-esteem in the clinical population. Perspect. Public Health 2012, 132, 89–96. [CrossRef]
73. Buckley, R.C.; Westaway, D.; Brough, P. Social Mechanisms to get People Outdoors: Bimodal Distribution of
interest in nature? Front. Public Health 2016, 4, 257. [CrossRef] [PubMed]

Int. J. Environ. Res. Public Health 2020, 17, 3460
24 of 24
74. Peacock, J.; Hine, R.; Pretty, J. The Mental Health Benefits of Green Exercise Activities and Green Care; MIND:
Colchester, UK, 2007; pp. 1–18.
75. Razani, N.; Kohn, M.A.; Wells, N.M.; Thompson, D.; Flores, H.H.; Rutherford, G.W. Design and evaluation
of a park prescription program for stress reduction and health promotion in low-income families: The
Stay Healthy in Nature Everyday (SHINE) study protocol. Contemp. Clin. Trials 2016, 51, 8–14. [CrossRef]
[PubMed]
76. De Vries, S.; Van Dillen, S.M.; Groenewegen, P.P.; Spreeuwenberg, P. Streetscape greenery and health: Stress,
social cohesion and physical activity as mediators. Soc. Sci. Med. 2013, 94, 26–33. [CrossRef] [PubMed]
77. Akpinar, A. How is quality of urban green spaces associated with physical activity and health? Urban For.
Urban Green. 2016, 16, 76–83. [CrossRef]
78. Zhang, Y.; Van den Berg, A.; Van Dijk, T.; Weitkamp, G. Quality over quantity: Contribution of urban green
space to neighborhood satisfaction. Int. J. Environ. Res. Public Health 2017, 14, 535. [CrossRef]
79. Clifford, D. Voluntary sector organisations working at the neighbourhood level in England: Patterns by local
area deprivation. Environ. Plan. A 2012, 44, 1148–1164. [CrossRef]
80. Mohan, J.; Bennett, M.R. Community-level impacts of the third sector: Does the local distribution of voluntary
organizations influence the likelihood of volunteering? Environ. Plan. A Econ. Space 2019, 51, 950–979.
[CrossRef]
81. Braubach, M.; Egorov, A.; Mudu, P.; Wolf, T.; Thompson, C.W.; Martuzzi, M. Effects of urban green space on
environmental health, equity and resilience. In Nature-Based Solutions to Climate Change Adaptation in Urban
Areas; Springer: Cham, Switzerland, 2017; pp. 187–205.
© 2020 by the authors. Licensee MDPI, Basel, Switzerland. This article is an open access
article distributed under the terms and conditions of the Creative Commons Attribution
(CC BY) license (http://creativecommons.org/licenses/by/4.0/).