

Hadal biosphere: Insight into the microbial ecosystem
in the deepest ocean on Earth
Takuro Nunouraa,1, Yoshihiro Takakia,b, Miho Hiraia, Shigeru Shimamurab, Akiko Makabec,d,2, Osamu Koidea,
Tohru Kikuchie, Junichi Miyazakib, Keisuke Kobac, Naohiro Yoshidad,3, Michinari Sunamuraf, and Ken Takaib
bDepartment of Subsurface Geobiological Analysis and Research and aResearch and Development Center for Marine Biosciences, Japan Agency for
Marine-Earth Science & Technology, Yokosuka 237-0061, Japan; cInstitute of Agriculture, Tokyo University of Agriculture and Technology, Fuchu, Tokyo
183-8509, Japan; dDepartment of Environmental Science and Technology, Tokyo Institute of Technology, Midori-ku, Yokohama 226-8502, Japan; eGraduate
School of Nanobioscience, Yokohama City University, Kanazawa-ku, Yokohama 236-0027, Japan; and fDepartment of Earth and Planetary Science,
University of Tokyo, Bunkyo-ku, Tokyo 113-0033, Japan
Edited by David M. Karl, University of Hawaii, Honolulu, HI, and approved January 26, 2015 (received for review November 17, 2014)
Hadal oceans at water depths below 6,000 m are the least-explored
aquatic biosphere. The Challenger Deep, located in the western
equatorial Pacific, with a water depth of ∼11 km, is the deepest
ocean on Earth. Microbial communities associated with waters
from the sea surface to the trench bottom (0 ∼10,257 m) in the
Challenger Deep were analyzed, and unprecedented trench micro-
bial communities were identified in the hadal waters (6,000
∼10,257 m) that were distinct from the abyssal microbial commu-
nities. The potentially chemolithotrophic populations were less
abundant in the hadal water than those in the upper abyssal
waters. The emerging members of chemolithotrophic nitrifiers in
the hadal water that likely adapt to the higher flux of electron
donors were also different from those in the abyssal waters that
adapt to the lower flux of electron donors. Species-level niche sep-
aration in most of the dominant taxa was also found between the
hadal and abyssal microbial communities. Considering the geomor-
phology and the isolated hydrotopographical nature of the Mariana
Trench, we hypothesized that the distinct hadal microbial ecosystem
was driven by the endogenous recycling of organic matter in the
hadal waters associated with the trench geomorphology.
traits, a significantly higher microbial carbon turnover rate has been
identified in hadal sediments than that in adjacent abyssal plain
sediments (13). Furthermore, Jamieson et al. indicated that the
potential trench-specific distribution of eukaryotes is likely a result
of the hydrostatic pressure and hydrotopographical isolation (7).
The Challenger Deep in the Mariana Trench is the deepest
ocean on Earth, and its geology, current patterns, water chem-
istries, and benthic microbial communities have been relatively
well studied (8, 9, 13–17). However, the hadal aquatic microbial
communities in the Challenger Deep remain completely unchar-
acterized. This study aims to characterize the microbial commu-
nity compositions and functions of the hadal water microbial
ecosystem.
Results
Geochemical and Physical Environments. Water samples were taken
in a total of three dives of the remotely operated vehicle (ROV)
ABISMO at the same station (11–22.25′N, 142–42.75′E) on the
Challenger Deep. The temperature and salinity profiles were
| | | | hadal trench niche separation nitrification Challenger Deep
Significance
Microbial life in the dark ocean below mesopelagic water
(corresponding to 200- to 1,000-m depth range) is thought
to be primarily supported by the sinking organic carbon from
surface waters. However, it has recently been revealed that the
deep-sea biogeochemical cycles are more complex than pre-
viously expected and that the mismatch between the organic
carbon supply and microbial heterotrophic demand has led to
imbalances in some oceans (1–4). Currently, the contribution of
chemolithoautotrophy and mixotrophy to the biogeochemical
cycle (e.g., dark carbon fixation coupled with nitrification and
sulfur oxidations) is also recognized as another significant or-
ganic carbon source in the dark ocean (3, 5, 6). It has been es-
timated that the dissolved inorganic carbon fixation in the dark
ocean by these organisms could be on the same order-of-mag-
nitude as heterotrophic biomass production (3, 5).
Hadal oceans at water depths below 6,000 m are comprised
almost exclusively of trenches and are the least-explored aquatic
biosphere on Earth. Trench environments are differentiated from
upper abyssal oceans by their elevated hydrostatic pressure and
their hydrotopographically isolated nature, whereas other physical
and chemical conditions, such as temperature, salinity, dissolved
oxygen, and nutrients are comparable to those in abyssal oceans
(7–9). The microbiological and geochemical investigations of ha-
dal waters have been limited (10), in contrast to the long history
of hadal benthic microbiological studies occurring since the
1950s (11). To date, many piezophiles and piezotolerant bacteria
have been isolated from hadal benthic habitats, and their phe-
notypical and genomic features have been characterized to be
distinct from those of the close relatives obtained from shallow
marine environments (12). As one of the major biogeochemical
Although many microbial explorations for hadal sediments
began in the 1950s, the hadal water is the least-explored mi-
crobial biosphere. In this study, unexpected microbial ecosys-
tems associated with the hadal trench water were discovered
down to a 10,257-m water depth in the Challenger Deep of the
Mariana Trench, which is the deepest ocean on Earth. We
found the enrichment of heterotrophic population in the hadal
water (6,000 ∼10,257 m) microbial communities, whereas the
chemolithotrophic populations were more abundant in the up-
per abyssal waters. This observation suggested that the hadal
microbial biosphere was supported by the endogenous recycling
of organic matter in the hadal waters associated with the trench
geomorphology.
Author contributions: T.N. and K.T. designed research; T.N., M.H., A.M., O.K., T.K., J.M.,
K.K., and M.S. performed research; T.N., Y.T., S.S., A.M., and N.Y. analyzed data; and T.N.,
Y.T., A.M., and K.T. wrote the paper.
The authors declare no conflict of interest.
This article is a PNAS Direct Submission.
Freely available online through the PNAS open access option.
Data deposition: The sequences reported in this paper have been deposited in the GenBank
database (accession nos. AB703684–AB703973 and AB703974–AB704001) and Short Read Ar-
chive database (accession no. DRA002518).
1To whom correspondence should be addressed. Email: takuron@jamstec.go.jp.
2Present address: Project Team for Development of New-generation Research Protocol for
Submarine Resources, Japan Agency for Marine-Earth Science & Technology, Yokosuka
237-0061, Japan.
3Present address: Earth-Life Science Institute, Tokyo Institute of Technology, Meguro-ku,
Tokyo 152-8550, Japan.
This article contains supporting information online at www.pnas.org/lookup/suppl/doi:10.
1073/pnas.1421816112/-/DCSupplemental.
E1230–E1236 | PNAS | Published online February 23, 2015
www.pnas.org/cgi/doi/10.1073/pnas.1421816112
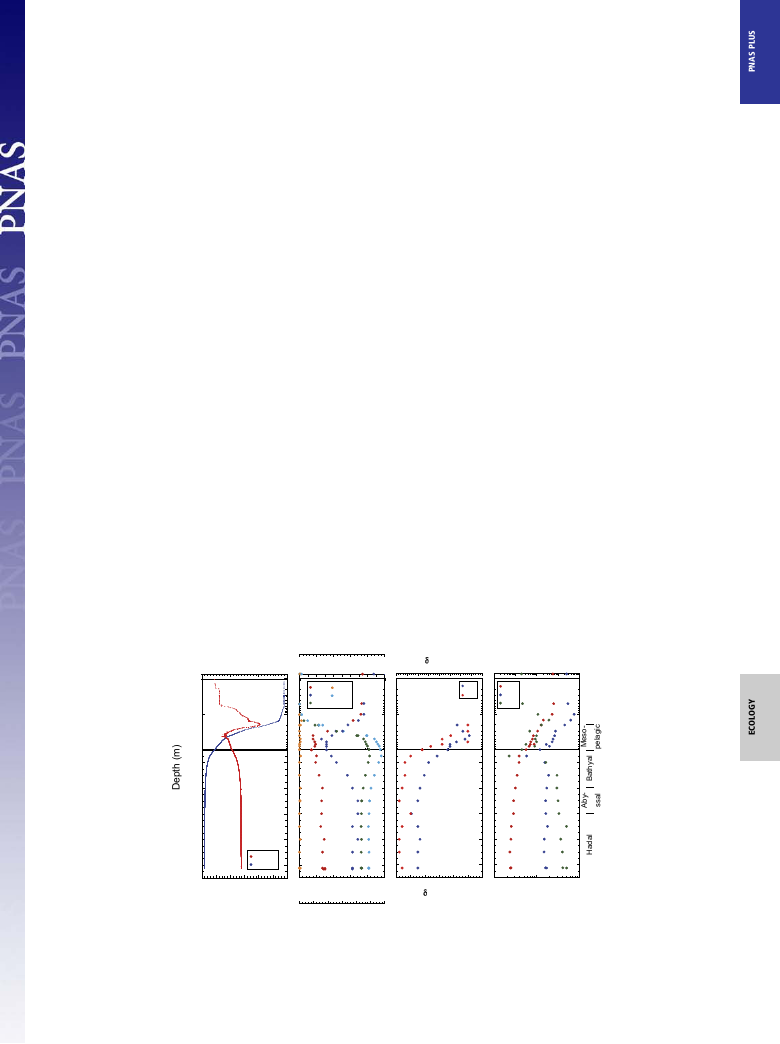
similar to previous observations, and the salinity slightly increased
at depths greater than 9,000 m below the surface (mbs) (8, 9, 18).
The sea surface temperature was 29.1 °C; the potential tempera-
ture decreased to 1.02 °C at 10,257 mbs. The sea surface salinity
was 34.2, and the maximum (34.8) and minimum (34.4) salinities
were found at ∼150 and 400 mbs, respectively (Fig. 1A). The sa-
linity was constant at ∼34.6 below 1,500 mbs and slightly increased
below 9,000 mbs, as reported in previous studies (9, 18). The
dissolved oxygen concentration (DO) at the sea surface was
219 μM and decreased to 62.5 μM at 500 mbs (Fig. 1B and
Dataset S1). Then, the DO increased to 156 μM at 4,000 mbs and
presented relatively constant concentrations between 156 μM
and 172 μM below 4,000 mbs. The nitrate concentration at the
sea surface was 0.22 μM, and it drastically increased along the
thermo- and chemoclines (200–400 mbs) (Fig. 1B and Dataset
S1). The maximum nitrate concentration (41.2 μM) was detected
at 1,500 mbs, and constant nitrate concentrations (36.2–36.5 μM)
were found below 5,000 mbs. The nitrite concentrations were less
than 0.07 μM (detection limit <0.01 μM) throughout the water
column. The ammonium concentrations were under the de-
tection limit (detection limit <0.1 μM). The natural abundances
of 15N and 18O of nitrate were 4.7–7.4‰ and 2.1–4.5‰, re-
spectively (Fig. 1C and Dataset S1). The δ15N and δ18O values of
deep nitrate were similar to previously reported data in other
oceanic regions (19). The temperature and salinity profiles sug-
gest the presence of at least five types of water masses throughout
the depth profile: surface water (above 50 mbs), high salinity
water (∼150 mbs), low salinity water (∼400 mbs), mesopelagic
water (above 2,000 mbs), and deep water (below 2,000 mbs) (Fig.
1A). No significant change in the inorganic nutrients and isotopic
signatures of nitrate between the hadal (below 6,000 mbs) and
abyssal (below 4,000 m) waters was found, which was similar to
a previous study (18) (Fig. 1B).
Cellular and Viral Abundance. The maximum cell abundance was
found at 51 mbs (6.4 × 10⁵ cells/mL) and the abundance de-
creased to a depth of 1,499 mbs (1.5 × 10⁴ cells/mL) (Fig. 1D and
Dataset S1). Below 2,000 mbs the cell abundance was relatively
constant but gradually decreased with increasing depth, and the
cell abundance of the bottom waters was ∼6 × 10³ cells/mL. The
abundance of virus-like particles (VLPs) increased from the sea
surface to 101 mbs (5.8 × 10⁶ particles/mL) and then decreased
with increasing depth to 1,499 mbs (3.4 × 10⁴ particles/mL). The
VLP abundance increased at 2,000 mbs (2.4 × 10⁵ particles/mL),
and relatively constant VLP abundance was observed below
2,000 mbs (2.2–3.6 × 10⁵ particles/mL) (Fig. 1D). The maximum
and minimum VLP-prokaryote ratio (VPR) was found at 147
and 1,499 mbs, respectively. The VPR below 2,000 mbs slightly
increased with increasing depth; however, there were a few
exceptions. The transition of microbial and viral abundance
profiles between 1,500 and 2,000 mbs is likely equivalent to the
water–mass interface.
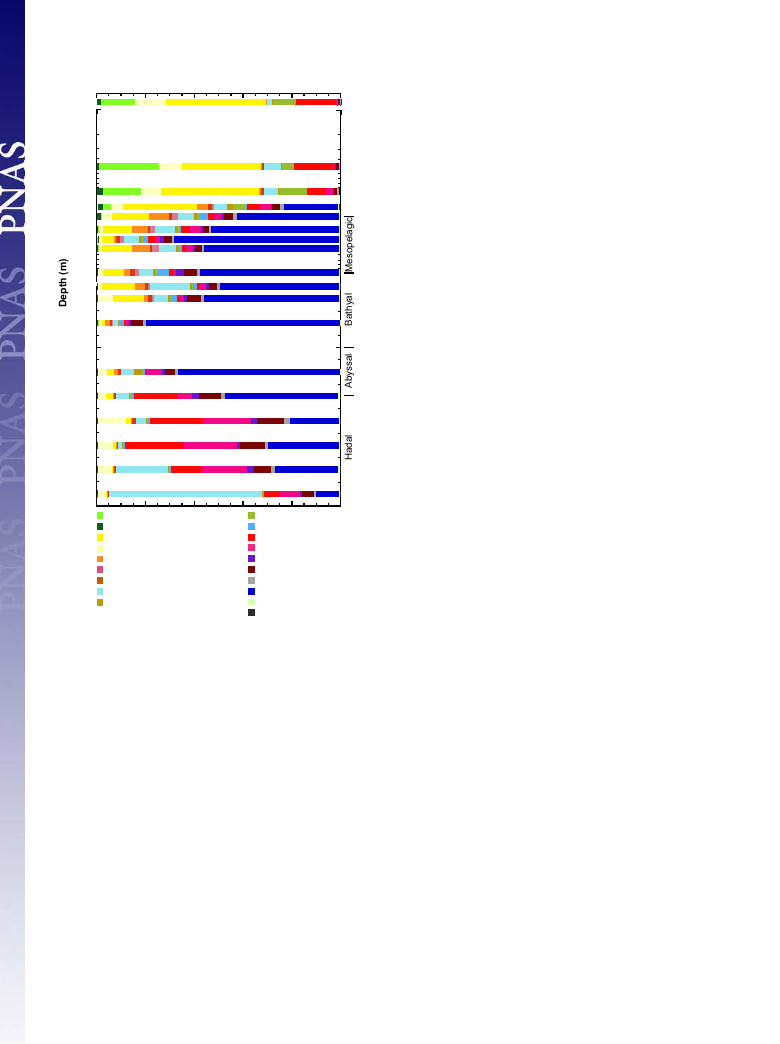
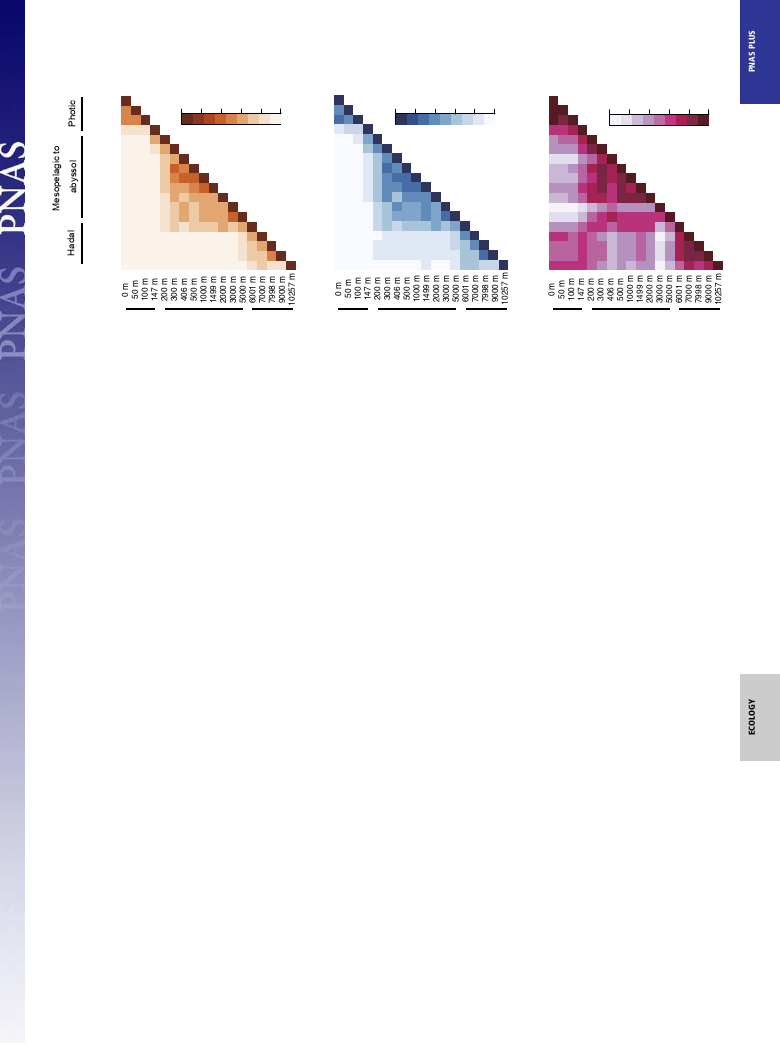
SSU rRNA Gene Community Structures. Both tag sequencing and
clone analyses were applied to investigate the prokaryotic small
subunit (SSU) rRNA gene community structure along the water
column on the Challenger Deep (Fig. 2 and Dataset S2). Overall,
the niche separation at the species to phylum levels along the
water column was identified. The tag sequence populations were
grouped along the water column at the species level, as shown by
the Jaccard and Bray–Curtis similarity matrixes: the euphotic
zone (above 101 mbs), the mesopelagic to abyssopelagic waters
(202–5,000 mbs), and the trench waters (below 6,001 mbs); a
similar trend was also found at higher taxonomic levels (Fig. 3
and Figs. S1 and S2).
In the euphotic zone, obligately phototrophic Prochlorococcus
and potentially photoheterotrophic bacterial lineages, such as
SAR11 and Bacteroidetes (20, 21), dominated the prokaryotic
SSU rRNA gene communities. The high abundance of Actino-
bacteria only occurred above 147 mbs, which implies the occur-
rence of phototrophic metabolism (22). SAR11 also dominated
the SSU rRNA gene communities in aphotic waters above 2,000
mbs, and its abundance decreased drastically at 3,000 mbs. Below
147 mbs, thaumarchaeal phylotypes became the predominant pop-
ulations; its relative abundance decreased with increasing trench
water depth (Fig. 2). The abundance of SAR324, a potential
chemolithoautotrophic deltaproteobacterial subgroup (6, 23, 24),
also increased at 147 mbs and was detected as one of the
A
0 34
10
100
Salinity
34.5 35
B
NO3- (µM)
C
0 10 20 30 40 50
pH
15N (‰)
35.5 7.5
8
8.5 4 5 6 7
D
Cell & VLP abundance
(cells or particles ml-1)
8 103 104 105 106 107
pH NO2-
DO
NO3-
PO4
15N
cell
18O
VLP
VPR
1000
2000
4000
6000
8000
10000
Salinity
Temp
0 5 10 15 20 25 30 0 50 100 150 200 250 2
Potential temperature (˚C)
DO (µM)
0
1
2
3
NO2- , PO4 (µM)
3
4
18O (‰)
51
10
100
Virus prokaryote ratio
(VPR)
Fig. 1. Temperature and salinity (A); oxygen, nitrate, nitrite, and phosphate concentrations and pH (B); the δ15N and δ18O of nitrate (C); and the abundance
of prokaryotic cells and VLPs and VPR (D) along the water column in the Challenger Deep. The CTD profile of temperature and salinity was obtained in dive
AB#11. Other profiles were obtained by a total of three dives at the same location.
Nunoura et al.
PNAS | Published online February 23, 2015 | E1231
Relative abundance in tag sequences (%)
0
100
0
(24812)
10
(17443)
100
(24273)
(16285)
(17334)
(15254)
(22389)
(14740)
1000
2000
(17276)
(17509)
(8109)
4000
(11695)
6000
(12348)
(11546)
8000
(11679)
(24669)
(35710)
10000
(15679)
Cyanobacteria
chloroplast
SAR11 (Alphaproteobacteria)
Alphaproteobacteria (others)
SAR324 (Deltaproteobacteria)
Nitrospina
Deltaproteobacteria (others)
Gammaproteobacteria
Chloroflexi
Actinobacteria
Acidobacteria
Bacteroidetes
SAR406
Gemmatimonadetes
Planctomycetes
other bacteria
Thaumarchaeota
DHVEG 6
other archaea
Fig. 2. Prokaryotic SSU rRNA gene community composition along the water
column in the Challenger Deep. Numbers in parentheses indicate the num-
ber of tag sequences.
predominant populations above 5000 mbs. In contrast, the potential
heterotrophic SAR406 (Marine Group A) and Bacteroidetes
(10, 25) dominated the prokaryotic SSU rRNA gene communities
below 6,000 mbs, whereas they were found as only a minor pop-
ulation above 5,000 mbs. Intriguingly, the predominance of the
tag sequences closely related to Halomonas sp. and Pseudomonas
stutzeri occurred at the bottom of the trench waters (9,000 and
10,241 mbs) (Fig. 2 and Dataset S2).
Among the potential nitrifier populations in the SSU rRNA
gene analyses, we found niche separation for both nitrite and
ammonia oxidizers along the water column. A relatively high
abundance of the nitrite-oxidizing Nitrospina was detected in
waters between 147 and 2,000 mbs, whereas the abundance of
Nitrospira increased in the trench waters (Fig. 2 and Dataset S2).
Among the potential ammonia oxidizers, the niche separation of
thaumarchaeal subgroups was found along the water column,
and the Nitrosomonas population was detected only in the trench
waters. Subgroup β of the marine group I (MGI) thaumarch-
aeote dominated the thaumarchaeal population at the bottom of
the photic zone (147–300 mbs), the δ subgroup was detected
above 2,000 mbs, the α subgroup dominated the thaumarchaeal
population in the trench waters below 6,000 mbs, and the γ
subgroup was detected throughout the water column below 147 mbs
(Figs. S3 and S4A).
Detection and Quantification of Nitrifiers. To clarify the niche
separation of ammonia oxidizers suggested by the SSU rRNA
gene-sequencing analyses, a clone sequencing analysis was con-
ducted for the archaeal ammonia monooxygenase α subunit
(amoA) gene, and subsequent quantitative PCR analyses were
applied for other bacterial nitrifiers to characterize the niche
separation of nitrifiers in further detail. For the preparation
of sufficient template DNA, amplified environmental DNA
was used for the analyses. In fact, the composition of envi-
ronmental DNA must be biased during the genome amplifi-
cation; however, the technique has advantages in environmental
molecular studies using insufficient amounts of DNA (26, 27).
The archaeal amoA gene clone analysis suggested the distinctive
distribution of four major amoA subgroups (A, Ba, Bb, and D)
along the water column (Figs. S4B and S5). The niche separa-
tion of ammonia-oxidizing archaea (AOA) above the abyssal
waters that suggested by the amoA gene clone analysis resem-
bles the previously observed pattern that showed the distinctive
distribution of the “high ammonia cluster” (HAC) and “low
ammonia cluster” (LAC) of archaeal amoA along the water
column (28) (Fig. S5). The HAC was comprised of the groups A,
C, and D, and the LAC was identical to groups Ba and Bb in
this study.
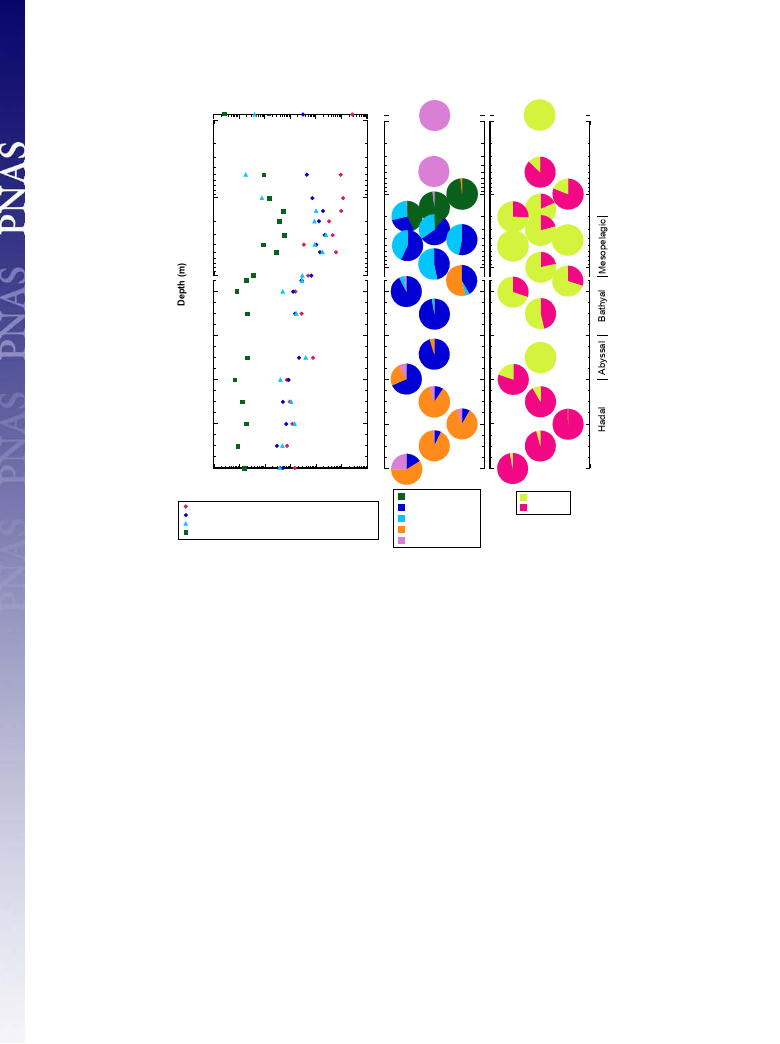
Based on the amoA sequences obtained in this study, group-
specific primers for quantification were constructed for each
dominant amoA group to clarify the niche separation of the
AOA along the water column at this site. The distribution and
abundance patterns obtained in the quantitative PCR were more
similar to the MGI SSU rRNA gene communities than that in
the archaeal amoA gene clone analysis (Fig. 4 and Fig. S4).
Group A and Bb of amoA dominated in the photic zone above
200 mbs and in the mesopelagic waters above 1,000 mbs, re-
spectively; however, amoA group Ba was found below 300 mbs
and predominated between the mesopelagic and bathypelagic
zone (300–6,000 mbs). Group D predominantly occurred in the
hadal waters. The sum of the archaeal amoA copy number below
147 mbs correlated with archaeal SSU rRNA gene copy number
below 147 mbs in the ratio of 0.9 (R = 0.91). The archaeal SSU
rRNA gene communities below 147 mbs are dominated by the
MGI thaumarchaeotes (Fig. 2), and the genomes of the MGI
thaumarchaeotes in the publically accessible database are known
to encode only one copy of the amoA and SSU rRNA genes.
Thus, most of the MGI thaumarchaeotes distributed in the water
column would harbor amoA, as suggested by Sintes et al. (28).
These results also suggest the coordination between the thau-
marchaeal SSU rRNA and amoA gene clusters: group α in the
SSU rRNA gene and D in amoA, β and A, γ and Ba, and δ and
Ba, respectively.
In addition, conventional and quantitative PCR were exam-
ined for genes from gamma- and betaproteobacterial ammonia
oxidizers and nitrite-oxidizing Nitrospira, Nitrospina, and alpha-
and gammaproteobacteria. The gammaproteobacterial ammonia
oxidizers and alpha- and gammaproteobacterial nitrite oxidizers
(e.g., Nitrobacter and Nitrococcus, respectively) were not detected
throughout the water column. The betaproteobacterial amoA
genes were revealed to be abundant in the amoA composition of
the photic zone and the trench bottom waters, but they were
absent in most depths of the mesopelagic to abyssal waters
(between 400 and 5,000 mbs). Among the nitrite oxidizers, niche
separation between Nitrospina and Nitrospira was also revealed.
The Nitrospira SSU rRNA gene population outcompeted the
Nitrospina SSU rRNA gene population in waters at 50 and
100 mbs, as well as in the hadal waters. The Nitrospina SSU
rRNA gene abundance was higher than that of the Nitrospira
E1232 | www.pnas.org/cgi/doi/10.1073/pnas.1421816112
Nunoura et al.
A
Jaccard
0m
50 m
100 m
147 m
200 m
300 m
406 m
500 m
1000 m
1499 m
2000 m
3000 m
5000 m
6001 m
7000 m
7998 m
9000 m
10257 m
Distance
B Bray-Currtis
Distance
C Unifrac
0 0.2 0.4 0.6 0.8 1.0
0m
0 0.2 0.4 0.6 0.8 1.0
0m
50 m
50 m
100 m
100 m
147 m
147 m
200 m
200 m
300 m
300 m
406 m
406 m
500 m
500 m
1000 m
1000 m
1499 m
1499 m
2000 m
2000 m
3000 m
3000 m
5000 m
5000 m
6001 m
6001 m
7000 m
7000 m
7998 m
7998 m
9000 m
9000 m
10257 m
10257 m
Value
0 0.2 0.4 0.6 0.8 1.0
Photic
Mesopelagic to
abyssal
Hadal
Photic
Mesopelagic to
abyssal
Hadal
Photic
Mesopelagic to
abyssal
Fig. 3. Similarity matrixes of Jaccard (A), Bray–Curtis (B), and UniFrac (C) of the SSU rRNA gene-tag sequences.
Hadal
population below the bottom of the euphotic zone to the bathyal
waters (150–5,000 mbs) (Fig. 4). Gammaproteobacterial nxrA
was not detected in this study.
Dilution Counting of Heterotrophic Bacteria. The culturable het-
erotrophic microbial population was estimated on board by using
serial dilution cultivation of heterotrophic bacteria at 4 °C; the
partial SSU rRNA gene sequences of the strains obtained from
the most diluted inocula with microbial growth were determined.
Surprisingly, a quite high culturable population was found (at > 2 ×
103 cells/mL) in the trench bottom waters from 9,003 and 10,243 m,
whereas the microbial cell abundances at these depths were only 5.5
and 6.3 × 10³ cells/mL, respectively (Dataset S1). The predominant
culturable heterotrophic microbes at these depths were very similar
to P. stutzeri (99% similarity), which was consistent with the envi-
ronmental SSU rRNA gene analyses at these depths (Fig. 2 and
Dataset S2). Conversely, the culturable population in the upper
waters (0–1,500 mbs) ranged from > 0–2 × 10³ cells/mL and the
population in deep waters (2,000–8,000 mbs) ranged from > 0–2 ×
10 cells/mL.
Discussion
Niche Separation of Nitrifiers. The composition of nitrifiers could be
indexes of carbon and nitrogen cycles in oceanic ecosystem because
NH4+ is provided by nitrogenous organic matter decomposition. In
addition, it has been noted that the niche separation of nitrifiers is
regulated by the amount of available electron donors such as am-
monia and nitrite (28–30). Thus, the niche separation of nitrifiers
could be a signature of NH4+ flux from organic matter de-
composition that cannot be identified from NH4+ concentration
measurements. In fact, the SSU rRNA gene-sequencing analyses
and quantitative PCR analyses of nitrifiers suggested the possible
niche separation along with the transition of the entire microbial
community structure and NH4+ flux.
Sunlight, pH, and salinity are additional significant factors that
affect the niche separation of ammonia oxidizers besides the
NH4+ concentration (31–33). The salinity change is less than 1 in
the water column on the Challenger Deep and is negligible in
this case. The higher abundance of ammonia-oxidizing bacteria
(AOB) than AOA in the upper euphotic zone (above 50 mbs) is
likely consistent with the high sensitivity of AOA to photo-
inhibition than the sensitivity of AOB shown by the previous
cultivation experiments (31). The predominance of group A
amoA (possibly group β MGI) in the bottom of the euphotic
zone may be associated with the relatively higher pH zone along
the water column (Figs. 1A and 4). The co-occurrence of AOB
and archaeal amoA group D HAC) in hadal water and the
predominance of archaeal amoA groups Ba and Bb (LAC) in
abyssal water are consistent with the previous observation that
AOA prefers lower ammonia concentrations than AOB (30).
The distinctive distribution of potential nitrite oxidizers, such
as the Nitrospina and Nitrospira SSU rRNA genes, was also
revealed. The Nitrospira SSU rRNA gene population overtook
the Nitrospina SSU rRNA gene population in waters at 50 and
100 mbs, as well as the hadal waters. The Nitrospina SSU rRNA
gene population overcame that of the Nitrospira population
below the bottom of the euphotic zone to the bathyal waters
(150–5,000 mbs) (Fig. 4). This distribution pattern is generally
consistent with the abundance of the Nitrospina and Nitrospira
populations in the SSU rRNA gene-tag sequences. The significance
of Nitrospina in the bottom of the euphotic zone to mesopelagic
water is in accordance with the previous reports for (sub)tropical
oceans (34–36). In contrast, the significance of Nitrospira in oceanic
waters has not yet been revealed, although their contribution in
nitrification was reported in seafloor environments (37–39). These
observations could be interpreted as a result of kinetic-dependent
niche separation, but several uncertainties cannot be ruled out (e.g.,
technical difficulties in the detection of nitrite oxidizers) (39). In
general, Nitrospira and Nitrospina have typically been found in eu-
trophic and oligotrophic marine environments, respectively. Thus,
Nitrospira likely adapts to a higher nitrite flux than Nitrospina.
Factors Controlling the Hadal Biosphere. The distribution and abun-
dance patterns of the entire microbial and nitrifiers communities
in the hadal waters were found to be distinct from those in abyssal
waters. In the hadal water, the potential chemolithoautotrophs
decreased in relative abundance with increasing depth and were
likely replaced by the heterotrophic populations. In addition, most
likely responding to the potentially elevated ammonia supply by
the heterotrophic activity with increasing depth, the dominant
groups of both ammonia and nitrite oxidizers were different.
These results suggest that the formation of a unique hadal bio-
sphere in the Challenger Deep may be driven by the input of
organic matter and the following heterotrophic degradation;
however, the distribution and abundance patterns of microbial
communities cannot be explained by the vertical flux of sinking
organic particles.
Nunoura et al.
PNAS | Published online February 23, 2015 | E1233
A
100
B Ammonia
oxidizers
Nitrite oxidizers
100
1000
2000
4000
6000
8000
10000
1
10 102 103 104 105 106
Gene abundance (copies/ml)
All prokaryotic SSU rRNA gene
Archaeal SSU rRNA gene
amoA from archaeal and bacterial ammonia oxidizers
SSU rRNA gene from nitrite oxidizers
Group A
Group Ba
Group Bb
Group D
Betaproteobacteria
Nitrospina
Nitrospira
Fig. 4. The abundance of whole prokaryotic, archaeal and nitrite oxidizer SSU rRNA and amoA genes (A), and the abundance of subgroups of amoA genes
and SSU rRNA genes of nitrite-oxidizing bacteria (B) along the water column in the Challenger Deep obtained by quantitative PCR. Grouping of amoA are
shown in Fig. S5.
The Challenger Deep is located in the oligotrophic ocean
region and is geographically and hydrotopographically isolated
from other trenches in the Western Pacific. Thus, endogenous
organic carbon sources are required to support the hadal water
heterotrophic microbial communities. Recent studies have pointed
to the importance of suspended organic matter, including both
sinking and suspended organic matter in bathypelagic waters
(40, 41). In addition, Kawagucci et al. reported the impacts of
suspended sediment associated with huge earthquakes that
affected the microbial communities in the bathyal and abyssal
water ecosystems (42). The microbial heterotrophic popula-
tions influenced by the suspended organic matter were similar
to those found in the Challenger Deep hadal biosphere that
were enriched by heterotrophs. A steep slope, narrow geo-
morphology, slow trench current (8, 9), and earthquakes may
supply a steady state or the occasional input of sinking and
suspended organic matter. Because suspended particulate matters
are transported vertically as well as horizontally (42, 43), the
suspended organic matter from slopes likely influences the
geochemical cycle in the entire trench waters. The higher
sediment deposition rate in the trench bottom compared with
the adjacent abyssal plain (13), as well as the clear stratification
of trench bottom sediment under the sampling site (Fig. S6),
also suggest the occasional input of sediment supply from the
trench slope. Moreover, the slightly elevated salinity of the
bottom water could induce the density-driven stratification of
hadal water mass (9). The stratification of hadal water mass may
promote the development of isolated and unique biogeochemical
cycles and microbial communities. This study hypothesizes that
the unique microbial ecosystem in one of the deepest accessible
biospheres on this planet is primarily driven by the geomorphology
of the Mariana Trench.
Experimental Procedures
Site Description and Sampling. A total of three dives for the ROV ABISMO was
conducted in the Challenger Deep of the Mariana Trench (11°22.25′N,
142°42.75′E, 10,300 m) during the Japan Agency for Marine-Earth Science &
Technology (JAMSTEC) R/V Kairei KR08-05 cruise (June 2008) (44) (Dataset
S1). Temperature, depth, and salinity were measured using a conductivity,
temperature, and depth (CTD) sensor SBE49 (Sea-Bird Electronics). Waters
from near the bottom of the trench (water depth of approx. 10,300 m) to
the surface were taken using Niskin bottles (5 L) (General Oceanic) that were
settled on the ROV ABISMO. Sea-surface water was collected using a bucket. The
water samples used in this study are summarized in Dataset S1, and the sub-
samples for geochemical and microbiological analyses were taken from the same
bottles. Samples for cell counting were fixed by formaldehyde [final concen-
tration 3% (vol/vol)], and filtered on a polycarbonate membrane filter (0.2 μm).
The filters were stored at −80 °C. The water samples for counting virus-like
particles were filtered with cellulose nitrate membrane filter (0.2 μm), fixed by
formaldehyde [final concentration 3% (vol/vol)], frozen in liquid nitrogen, and
then stored at −80 °C. Microbial cells in each 2–3 L water for molecular ecological
analyses were collected on cellulose nitrate membrane filters, and stored at
−80 °C. Trench bottom sediment was obtained by a gravity corer of the ROV
ABISMO in the same dive. A sediment core was split onboard and stored at 5 °C.
E1234 | www.pnas.org/cgi/doi/10.1073/pnas.1421816112
Nunoura et al.

Geochemical Analyses. DO was measured using an oxygen CHEMets kit
(CHEMeytrics) onboard. Samples for nutrient analysis were filtrated with
0.2-μm cellulose acetate filter and stored at −20 °C until further analysis.
Concentrations of NO3−, NO2−, PO4−, and NH4+ were analyzed spectropho-
tometrically using an automated QuAAtro 2-HR analyzer (BL TEC).
Nitrogen and oxygen isotopic compositions of the nitrate were determined
using the denitrifier method (45–47). Nitrate was converted to N2O by the
strain Pseudomonas chlororaphis (JCM20509 = ATCC13985), a denitrifying
bacterium lacking the capability of N2O reduction (46). Then, the produced
nitrous oxide was extracted, purified, and measured for nitrogen and oxygen
isotopic ratios using a 20–22 continuous flow isotope ratio mass spectrometer
(Sercon) at Tokyo University of Agriculture and Technology. The amount of
nitrous oxide introduced to CF-IRMS ranged from 3 to 15 nmol. International
isotopic reference materials, USGS32 (δ15N = 180‰, δ18O = 25.7‰), USGS34
(δ15N = −1.8‰, δ18O = -27.9‰), USGS35 (δ18O = 57.5‰) and IAEA-NO3 (δ15N =
4.7‰, δ18O = 25.6‰) (47–49), were used for the calibration. The δ15N values
were reported relative to atmospheric N2, and the δ18O values were reported
relative to standard mean ocean water (V-SMOW). The analytical precision of
in-house material was typically less than 0.2‰ for δ15N and 0.3‰ for δ18O.
DNA Extraction and Amplification. Environmental DNA was extracted from
the cells on cellulose nitrate membrane filters using a Soil DNA Isolation Kit
(Mo-Bio Lab) with minor modifications. A portion of environmental DNA was
amplified using a REPLI-g Mini Kit (Qiagen) for the molecular analyses de-
scribed below. Amplified DNA assemblages were digested by S1 nuclease
(Invitrogen) before the following studies.
Diversity Analyses for SSU rRNA and Archaeal amoA Genes. Prokaryotic SSU
rRNA gene fragments were amplified with a primer set of 530F and 907R (50)
from the original environmental DNA assemblages using LA Taq polymerase
with GC buffer (Takara Bio) as previously described (50). For tag sequencing,
primers with 10 bp of extended tag sequences in 5′-termini were used for the
SSU rRNA gene amplification. For archaeal amoA clone analysis, gene frag-
ments were obtained using EX Taq polymerase (Takara Bio) from the ampli-
fied environmental DNA assemblages. The amplification conditions and primer
sequences for each of the PCR amplifications are summarized in Table S1.
For the clone analyses, amplified DNA fragments were cloned into pCR2.1
vector (Invitrogen), and clone libraries were constructed. The inserts were
directly sequenced with the M13M4 primer using an ABI3730xl genetic an-
alyzer with Big Dye v3.1. SSU rRNA gene sequences with >97% identity were
assigned as the same clone type (phylotype) based on FastGroup II (51) and
similarity analysis in GENETYX-MAC v15 (GENETYX). SSU rRNA gene ampli-
cons for tag sequencing were analyzed by 454 FLX Titanium sequencer
(Roche). All of the raw tag sequences were treated with shhh.flows pipeline
in MOTHUR 1.31.1 (52–54), and the primer sequences in either or both ends
of the tags were eliminated. Tag sequences shorter than 300 bp were re-
moved from the downstream analyses. Potential chimera sequences were
surveyed using UCHIME (55). Next, phylogenetic assignment and statistical
analyses for the tag sequences were conducted. Sequencing tags were
aligned using the partial order algorithm (SINA; www.arb-silva.de/aligner/)
with the reference multiple alignment SILVA SSU Ref NR (56). All of the
aligned sequences were then clustered into operational taxonomic units
(OTUs) by 97% sequence identity using MOTHUR 1.31.1, with default
parameters according to the average-clustering algorithm. Output was then
parsed to produce occurrence tables of each OTU in each sample. The tax-
onomic position of each OTU was automatically assigned based on Blast
analysis in the QIIME software package (57) using SILVA Ref NR as a refer-
ence dataset of SSU rRNA gene sequences. The sequences were excluded
that are closely related to the potential contaminants belonging to genera
that inhabit soil and the human body and have been detected from negative
control experiments of environmental microbiology in the laboratory,
such as Bradyrhizobium, Brevundimonas, Burkholderiaceae, Delftia, Eryth-
robacter, Lactococcus, Legionella, Methylobacterium, Mycobacterium, Neis-
seria, Novosphingobium, Propionibacterium, Sphingobium, Sphingomonas,
Sphingopyxis, Staphylococcus, Stenotrophomonas, and Streptococcus. Se-
quences presenting with relatively high E-values (>1.0E-30) or low identity
(<90%) to the best match sequence were designated as other archaea or
bacteria, and sequences that did not present significant similarity to any ref-
erence sequences were also excluded from the analysis. α-Diversity indices
(rarefaction curves, Chao1, ACE, Shannon, Shannon evenness, and Simpson) in
each library and taxa/divisions were also calculated using MOTHUR 3.6. The
Jaccard and Bray–Curtis dissimilarity indices among each library were esti-
mated using the vegan package in the R-environment (vegan.r-forge.r-project.
org). Phylogenetic trees were constructed from the curated alignment of
representative sequences using the Clustal W program (www.clustal.org).
A weighted UniFrac distance matrix among core samples was constructed
from the phylogenetic tree and a sample mapping files that showed fre-
quency of the sequence tags within OTUs. Sequencing tags for each phy-
lum/class were collected from the entire dataset in accordance with the
taxonomic position of each OTU. The subdatasets were analyzed as in the
case of the entire dataset.
All SSU rRNA gene sequences obtained in this study were compared using
the UniFrac program (58) after omitting potential chimera sequences and
potential experimental contamination sequences. The alignment of each SSU
rRNA gene clone library was constructed using the SINA alignment service
(www.arb-silva.de/aligner/) (59). The phylogenetic tree of all SSU rRNA gene
sequence obtained in this study was constructed by Clustal X (www.clustal.
org), and the principal component analysis was carried out using the tree by
UniFrac. Representative SSU rRNA gene sequences were aligned and phylo-
genetically classified into certain taxonomic units using ARB (56). The phy-
logenetic tree of thaumarchaeal SSU rRNA genes was constructed by Clustal X
based on the unambiguous residues. Representative amoA sequences were
automatically aligned with closely related nucleotide sequences, and the
phylogenetic tree was then constructed using Clustal X v2.0 (60).
Quantitative PCR Analyses. Primers, probes and components of standard
mixture used for the quantitative PCR analyses are summarized in Table S1.
The abundance of each gene was quantified as an average of the duplicate or
triplicate analyses. Original DNA assemblages were only used for the quan-
tification of archaeal and prokaryotic SSU rRNA genes, and the amplified DNA
assemblages were used for the other genes. The abundance of nitrifier genes
in each water mass was estimated from the relative abundance of archaeal
SSU rRNA gene and a respective gene in the amplified DNA assemblages.
The 7500 Real Time PCR System (Applied Biosystems) was used for all of
the quantitative PCR analyses in this study. Quantification of the archaeal
and all prokaryotic SSU rRNA genes was performed using both the original
and amplified environmental DNA (Table S1). Detection and quantification
of nitrifiers were assessed using the amplified environmental DNA assemb-
lages. Detection of the alpha- and betaproteobacterial nxrA and alphapro-
teobacterial amoA was examined using Ex Taq polymerase (Takara Bio) with
a Mg2+ buffer as described previously (39) (Table S1). The abundance of
Nitrospina and Nitrospira SSU rRNA genes was also examined according to
methods described previously (39, 61). To identify group specific distribution
of each archaeal amoA group, novel primer sets were constructed based on
archaeal amoA gene sequences obtained in this study as follows: The nu-
cleotide alignments of the archaeal amoA gene were constructed by Clustal
X v2.0, and primers were designed that individually matched with the spe-
cific amoA sequences in groups A, Ba, Bb, and D (Table S1).
For the preparation of quantitative PCR mixtures, qPCR Quick GoldStar
Mastermix Plus (Eurogentec) was applied for SSU rRNA genes of archaea, all
prokaryotes and Nitrospira, and a SYBR Premix Ex Taq II (Takara Bio) for
amoA genes and the Nitrospina SSU rRNA gene. Amplified products from
quantitative PCR using SYBR Premix reagent were confirmed by agarose gel
electrophoresis. Amplification specificity was confirmed by clone analysis for
amplicons from several depths, particularly in the cases of amoA genes.
Dilution Counting for Heterotrophs. The abundance of culturable hetero-
trophs at each depth was evaluated onboard by serial dilution cultivation
methods with 1×, 1/100×, and 1/10,000× Marine Broth (Difco) using 96-well
microtiter plates at 5 °C for 2 mo under atmospheric pressure. For the di-
lution of Marine Broth, MJ synthetic seawater (62) was used. Then, SSU rRNA
gene sequences from the cultures obtained from the most diluted wells
were amplified with a primer set of B27F and U1492R (Table S1), and directly
sequenced using the ABI3730xl genetic analyzer with Big Dye v3.1 (Applied
Biosystems) according to the manufacturer’s recommendations.
ACKNOWLEDGMENTS. We thank the captain, crew, and science party of the
R/V Kairei (Japan Agency for Marine-Earth Science & Technology) during the
KR08-05 cruise; and the development and operational teams of the remotely
operated vehicle ABISMO. T.N. was supported in part by a Grant-in-Aid for
Scientific Research (B) (24370015) from the Japan Society for the Promotion
of Science.
1. Guidi L, et al. (2009) Effects of phytoplankton community on production, size and export
of large aggregates: A world-ocean analysis. Limnol Oceanogr 54(6):1951–1963.
2. Bochdansky AB, van Aken HM, Herndl GJ (2010) Role of macroscopic particles in deep-
sea oxygen consumption. Proc Natl Acad Sci USA 107(18):8287–8291.
Nunoura et al.
PNAS | Published online February 23, 2015 | E1235

3. Herndl GJ, Reinthaler T (2013) Microbial control of the dark end of the biological
pump. Nat Geosci 6(9):718–724.
4. Yokokawa T, Yang Y, Motegi C, Nagata T (2013) Large-scale geographical variation in
prokaryotic abundance and production in meso-and bathypelagic zones of the cen-
tral Pacific and Southern Ocean. Limnol Oceanogr 58(1):61–73.
5. Alonso-Sáez L, Galand PE, Casamayor EO, Pedrós-Alió C, Bertilsson S (2010) High bi-
carbonate assimilation in the dark by Arctic bacteria. ISME J 4(12):1581–1590.
6. Swan BK, et al. (2011) Potential for chemolithoautotrophy among ubiquitous bacteria
lineages in the dark ocean. Science 333(6047):1296–1300.
7. Jamieson AJ, Fujii T, Mayor DJ, Solan M, Priede IG (2010) Hadal trenches: The ecology
of the deepest places on Earth. Trends Ecol Evol 25(3):190–197.
8. Taira K, Kitagawa S, Yamashiro T, Yanagimoto D (2004) Deep and bottom currents in
the challenger deep, measured with super-deep current meters. J Oceanogr 60(6):
919–926.
9. Taira K, Yanagimoto D, Kitagawa S (2005) Deep CTD casts in the Challenger Deep,
Mariana Trench. J Oceanogr 61(3):447–454.
10. Nagata T, et al. (2010) Emerging concepts on microbial processes in the bathypelagic
ocean—Ecology, biogeochemistry, and genomics. Deep Sea Res Part II Top Stud
Oceanogr 57(16):1519–1536.
11. Bartlett DH (2009) Microbial life in the trenches. MTS J 43(5):128–131.
12. Tamburini C, Boutrif M, Garel M, Colwell RR, Deming JW (2013) Prokaryotic responses
to hydrostatic pressure in the ocean—A review. Environ Microbiol 15(5):1262–1274.
13. Glud RN, et al. (2013) High rates of microbial carbon turnover in sediments in the
deepest oceanic trench on Earth. Nat Geosci 6(4):284–288.
14. Takami H, Inoue A, Fuji F, Horikoshi K (1997) Microbial flora in the deepest sea mud of
the Mariana Trench. FEMS Microbiol Lett 152(2):279–285.
15. Kato C, et al. (1998) Extremely barophilic bacteria isolated from the Mariana
Trench, Challenger Deep, at a depth of 11,000 meters. Appl Environ Microbiol
64(4):1510–1513.
16. Fujioka K, Okino K, Kanamatsu T, Ohara Y (2002) Morphology and origin of the
Challenger Deep in the Southern Mariana Trench. Geophy Res Let 29(10):10-1–10-4.
17. Yoshida M, Takaki Y, Eitoku M, Nunoura T, Takai K (2013) Metagenomic analysis of
viral communities in (hado)pelagic sediments. PLoS ONE 8(2):e57271.
18. Mantyla AW, Reid JL (1978) Measurements of water characteristics at depths greater
than 10 km in the Marianas Trench. Deep-Sea Res 25(2):169–173.
19. Sigman DM, et al. (2009) The dual isotopes of deep nitrate as a constraint on the cycle
and budget of oceanic fixed nitrogen. Deep Sea Res Part I Oceanogr Res Pap 56(9):
1419–1439.
20. Giovannoni SJ, et al. (2005) Proteorhodopsin in the ubiquitous marine bacterium
SAR11. Nature 438(7064):82–85.
21. Gómez-Consarnau L, et al. (2007) Light stimulates growth of proteorhodopsin-con-
taining marine Flavobacteria. Nature 445(7124):210–213.
22. Ghai R, Mizuno CM, Picazo A, Camacho A, Rodriguez-Valera F (2013) Metagenomics un-
covers a new group of low GC and ultra-small marine Actinobacteria. Sci Rep 3:2471.
23. Chitsaz H, et al. (2011) Efficient de novo assembly of single-cell bacterial genomes
from short-read data sets. Nat Biotechnol 29(10):915–921.
24. Sheik CS, Jain S, Dick GJ (2014) Metabolic flexibility of enigmatic SAR324 revealed
through metagenomics and metatranscriptomics. Environ Microbiol 16(1):304–317.
25. Wright JJ, et al. (2014) Genomic properties of Marine Group A bacteria indicate a role
in the marine sulfur cycle. ISME J 8(2):455–468.
26. Chen Y, et al. (2008) Revealing the uncultivated majority: Combining DNA stable-
isotope probing, multiple displacement amplification and metagenomic analyses of
uncultivated Methylocystis in acidic peatlands. Environ Microbiol 10(10):2609–2622.
27. Bodelier PLE, Kamst M, Meima-Franke M, Stralis-Pavese N, Bodrossy L (2009) Whole-
community genome amplification (WCGA) leads to compositional bias in methane-
oxidizing communities as assessed by pmoA-based microarray analyses and QPCR.
Environ Microbiol Rep 1(5):434–441.
28. Sintes E, Bergauer K, De Corte D, Yokokawa T, Herndl GJ (2013) Archaeal amoA gene
diversity points to distinct biogeography of ammonia-oxidizing Crenarchaeota in the
ocean. Environ Microbiol 15(5):1647–1658.
29. Blackburne R, Vadivelu VM, Yuan Z, Keller J (2007) Kinetic characterisation of
an enriched Nitrospira culture with comparison to Nitrobacter. Water Res 41(14):
3033–3042.
30. Martens-Habbena W, Berube PM, Urakawa H, de la Torre JR, Stahl DA (2009) Am-
monia oxidation kinetics determine niche separation of nitrifying Archaea and Bac-
teria. Nature 461(7266):976–979.
31. Merbt SN, et al. (2012) Differential photoinhibition of bacterial and archaeal am-
monia oxidation. FEMS Microbiol Lett 327(1):41–46.
32. Gubry-Rangin C, et al. (2011) Niche specialization of terrestrial archaeal ammonia
oxidizers. Proc Natl Acad Sci USA 108(52):21206–21211.
33. Mosier AC, Francis CA (2008) Relative abundance and diversity of ammonia-oxidizing
archaea and bacteria in the San Francisco Bay estuary. Environ Microbiol 10(11):
3002–3016.
34. Mincer TJ, et al. (2007) Quantitative distribution of presumptive archaeal and bac-
terial nitrifiers in Monterey Bay and the North Pacific Subtropical Gyre. Environ Mi-
crobiol 9(5):1162–1175.
35. Santoro AE, Casciotti KL, Francis CA (2010) Activity, abundance and diversity of ni-
trifying archaea and bacteria in the central California Current. Environ Microbiol
12(7):1989–2006.
36. Füssel J, et al. (2012) Nitrite oxidation in the Namibian oxygen minimum zone. ISME J
6(6):1200–1209.
37. Hoffmann F, et al. (2009) Complex nitrogen cycling in the sponge Geodia barretti.
Environ Microbiol 11(9):2228–2243.
38. Off S, Alawi M, Spieck E (2010) Enrichment and physiological characterization of a
novel Nitrospira-like bacterium obtained from a marine sponge. Appl Environ Mi-
crobiol 76(14):4640–4646.
39. Nunoura T, et al. (2013) Molecular biological and isotopic biogeochemical prognoses
of the nitrification-driven dynamic microbial nitrogen cycle in hadopelagic sediments.
Environ Microbiol 15(11):3087–3107.
40. Baltar F, et al. (2009) Evidence of prokaryotic metabolism on suspended particulate
organic matter in the dark waters of the subtropical North Atlantic. Limnol Oceanogr
54(1):182–193.
41. Aristegui J, Gasol JM, Duarte CM, Herndl GJ (2009) Microbial oceanography of the
dark ocean’s pelagic realm. Limnol Oceanogr 54(5):1501–1529.
42. Kawagucci S, et al. (2012) Disturbance of deep-sea environments induced by the M9.0
Tohoku Earthquake. Sci Rep 2:270.
43. Otosaka S, Noriki S (2000) REEs and Mn/Al ratio of settling particles: Horizontal
transport of particulate material in the northern Japan Trench. Mar Chem 72(2-4):
329–342.
44. Yoshida H, et al. (2009) The ABISMO mud and water sampling ROV for surveys at
11,000 m depth. MTS J 43(5):87–96.
45. Sigman DM, et al. (2001) A bacterial method for the nitrogen isotopic analysis of
nitrate in seawater and freshwater. Anal Chem 73(17):4145–4153.
46. Casciotti KL, Sigman DM, Hastings MG, Böhlke JK, Hilkert A (2002) Measurement of
the oxygen isotopic composition of nitrate in seawater and freshwater using the
denitrifier method. Anal Chem 74(19):4905–4912.
47. McIlvin MR, Casciotti KL (2011) Technical updates to the bacterial method for nitrate
isotopic analyses. Anal Chem 83(5):1850–1856.
48. Böhlke JK, Coplen TB (1995) Reference and Intercomparison Materials for Stable
Isotopes of Light Elements. IAEA TECDOC 825 (International Atomic Energy Agency,
Vienna), pp 51–66.
49. Böhlke JK, Mroczkowski SJ, Coplen TB (2003) Oxygen isotopes in nitrate: New ref-
erence materials for 18O:17O:16O measurements and observations on nitrate-water
equilibration. Rapid Commun Mass Spectrom 17(16):1835–1846.
50. Nunoura T, et al. (2012) Microbial diversity in deep-sea methane seep sediments
presented by SSU rRNA gene tag sequencing. Microbes Environ 27(4):382–390.
51. Yu Y, Breitbart M, McNairnie P, Rohwer F (2006) FastGroupII: A web-based bioinformatics
platform for analyses of large 16S rDNA libraries. BMC Bioinformatics 7:57.
52. Quince C, et al. (2009) Accurate determination of microbial diversity from 454 py-
rosequencing data. Nat Methods 6(9):639–641.
53. Schloss PD, et al. (2009) Introducing MOTHUR: Open-source, platform-independent,
community-supported software for describing and comparing microbial communities.
Appl Environ Microbiol 75(23):7537–7541.
54. Schloss PD, Gevers D, Westcott SL (2011) Reducing the effects of PCR amplification
and sequencing artifacts on 16S rRNA-based studies. PLoS ONE 6(12):e27310.
55. Edgar RC, Haas BJ, Clemente JC, Quince C, Knight R (2011) UCHIME improves sensi-
tivity and speed of chimera detection. Bioinformatics 27(16):2194–2200.
56. Yilmaz P, et al. (2014) The SILVA and “All-species Living Tree Project (LTP)” taxonomic
frameworks. Nucleic Acids Res 42(Database issue, D1):D643–D648.
57. Caporaso JG, et al. (2010) QIIME allows analysis of high-throughput community se-
quencing data. Nat Methods 7(5):335–336.
58. Lozupone C, Hamady M, Knight R (2006) UniFrac—An online tool for comparing microbial
community diversity in a phylogenetic context. BMC Bioinformatics 7(1):371.
59. Pruesse E, Peplies J, Glöckner FO (2012) SINA: Accurate high-throughput multiple
sequence alignment of ribosomal RNA genes. Bioinformatics 28(14):1823–1829.
60. Larkin MA, et al. (2007) Clustal W and Clustal X version 2.0. Bioinformatics 23(21):
2947–2948.
61. Graham DW, et al. (2007) Experimental demonstration of chaotic instability in bi-
ological nitrification. ISME J 1(5):385–393.
62. Sako Y, Takai K, Ishida Y, Uchida A, Katayama Y (1996) Rhodothermus obamensis sp.
nov., a modern lineage of extremely thermophilic marine bacteria. Int J Syst Bacteriol
46(4):1099–1104.
E1236 | www.pnas.org/cgi/doi/10.1073/pnas.1421816112
Nunoura et al.