

atmosphere
Article
Statistical Evidence for Managing Forest Density in
Consideration of Natural Volatile Organic Compounds
Yeji Choi 1 , Geonwoo Kim 1,* , Sujin Park 1 , Sangtae Lee 2, Soojin Kim 1 and Eunsoo Kim 1
1 Forest Human Service Division, Future Forest Strategy Department, National Institute of Forest Science,
Seoul 02455, Korea; usmile.choi@gmail.com (Y.C.); snowshoe@korea.kr (S.P.); kimsoojinsj@korea.kr (S.K.);
euncarp2@gmail.com (E.K.)
2 Forest Technology and Management Research Center, National Institute of Forest Science,
Pocheon 11186, Korea; lst9953@korea.kr
* Correspondence: bkim5020@korea.kr; Tel.: +82-02-961-2862
Citation: Choi, Y.; Kim, G.; Park, S.;
Lee, S.; Kim, S.; Kim, E. Statistical
Evidence for Managing Forest
Density in Consideration of Natural
Volatile Organic Compounds.
Atmosphere 2021, 12, 1113. https://
doi.org/10.3390/atmos12091113
Abstract: Rapid deforestation, coupled with the growing population seeking forest therapy, urges
the necessity for research on how to maximize forests’ therapeutic functions when cultivating
damaged or unmanaged forests. This study was formulated to provide a basis for forest stand density
management to maximize the therapeutic effects of forests with a focus on natural volatile organic
compounds (NVOCs), a representative component of forest therapy through analysis of variance and
regression analyses. The results of this study revealed all studied stand densities yield the highest
total NVOC (TNVOC) emissions in summer, especially in the study site which has a forest density
of 700/ha. In addition, treeless areas (0/ha) were found to have the most significant difference in
average NVOC emissions when cultivated at a density of 700/ha. When managing forests with a
density of 900/ha to 1000/ha, it has been shown that it is most desirable, in terms of therapeutic
function efficiency, to control a density of 500/ha to 700/ha. Finally, regression equations for the
five experimental sites with significant explanatory power were derived. Based on the results of the
conducted analyses, 700/ha of forest density is recommended to maximize the therapeutic effects of
forests, compared to other ranges of forest density.
Keywords: stand density; forest management; silviculture; forest thinning; forest therapy; NVOC;
phytoncide; terpenes; microclimate; Pinus koraiensis
Academic Editors: Stéphane Le Calvé
and Alexander V. Chernokulsky
Received: 7 July 2021
Accepted: 27 August 2021
Published: 30 August 2021
Publisher’s Note: MDPI stays neutral
with regard to jurisdictional claims in
published maps and institutional affil-
iations.
Copyright: © 2021 by the authors.
Licensee MDPI, Basel, Switzerland.
This article is an open access article
distributed under the terms and
conditions of the Creative Commons
Attribution (CC BY) license (https://
creativecommons.org/licenses/by/
4.0/).
1. Introduction
Since 2010, there has been a steady loss of forests globally at a rate of ten million
hectares per year [1]. When considering the amount of newly cultivated forest areas
and combining it with the total loss, then the rate is only brought down to 4.7 million
hectares per year [1]. With this continuing rate of loss each year, countries are now focusing
their efforts on forest cultivation to grow healthy and superior forests. Researchers are
conducting diverse studies on various ways to afforest forests suitable for their needs
and purposes, such as forests that maximize wood production or therapeutic effects [2–5].
The cultivating forestry plantations are projects to cultivate and grow forests so that
artificial forests and natural forests can grow to be healthier and more superior than
untouched forests. Depending on the age and condition of the forest, several things can be
performed, such as weeding, planting young trees, thinning, natural forest nurturing, and
removing winders [6]. Forest cultivation has several positive effects, such as enhancing
water supply functions, increasing carbon dioxide absorption, improving the ecological
health of forests, raising the economic value of forests, and preventing wildfires [6–15].
Additionally, forests grown through the cultivating forestry plantation projects have a
positive function for human health. Previous studies have shown that tended forests
have more of a positive physical and mental impact on visitors when compared to wild
forests. Furthermore, visitors to the tended forests experience increased metabolic activity
Atmosphere 2021, 12, 1113. https://doi.org/10.3390/atmos12091113
https://www.mdpi.com/journal/atmosphere

Atmosphere 2021, 12, 1113
2 of 22
and increased physical vitality [16,17]. Prior studies of forest thinning, among several
forest management methods, have shown that it is a viable method for expanding the
benefits that a forest provides to both human health and the natural ecosystem. The forest
thinning projects are well known for its positive effects, such as improving forest habitat
value, increasing forest carbon absorption and storage rates, and facilitating forest water
supply by controlling the leaf area index; thus, allowing forests to respond more flexibly to
climate change and preventing forest fires from spreading rapidly [18–22]. As such, forest
stand density control is beneficial for forest ecosystems and its economic value protection.
Furthermore, density control through forest thinning was found to have positive effects
on human health which include physiological relaxation, stress reduction, anxiety and
anger relief, depression improvement, vitalization, emotional stability, and mental health
recovery [23–32]. Therefore, it is expected that the adjustment of forest density through
forest cultivation will maximize the forest healing effects suitable for the characteristics
and needs of participants who partake in forest therapy programs.
Forest therapy includes a plethora of factors, and phytoncide is a forest component
that, according to current research, appears to be relevant in the health effects induced by
forest exposure [33,34]. Phytoncide is a complex mixture of chemicals secreted by trees to
protect themselves from external harmful factors and is also a representative therapeutic
factor in nature [35–37]. Phytoncide can be classed as a natural volatile organic compounds
(NVOC), and terpenes, a class of chemicals found in phytoncide mixtures, are found within
NVOCs. Terpenes are notable for improving people’s health, which occurs when individ-
uals are exposed to the atmosphere where terpenes are scattered. Phytoncide has been
shown to benefit both physiological and psychological health [38–44]. Phytoncide increases
activities of natural killer (NK) cells [38], has antioxidant and antibacterial effects [39], and
lowers blood pressure, pulse rate, and cortisol levels [40–42]. As for the psychological
effects, it reduces stress and improves one’s mood [40,42–44]. When considering the effects
of the factors that make up phytoncide, alpha-pinene accounts for most of the monoter-
pene produced in forests, and several prior studies have demonstrated anti-inflammatory,
antioxidant, and antianxiety effects [45–47]. In addition, several monoterpenes, including
limonene and beta-pinene, have been proven to have a positive effect when it comes to
diseases by increasing immunity, alleviating cardiovascular disease, and improving depres-
sion [48–54]. As such, phytoncide is attracting attention as an important factor in forest
therapy due to its various health benefits, with studies also being conducted on NVOCs
emitted by forests.
NVOCs, which have these various healing effects, have been identified through sev-
eral prior studies. Studies measuring and analyzing forest emissions of NVOCs have
shown that monoterpenes are significantly correlated with temperature and solar radiation,
with highest concentrations in the summer [33,55]. In addition, phytoncide concentrations
are generally the highest in the early morning and noon, with diurnal cycle [33,34,55–57].
On the other hand, the emission characteristics of NVOCs vary depending on the den-
sity of forests; there were several previous studies analyzing the relationship between
forest density control and NVOC emissions conducted for similar purposes as the aim of
this study. Their findings show that when forest density in dense forests was adjusted,
monoterpene emissions increased significantly, and the highest concentration of phyton-
cide has been found to be emitted from forest environments that are neither too dense
nor too open [58–60]. As mentioned above, since NVOCs have different emissions and
compositions depending on the forest stand density, several studies have conducted ex-
periments attempting to link specific forest density and natural environments with their
corresponding forests’ therapeutic effects. However, most of the relevant studies presented
were only one-off studies, and phytoncide was measured at a low frequency of about once
a season or once a day for one range of forest density. Furthermore, studies conducted
in conjunction with changes in forest density through forest cultivation and phytoncide
emissions are very rare, and studies with a focus on microclimate factors and phytoncide’s
link to forest density are also rarely conducted. As mentioned earlier, forest density plays
Atmosphere 2021, 12, 1113
3 of 22
a vital role in creating forest therapy spaces, and the size of a forest’s therapeutic effect
varies greatly depending on the level of forest density. However, exactly what mechanism
or causative material increases a forest’s therapeutic effects after the forest density has
been controlled has not yet been identified. Therefore, this study aims to demonstrate
the relationship between forest density control and forest therapy effects by conducting
long-term follow-up studies on several ranges of forest density, and from those findings,
select the most suitable forest density for cultivation of forestry plantation, with a focus on
phytoncide. As a result of this study, a forest density of 700/ha is the most suitable forest
density to maximize the therapeutic effects of forests when focusing on NVOC emissions.
2. Materials and Methods
2.1. Study Site
The study was conducted in Pinus koraiensis Siebold et Zucc. forests of Gwangneung
Experimental Forest, managed by National Forest Research Institute located in Pocheon,
Gyeonggi-do, South Korea. The geographical locations of the study sites are 37◦47 12.786 N,
127◦11 21.0876 E, and they are located at 150 m to 170 m above sea level. Gwangneung
Experimental Forest has a total area of 1072 ha, of which 515 ha of the coniferous forest,
including P. koraiensis forests, accounts for 48% of the total area. Gwangneung Experi-
mental Forest was designated as a UNESCO (United Nations Educational, Scientific and
Cultural Organization) Biosphere Reserve in 2010 and is recognized worldwide for its
importance [61]. In addition, Gwangneung Experimental Forest is home to more than a
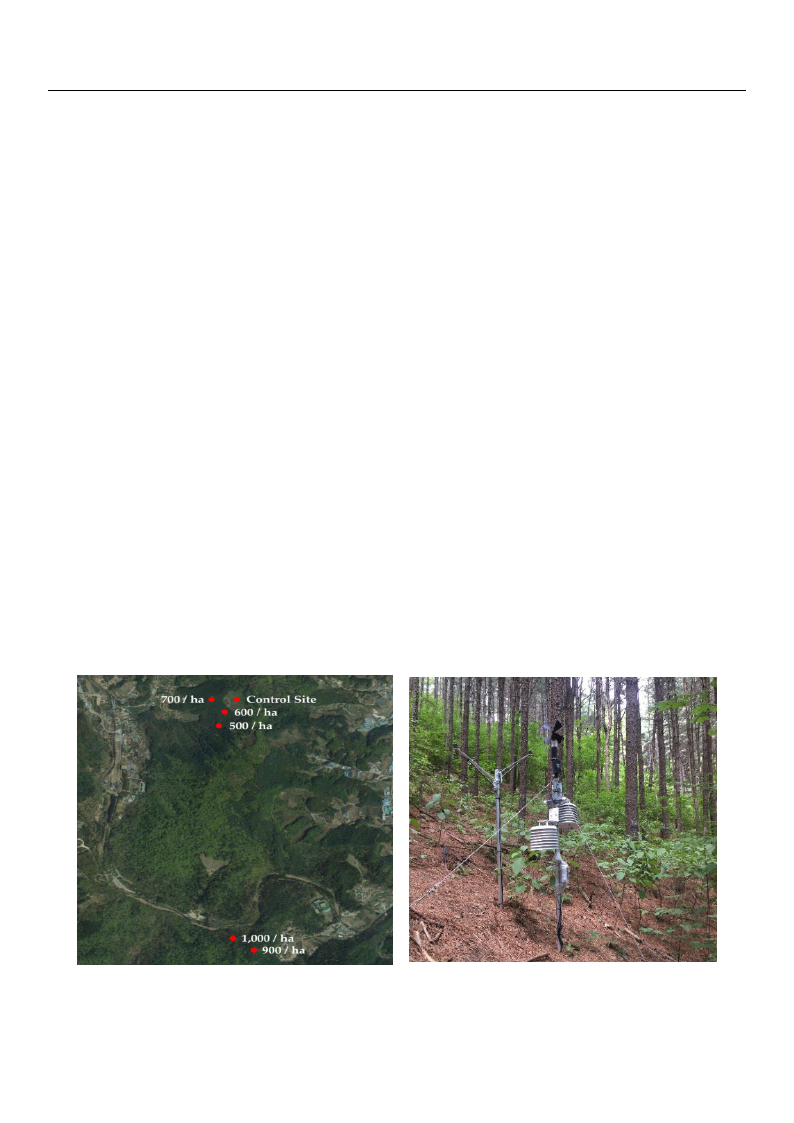
thousand species of plants and over 3000 species of animals [62]. In this study, the research
was conducted on five experimental areas with 500, 600, 700, 900, and 1000 tree counts per
hectare of P. koraiensis forests, and control areas with zero tree counts per hectare outside
the research site (Figure 1). The study sites, including the control site, 500/ha, 600/ha,
and 700/ha, are located within 100 m of the center of the 600/ha site, while the 900/ha
and 1000/ha study sites are located within 100 m of each other. The distance between the
500/ha site and the 1000/ha site is about 2 km. The average age of P. koraiensis trees in the
site were 31 to 40 years, with an average diameter at breast height of 27 cm and an average
height of 21 m. In addition, dominant wind directions in the study sites during the study
period were south-southeast (700/ha, 900/ha, and 1000/ha), south (0/ha and 600/ha), and
south-southwest (500/ha).
(a)
(b)
Figure 1. Images of study sites: (a) P. koraiensis forests of Gwangneung Experimental Forest; (b) field experiments on
measurements of NVOCs and microclimate factors of P. koraiensis forests.

Atmosphere 2021, 12, 1113
4 of 22
2.2. Measurement Methods
In this study, NVOC emissions and microclimate environment factors data were
measured in six sites (five experimental and one control) to determine the impact of
forest stand density control on phytoncide and microclimate factors. In order to reduce
measurement errors for each survey site, experiments were conducted at three different
plots with a radius of 10 m of each survey site. This study was conducted from September
2015 to December 2017, and measurements were taken twice a month. NVOCs were
measured from March to December, and microclimate environment factors were measured
from March to September due to the winter entry policies of the studied forest. Detailed
indicators measured are shown in Table 1, and a total of 17 NVOC compounds were
selected out of 19 total detected NVOC compounds. Two compounds, α-Cedrene and
Geranyl acetate, were excluded because the concentration was too small; therefore, most
collected samples could not detect it.
Table 1. NVOCs and microclimate environment measurement factors.
NVOCs
3-Carene, Camphene, Camphor,
d-Fenchone, d-Limonene, Farnesene,
p-Cymene, Phellandrene, Pulegone,
Sabinene, Valencene, α-Pinene,
α-Terpinene, α-Terpinolene, β-Myrcene,
β-Pinene, γ-Terpinene
Microclimate Environment
Temperature, Humidity, Solar Radiation, PAR
(Photosynthetically Active Radiation),
Wind Speed
2.2.1. Natural Volatile Organic Compounds (NVOCs)
NVOCs were collected every two hours from morning (9:00) to sunset (17:00) in
consideration of the peak visitation times for the forests. According to geographical
characteristics, NVOC measurements were carried out at three different circular plots
located within five meters of the central tree at each of the six study sites. Five pumps were
installed per each plot, considering the vegetation characteristics. The adsorption tube
method was used to collect the samples. Adsorption was carried out in tubes containing
150 mg of Tenax TA from Markes (Sacramento, CA, USA). NVOC was measured using
a µg/m3 unit, where m3 represents the volume of the measurement sites’ surrounding
environment. The total air volume of 9 L collected over an hour was converted to m3, and
a detailed description follows.
The sample capture system was a mini pump (MP-30KN, Sibata, Japan), and the
calibration was preceded by an adsorption error measurement before using the flow meter.
A total volume of 9 L of NVOC was collected at a flow rate of 150 mL/min. A previous
study focusing on the sampling amount, conducted to make NVOC measurements in the
forest more accurate and efficient, discovered that 9 L produced the most efficient results
when compared to 1, 3, 6, 9, 12, 24, and 48 L; thus, this study was also conducted with an
air volume of 9 L [63]. The sampling equipment was mounted on a tripod 1.5 m above
the ground, and the average value was calculated by repeating the process at each site.
To avoid artificial errors when in contact with the tube, disposable polyethylene gloves
and antibacterial masks were used during the experiment. The sample tubes were kept
at a temperature below 4 ◦C for 48 h after sampling before being analyzed (Table 2). To
reduce the possibility of error, the value of the tubes collected without Tenax TA inside
were also reflected.
The samples were analyzed qualitatively and quantitatively using a gas chromatography–
mass spectrometer (7890N-5975, Agilent, Santa Clara, CA, USA) equipped with a ther-
mal desorption device (GC-MSD, Gerstel TDS, Gerstel, Germany). The adsorption tube
substances are concentrated in a low-temperature cryofocusing system, which takes high-
purity helium gas from a thermal desorption device at a rate of 1 mL/min. The system
desorbed the gas for 3 min at 210 ◦C while maintaining a temperature of −30 ◦C. After,

Atmosphere 2021, 12, 1113
5 of 22
the compounds were then heated for 3 min at 220 ◦C before being injected into a GC
spectrometer and detected with an MSD.
Table 2. The conditions for the operating parameters for NVOC.
Parameters
Column
Carrier gas flow
Injection mode
Injection port temp.
Transfer line temp.
Over temp. program
Post run
Conditions
HP-INNOWAX (60 m × 0.25 mmL D × 0.25 µm, film thickness)
He at 1 mL/min
Pulsed Splitless
210 ◦C
210 ◦C
Initial
Rate
Final
40 ◦C
3 min 8 ◦C/min 220 ◦C
3 min
40 ◦C
220 ◦C, 5 min
2.2.2. Microclimate Environments
Temperature, humidity, wind speed, solar radiation, and photosynthetically active
radiation (PAR) were measured at each of the six study sites in order to collect microclimate
environment factors. Additionally, the site’s direction and slope were calculated in terms of
locational environment. Using a portable multifunction meter, the physical characteristics
of the site environment were recorded at 5 min intervals (HOBO-U23 V2, Onset, Bourne,
MA, USA). Solar radiation sensors (S-LIB-M003, Onset, Bourne, MA, USA) and photosyn-
thetically active radiation sensors (S-LIA-M003, Onset, Bourne, MA, USA) were placed in
the same location and tracked throughout the experiment.
In order to obtain wind velocity data at each designated site, a wind monitoring sensor
(Wind Monitor O5103-45, R.N.Y., Logan, UT, USA) was also mounted in consideration of the
geological features. The meter was balanced at a height of 1.5 m on a tripod approximately
5 m away from a mini pump, and the digitalized measurement results were saved and
converted for the study. The findings were evaluated using the HOBO-ware Pro software
(Onset, Bourne, MA, USA). To reduce the possibility of measurement errors, data saved
5 min before and after each measurement were excluded from the study.
2.2.3. Calibration Curve
A few measures can be used to validate both the analysis device and the procedures.
The calibration curve was created using 20 different species of standard chemicals, in-
cluding α-pinene and β-pinene. Using the calibration curve to calculate each element’s
mass number and the square of its rate of diluting standard materials, the majority of
the materials have a linearity greater than 0.997. Examples include α-pinene (R2 = 0.997),
β-pinene (R2 = 0.998), and d-limonene (R2 = 0.999). Experiments with these materials
are highly reproducible in terms of the linear correlation coefficient, making them ideal
for research.
2.3. Analysis Methods
The analysis was conducted by using R 4.0.5 and RStudio. “DescTools”, “lmtest”,
“gvlma”, “lm.beta”, “pheatmap”, “PMCMRplus” and other R packages were used for the
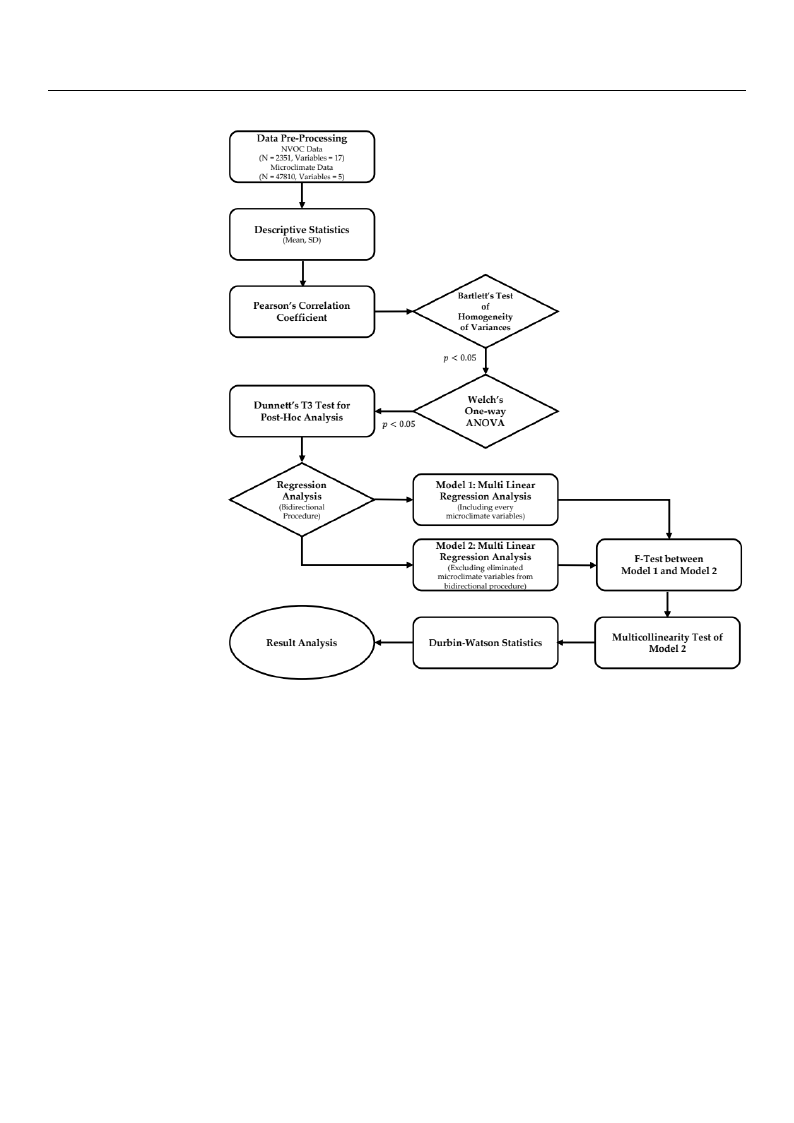
analysis. In this study, data were collected for a total of 17 NVOC compounds and 5 mi-
croclimate environmental factors, with samples of 2351 and 47,810, respectively (Figure 2).
The data observed at three different measurement plots for each forest density were aggre-
gated into one, and the data was used for the analysis of the results through preprocessing
processes such as missing value and outlier elimination. For NVOCs, we calculated total
NVOC (TNVOC) values that could represent 17 different NVOC compounds and carried
out descriptive statistics including the average and standard deviation of NVOCs and
microclimate environmental factors.
Atmosphere 2021, 12, 1113
6 of 22
Figure 2. Flow diagram of analysis processes.
In order to understand the NVOC emission characteristics of P. koraiensis forests,
annual TNVOC emissions at the site were examined, and differences of annual TNVOC
emissions by forest density were also investigated. In addition, microclimate environment
analysis of P. koraiensis forests was carried out according to forest density. Subsequently,
correlation analyses between TNVOC and microclimate factors by forest density was
conducted to explore the relationship between NVOCs and microclimate factors by forest
density of P. koraiensis forests.
Next, to find out the effect of forest density on TNVOC emissions, a one-way analysis
of variance (one-way ANOVA) was conducted. Since there were more than 30 samples,
the normality test was omitted by the central limit theorem, and the Bartlett’s test of
homogeneity of variance was performed, but the result did not satisfy the homoscedasticity.
Therefore, Welch’s one-way ANOVA was executed, and results confirmed significant
differences between forest densities. Accordingly, Dunnett’s T3 test for post hoc analysis
was conducted to determine the statistical significance between the control group with
zero tree counts per hectare and experimental groups with 500, 600, 700, 900, and 1000 tree
counts per hectare.
Finally, multiple regression analysis using the bidirectional procedure method was
conducted to investigate the effects of microclimate factors on phytoncide emissions by
forest density, and a phytoncide emission prediction equation was formulated using micro-
Atmosphere 2021, 12, 1113
7 of 22
climate factors by forest density. It is also expected that the general public will be easily
able to calculate the amount of phytoncide emissions of the selected study site with forest
density that can maximize the forest healing effects. Multiple regression analyses were per-
formed for each forest density, totaling six times. Model 1, a regression analysis containing
all five microclimate factors, and Model 2, a regression analysis conducted by selecting
only significant microclimate factors through bidirectional procedures, were established,
and F-tests were conducted to determine whether microclimate factors removed from
Model 2 had statistically significant effects. Multicollinearity tests were also conducted to
determine the correlation between independent variables in Model 2, and finally, Durbin–
Watson statistics were performed to verify autocorrelation. Based on the regression results
validated in this way, we establish a final regression equation by forest density.
3. Results
3.1. Characteristics of NVOCs at P. Koraiensis Forests by Forest Density
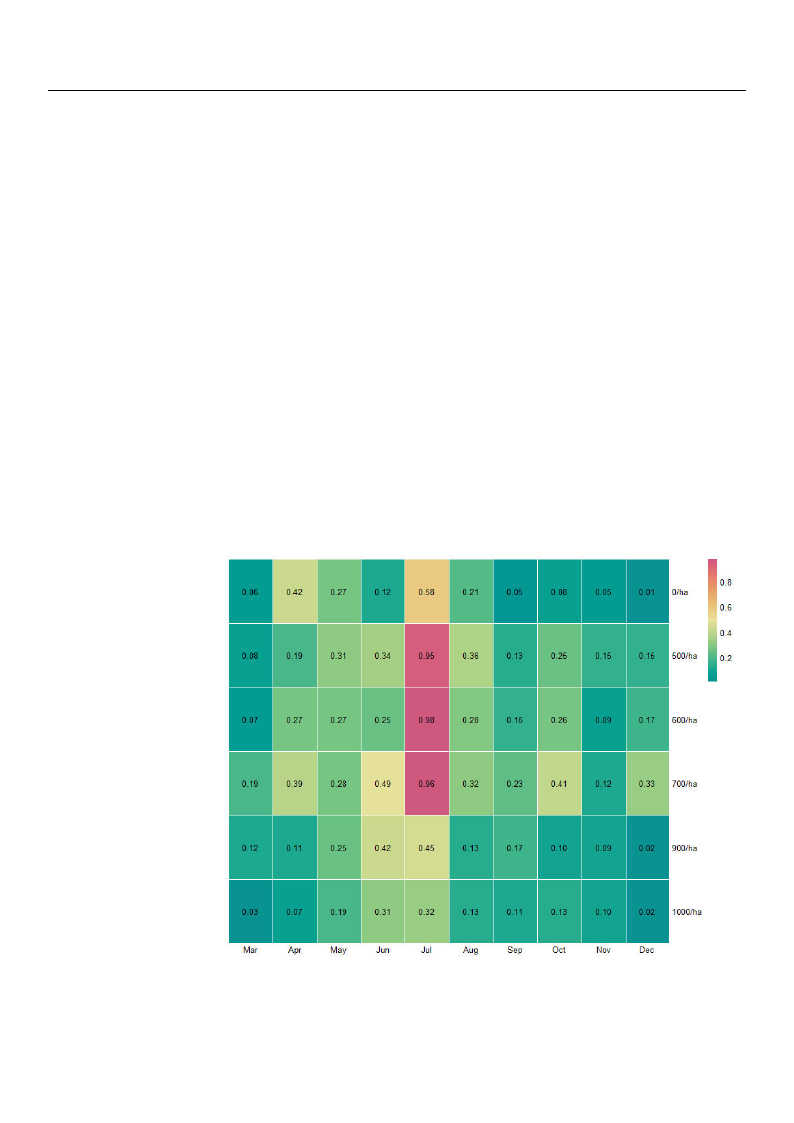
The average monthly total NVOC (TNVOC) emissions from P. koraiensis forests are
shown in Figure 3. The highest concentration of TNVOC was found to be emitted in
μ
summeμr from all the suμrveyed sites, anμd July recorded higherμphytoncide emissions than
other months. In
each survey sites,
addition, as a result of adding up monthly
0, 500, 600, 700, 900, and 1000 tree count per
hTeNctVarOeCweemrei1ss.8io4nµsgf/rmom3μ,
2μ.92 µg/m3, 2.7μ9 µg/m3, 3.72 µμg/m3, 1.87 µg/m3, aμnd 1.41 µg/m3, respectively. The
standard deviation of the above calculated results of each survey sites were 0.19 µg/m3,
0.25 µg/m3, 0.26 µg/m3, 0.23 µg/m3, 0.14 µg/m3, and 0.11 µg/m3, respectively. Annual
TNVOC emissions in 700/ha were the highest, followed by 500/ha, 600/ha, 900/ha, 0/ha,
and 1000/ha. In general, it can be seen that the yield of NVOC emission is high at forest
densities between 500 and 700 tree count per hectare.
Figure 3. Heatmap of monthly average TNVOC (µg/m3) emissionsμaccording to forest density.
Furthermore, Figure 4, which explains the monthly deviation in TNVOC emissions at
the surveyed sites by forest density, shows the largest deviation in monthly phytoncide
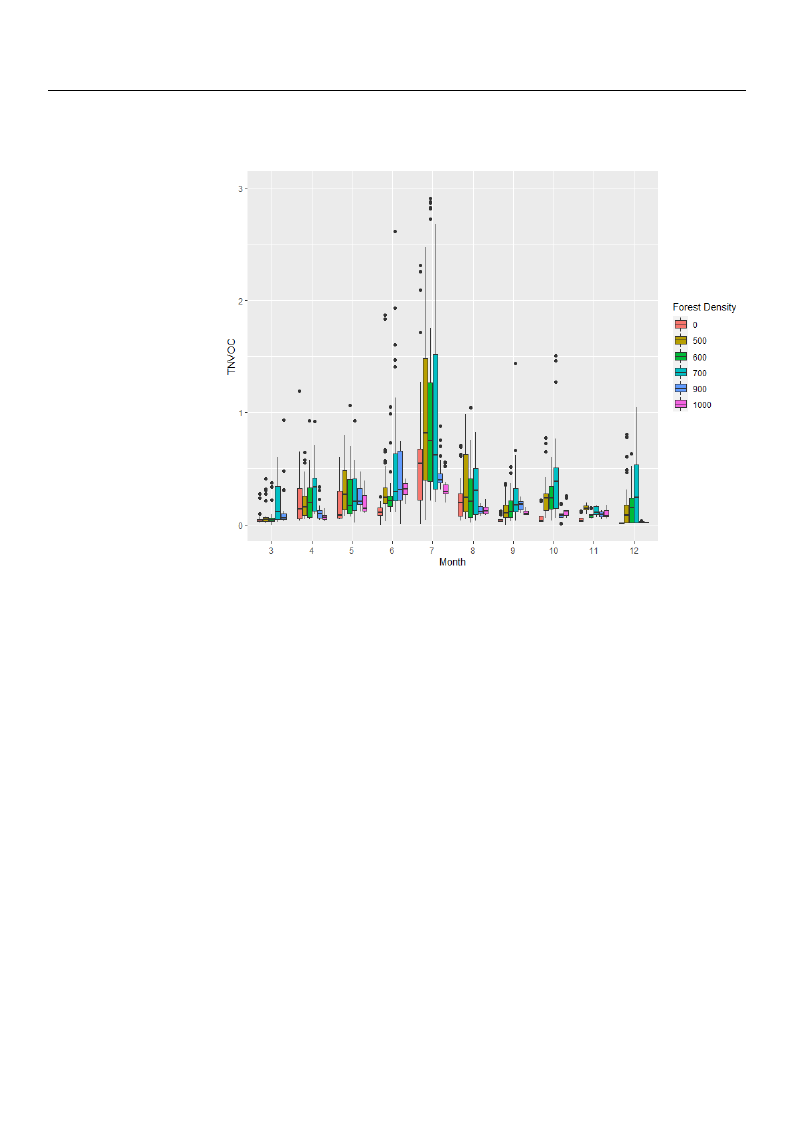
Atmosphere 2021, 12, 1113
8 of 22
emissions at the 700/ha site. In addition, the regions of 0, 900, and 1000 tree count per
hectare were found to have relatively small deviations compared to other study sites.
Figure 4. Boxplot of monthly TNVOC (µg/mμ3) emissions according to forest density.
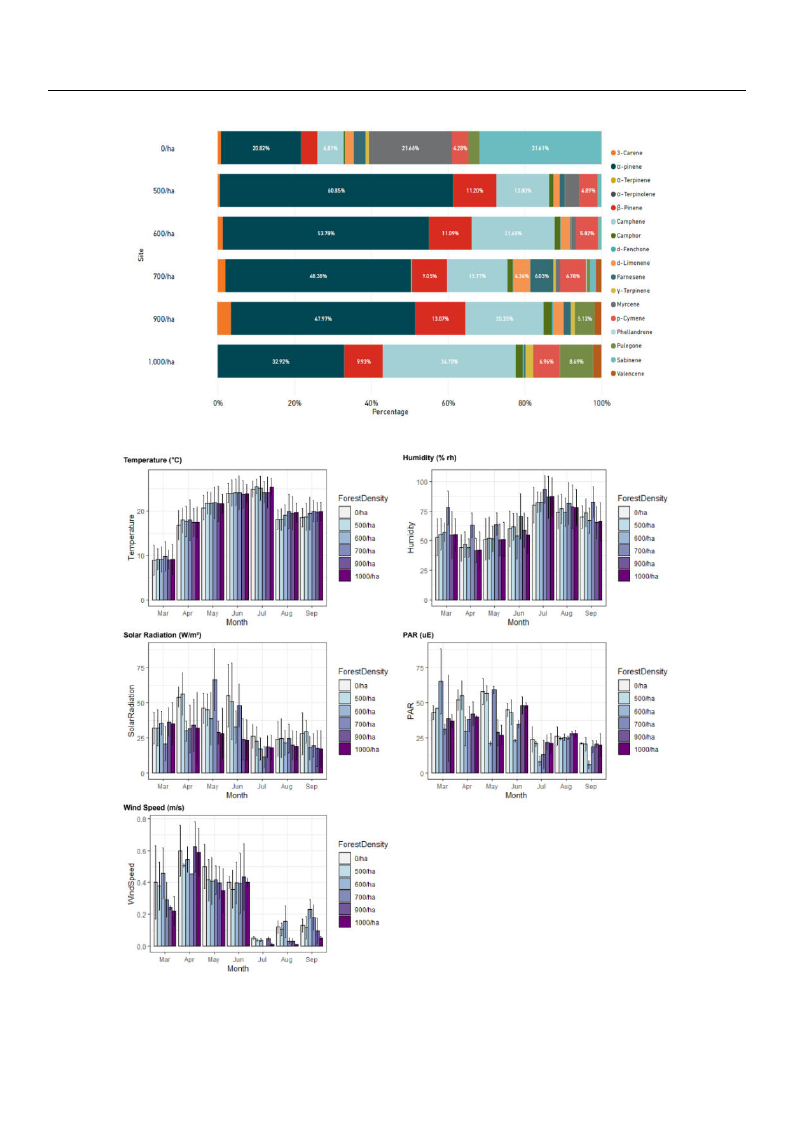
Regarding the types of NVOCs detected for each study site, generally α-Pinene,
Camphene, and β-Pinene were detected at high concentrations ratio as shown in Figαure 5.
Sabinene andβMyrcene were detected at higher rates in the 0/ha region than in the other
regions, and Farnesene was detected at higher rates in the 700/ha region than in other
regions. In addition, while p-Cymene was detected in other sites, no p-Cymene was
detected in 900/ha areas, and no 3-Carene and d-Limonene were detected in 1000/ha sites.
At the 500/ha, 600/ha, and 700/ha sites, all 17 types of NVOCs were detected, although
the proportions of phytoncide components were different.
3.2. Characteristics of Microclimate Environments at P. Koraiensis Forests by Forest Density
The results of examining fluxes in forest density and monthly microclimate factors
in P. koraiensis forests are described in Figure 6. In the case of temperature, there was no
significant difference depending on forest density, and in case of humidity, the 700/ha
surveyed site was significantly higher than other research sites with different forest density.
In the case of solar radiation, it tended to appear at high levels in areas with low forest
density, 0/ha and 500/ha, while the 700/ha area was notably high in May and June.
Regarding levels of photosynthetically active radiation, 600/ha and 700/ha sites generally
showed lower values than other study sites. In addition, wind speeds were generally
higher in areas with low forest density, except for April and June.
Atmosphere 2021, 12, 1113
9 of 22
Figure 5. One hundred percent stacked bar charts of detected NVOCs by study sites.
Figure 6. Bar charts of monthly microclimate environment fluxes according to forest density. Units of each microclimate
factors: temperature (◦C), humidity (% rh), solar radiation (W/m2), PAR (uE), and wind speed (m/s).
Atmosphere 2021, 12, 1113
10 of 22
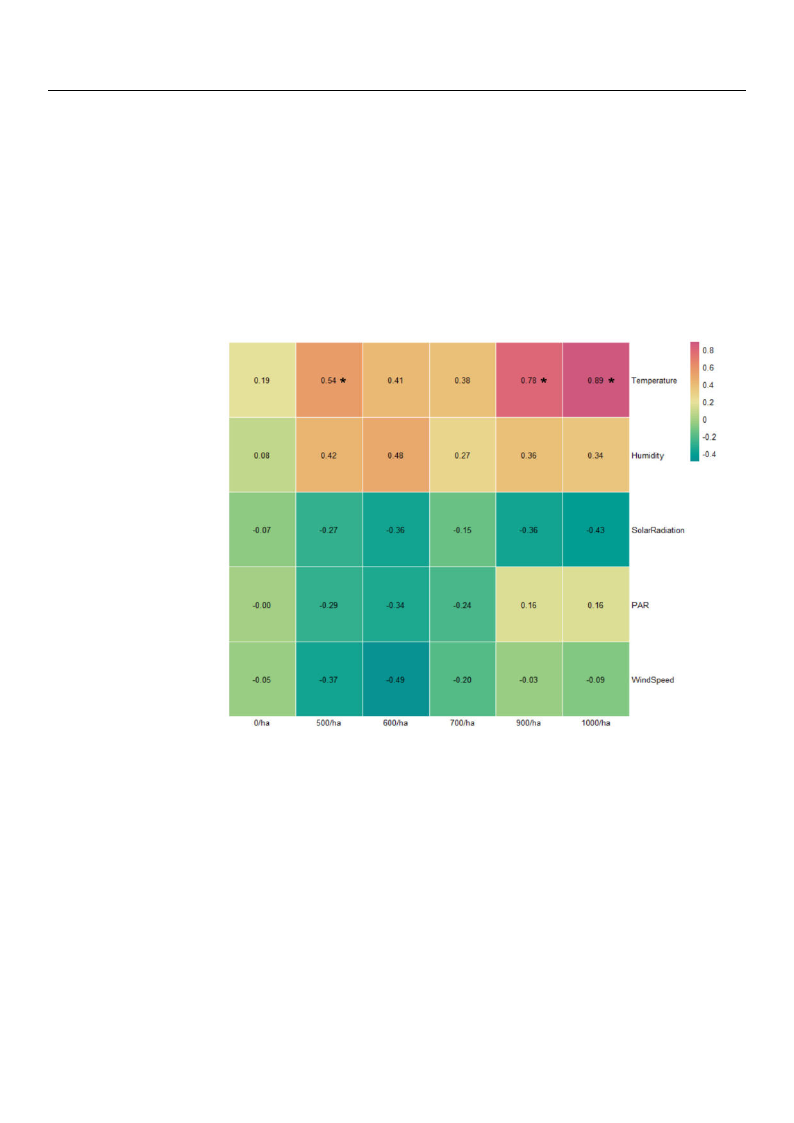
3.3. Correlation Analysis of NVOCs and Microclimate Environments
The Pearson correlation coefficient analysis between TNVOC emissions and microcli-
mate factors by forest density is shown in Figure 7. The TNVOC emissions data and the
microclimate environmental data were individually measured at each site surveyed (0/ha,
500/ha, 600/ha, 700/ha, 900/ha, and 1000/ha). After processing the collected data in units
of one hour, the analysis was performed separately for each study site. Temperature was
significantly positively correlated in 500/ha, 900/ha, and 1000/ha study sites. The control
site with zero tree count per hectare showed no strong correlation with any microclimate
factors, and PAR and wind speed did not show much correlation in 900/ha and 1000/ha
experimental sites. In addition, temperature and humidity generally showed positive
tendencies in all the study sites except the control site. Solar radiation, PAR, and wind
speed were noted to manifest negative tendencies in experimental sites.
Figure 7. Pearson correlation coefficient results between microclimate factors and TNVOC emissions
by forest density (* p < 0.05).
3.4. One-Way Analysis of Variance of NVOCs and Forest Density
One-way analysis of variance (one-way ANOVA) was performed to answer whether
NVOC emissions from P. koraiensis forests in one region were the same regardless of forest
density control as shown in Table 3. The study site with no tree count, 0/ha, was set as
control group, and the forest density-controlled regions were set as experimental groups
(500/ha, 600/ha, 700/ha, 900/ha, and 1000/ha). To more accurately analyze TNVOC
emissions, the analysis was conducted on 2351 TNVOC raw data points collected during
the survey period, instead of monthly phytoncide emissions by survey site. Since the
number of samples is more than thirty, normality tests were omitted by central limit
theorem, and homogeneity test was performed prior to the one-way ANOVA. Bartlett’s
test of homogeneity of variances rejected the null hypothesis with p < 0.001 and was not
satisfied homoskedasticity. As a result, Welch’s one-way ANOVA was carried out, and
at a significant level of p < 0.001, the null hypothesis was rejected, indicating that the
population means among independent variables were not all equal. A post hoc analysis
was conducted to determine the differences between specific groups, and Dunnett’s T3 test

Atmosphere 2021, 12, 1113
11 of 22
was performed. By analyzing the differences between control groups and experimental
groups, only the 700/ha experimental site was found to have a significant difference in
NVOC emissions between itself and the control group (0/ha). Furthermore, significant
differences in NVOC emissions were found when 900/ha and 1000/ha of dense forests
were adjusted to a density of 500/ha to 700/ha.
Table 3. Results of one-way analysis of variance of NVOCs and forest density.
Bartlett’s Test of Homogeneity of Variances
Bartlett’s K-squared
df
p-value
625.78
5
0.000
***
Welch’s One-Way Analysis of Variance
F
num df
denom df
p-value
36.046
5.0
1040.5
0.000
***
Dunnett’s T3 Test for Post Hoc Analysis (95% Confidence Level)
0/ha
500/ha
600/ha
700/ha
900/ha
500/ha
0.224
-
-
-
-
600/ha
0.565
1.000
-
-
-
700/ha
0.000 ***
0.189
0.081
-
-
900/ha
0.912
0.000 ***
0.000 ***
0.000 ***
-
1000/ha
0.080
0.000 ***
0.000 ***
0.000 ***
0.149
*** p < 0.001. df: degree of freedom; num df: degrees of freedom for the numerator; denom df: degrees of freedom
for the denominator.
3.5. Regression Analysis of NVOCs and Microclimate Environments by Forest Density
In order to discover the impact of microclimate factors on NVOC emissions and to
figure out which microclimate factors significantly affect phytoncide emissions for each
forest density, an NVOCs prediction equation was established. Through this prediction
equation, it is expected that the general public can easily calculate the phytoncide emissions
of the selected study site with an optimized forest density that would maximize the forest
healing effects.
3.5.1. Control Site (0 Tree/ha)
Prior to the analysis of the results, Durbin–Watson statistics were calculated to verify
its D–W value, and the resulting value was 1.43, close to 2.00, and it was determined to be
suitable for a multiple regression analysis model. However, it was not possible to derive a
significant regression equation with a significance probability of 0.645 for Model 1, and
the explanatory power of which the dependent variable is explained by the independent
variable was also very low at 9.7%. For Model 2, where Model 1 was processed according
to the bidirectional procedure method, the significant regression equation could not be
derived with a significance probability of 0.162, and the explanatory power was very low
at 5.9%. Furthermore, since there was only one remaining independent variable in Model 2,
the process of verifying multicollinearity among independent variables was omitted, and
it was concluded that significant regression analysis could not be derived by the multiple
regression model.
3.5.2. Experimental Site 1 (500 Trees/ha)
Regression results for the first experimental group, the 500/ha region, are shown in
Table 4. Prior to the analysis of the results, Durbin–Watson statistics were calculated to
verify its D–W value, and the resulting value was 1.57, close to 2.00, and it was determined
to be suitable for a multiple regression analysis model. The explanatory power of Model 2
was 58.2%, and the significance probability of Model 2 was 0.036, confirming that at least
one independent variable had a significant effect on the dependent variable. Furthermore,

Atmosphere 2021, 12, 1113
12 of 22
a multicollinearity test on Model 2 confirmed that all independent variables have a variance
inflation factor (VIF) of less than 10, indicating there is no multicollinearity. Among the
independent variables included in the regression model, temperature (p < 0.05) had a
significant effect on the dependent variable, TNVOC emissions, in the 500/ha region. In
addition, regression analysis shows that higher temperature (B = 0.047) result in higher
TNVOC emissions at the surveyed site, and higher solar radiation (B = −0.009) results in
lower TNVOC emissions. Among the independent variables of Model 2, temperature and
solar radiation, temperature (β = 0.568) was shown to have a greater effect on TNVOC
emissions in the 500/ha site. The regression equation of Model 2 for prediction of TNVOC
emissions in the 500/ha study site is shown below.
TNVOC = −0.237 + 0.047 × (Temperature) − 0.009 × (Solar Radiation)
(1)
Table 4. Results of regression analysis of experimental site (500 trees/ha).
Multiple Linear Regression and F-Test of Model 1 and Model 2
Indicators
B
SE
β
t
p2
Adjusted R 2
F
p3
(Constant) −2.604
5.101
0.000
−0.511
0.623
Temp.
0.096
0.094
0.164
1.027
0.335
Model 1
Humidity
Wind Speed
0.034
9.640
0.060
11.633
0.202
0.714
0.570
0.829
0.585
0.431
0.161
1.498
0.291
Solar Rad. −0.065
0.075
−0.519 −0.855
0.418
PAR
−0.035
0.082
−0.448 −0.428
0.680
(Constant) −0.237
0.456
0.000
−0.521
0.027 *
Model 2
Temp.
0.047
0.020
0.568
2.411
0.035 *
0.582
3.588 0.036 *
Solar Rad. −0.009
0.006
−0.327 −1.390
0.192
Multicollinearity Test and Durbin–Watson Statistics
Variance Inflation Factor
Durbin–Watson Statistics
Temperature
Solar Radiation
Lag
Autocorrelation
D–W
p
1.01
1.01
1
0.12
1.57
0.31
* p < 0.05. 2 Calculated probabilities of each independent variable. 3 Calculated probabilities of each model. B: unstandardized coefficient;
SE: standard error; β: standardized coefficient; Temp: temperature; Solar Rad: solar radiation; PAR: photosynthetically active radiation.
3.5.3. Experimental Site 2 (600 Trees/ha)
Regression results for the second experimental group, the 600/ha region, are shown
in Table 5. Prior to the analysis of the results, Durbin–Watson statistics were calculated to
verify its D–W value, and the resulting value was 1.52, close to 2.00, and it was determined
to be suitable for a multiple regression analysis model. The explanatory power of Model 2
was 56.6%, and the significance probability of Model 2 was 0.043, confirming that at least
one independent variable had a significant effect on the dependent variable. Furthermore,
a multicollinearity test on Model 2 confirmed that all independent variables have a variance
inflation factor (VIF) of less than 10, indicating there is no multicollinearity. Among the
independent variables included in the regression model, temperature (p < 0.05) had a
significant effect on the dependent variable, TNVOC emissions, in the 600/ha region.
In addition, regression analysis shows that higher temperature (B = 0.012) and humidity
(B = 0.014) result in higher TNVOC emissions at the surveyed site. Among the independent
variables of Model 2, temperature and humidity, temperature (β = 0.480) was shown to
have a greater effect on TNVOC emissions in the 600/ha site. The regression equation of
Model 2 for prediction of TNVOC emissions in the 600/ha study site is shown below.
TNVOC = −0.501 + 0.012 × (Temperature) + 0.014 × (Humidity)
(2)

Atmosphere 2021, 12, 1113
13 of 22
Table 5. Results of regression analysis of experimental site (600 trees/ha).
Indicators
Multiple Linear Regression and F-Test of Model 1 and Model 2
B
SE
β
t
p2
Adjusted R 2
F
p3
(Constant) −12.503 14.239
0.000
−0.878
0.406
Temp.
0.058
0.050
0.657
1.158
0.280
Model 1
Humidity
Wind Speed
0.138
10.133
0.162
12.660
0.856
0.716
0.850
0.800
0.420
0.447
0.016
1.043
0.455
Solar Rad.
0.011
0.042
0.233
0.255
0.805
PAR
−0.011
0.031
−0.443 −0.362
0.727
(Constant) −0.501
0.449
0.000
−1.117
0.028 *
Model 2
Temp.
0.012
0.009
0.480
1.002
0.046 *
0.566
3.589 0.043 *
Humidity
0.014
0.007
0.317
1.895
0.053
Multicollinearity Test and Durbin–Watson Statistics
Variance Inflation Factor
Durbin–Watson Statistics
Temperature
Humidity
Lag
Autocorrelation
D–W
p
2.38
2.38
1
0.20
1.52
0.37
* p < 0.05. 2 Calculated probabilities of each independent variable. 3 Calculated probabilities of each model. B: unstandardized coefficient;
SE: standard error; β: standardized coefficient; Temp: temperature; Solar Rad: solar radiation; PAR: photosynthetically active radiation.
3.5.4. Experimental Site 3 (700 Trees/ha)
Regression results for the third experimental group, the 700/ha region, are shown in
Table 6. Prior to the analysis of the results, Durbin–Watson statistics were calculated to
verify its D–W value, and the resulting value was 1.77, close to 2.00, and it was determined
to be suitable for a multiple regression analysis model. The explanatory power of Model 2
was 76.4%, and the significance probability of Model 2 was 0.017, confirming that at least
one independent variable had a significant effect on the dependent variable. Furthermore,
a multicollinearity test on Model 2 confirmed that all independent variables have a variance
inflation factor (VIF) of less than 10, indicating there is no multicollinearity. Among the in-
dependent variables included in the regression model, temperature and humidity (p < 0.05)
had a significant effect on the dependent variable, TNVOC emissions, in the 700/ha region.
In addition, regression analysis shows that higher temperature (B = 0.041) and humidity
(B = 0.029) result in higher TNVOC emissions at the surveyed site. Among the independent
variables of Model 2, temperature and humidity, humidity (β = 0.472) was shown to have a
greater effect on TNVOC emissions in the 700/ha site. The regression equation of Model 2
for prediction of TNVOC emissions in the 700/ha study site is shown below.
TNVOC = −0.410 + 0.041 × (Temperature) + 0.029 × (Humidity)
(3)
Table 6. Results of regression analysis of experimental site (700 trees/ha).
Indicators
(Constant)
Temp.
Model 1
Humidity
Wind Speed
Solar Rad.
PAR
Multiple Linear Regression and F-Test of Model 1 and Model 2
B
SE
β
t
p2
Adjusted R 2
−3.745
4.680
0.000
−0.800
0.447
0.072
0.055
0.669
1.312
0.226
0.030
1.486
0.047
2.114
0.768
0.646
0.640
0.703
0.540
0.502
0.174
−0.023
0.029
−0.802 −0.779
0.459
0.026
0.040
0.598
0.650
0.534
F
0.613
p3
0.694

Atmosphere 2021, 12, 1113
14 of 22
Table 6. Cont.
Indicators
Multiple Linear Regression and F-Test of Model 1 and Model 2
B
SE
β
t
p2
Adjusted R 2
F
p3
(Constant) −0.410
0.601
0.000
−0.683
0.091
Model 2
Temp.
0.041
0.029
0.384
1.411
0.047 *
0.764
2.077 0.017 *
Humidity
0.029
0.011
0.472
1.779
0.018 *
Multicollinearity Test and Durbin–Watson Statistics
Variance Inflation Factor
Durbin–Watson Statistics
Temperature
Humidity
Lag
Autocorrelation
D–W
p
2.09
2.09
1
0.02
1.77
0.56
* p < 0.05. 2 Calculated probabilities of each independent variable. 3 Calculated probabilities of each model. B: unstandardized coefficient;
SE: standard error; β: standardized coefficient; Temp: temperature; Solar Rad: solar radiation; PAR: photosynthetically active radiation.
3.5.5. Experimental Site 4 (900 Trees/ha)
Regression results for the fourth experimental group, the 900/ha region, are shown
in Table 7. Prior to the analysis of the results, Durbin–Watson statistics were calculated to
verify its D–W value, and the resulting value was 2.07, close to 2.00, and it was determined
to be suitable for a multiple regression analysis model. The explanatory power of Model 2
was 70.3%, and the significance probability of Model 2 was 0.003, confirming that at least
one independent variable had a significant effect on the dependent variable. Furthermore,
a multicollinearity test on Model 2 confirmed that all independent variables have a variance
inflation factor (VIF) of less than 10, indicating there is no multicollinearity. Among the
independent variables included in the regression model, temperature (p < 0.01) and wind
speed (p < 0.05) had a significant effect on the dependent variable, TNVOC emissions, in the
900/ha region. In addition, regression analysis shows that higher temperature (B = 0.046),
solar radiation (B = 0.020), and PAR (B = 0.007) result in higher TNVOC emissions at the
surveyed site, and higher wind speed (B = −0.664) results in lower TNVOC emissions.
Among the independent variables of Model 2, temperature, wind speed, solar radiation,
and PAR, temperature (β = 0.731) was shown to have a greater effect on TNVOC emissions
in the 900/ha site. The regression equation of Model 2 for prediction of TNVOC emissions
in the 900/ha study site is shown below.
TNVOC = −1.192 + 0.046 × (Temperature) − 0.664 × (Wind Speed) + 0.020 × (Solar Radiation) + 0.007 × (PAR) (4)
Table 7. Results of regression analysis of experimental site (900 trees/ha).
Indicators
(Constant)
Temp.
Model 1
Humidity
Wind Speed
Solar Rad.
PAR
(Constant)
Model 2
Temp.
Wind Speed
Solar Rad.
PAR
Multiple Linear Regression and F-Test of Model 1 and Model 2.
B
SE
β
t
p2
Adjusted R 2
−0.206
0.421
0.000
−2.861 0.021 *
0.043
0.016
0.822
2.677
0.028 *
0.001
−0.566
0.006
0.634
0.111
−0.784
0.172
−0.893
0.867
0.398
0.667
0.019
0.012
0.674
1.613
0.145
0.006
0.004
0.488
1.561
0.157
−1.192
0.391
0.000
−3.050 0.014 *
0.046
0.010
0.731
4.426
0.002 **
−0.664
0.269
−0.706 −2.470 0.036 *
0.703
0.020
0.010
0.518
2.031
0.073
0.007
0.003
0.520
2.159
0.059
F
6.218
8.703
p3
0.012 *
0.003 **

Atmosphere 2021, 12, 1113
15 of 22
Table 7. Cont.
Multicollinearity Test and Durbin–Watson Statistics
Variance Inflation Factor
Durbin–Watson Statistics
Temperature
Wind Speed Solar Rad. PAR
Lag
Autocorrelation
D–W
p
3.78
7.70
8.95
2.54
1
−0.56
2.07
0.08
* p < 0.05, ** p < 0.01. 2 Calculated probabilities of each independent variable. 3 Calculated probabilities of each model. B: unstandardized
coefficient; SE: standard error; β: standardized coefficient; Temp: temperature; Solar Rad: solar radiation; PAR: photosynthetically
active radiation.
3.5.6. Experimental Site 5 (1000 Trees/ha)
Regression results for the last experimental group, the 1000/ha region, are shown in
Table 8. Prior to the analysis of the results, Durbin–Watson statistics were performed to verify
its D–W value, and the resulting value was 1.96, close to 2.00, and it was determined to be
suitable for a multiple regression analysis model. The explanatory power of Model 2 was
94.6%, and the significance probability of Model 2 was 0.000, confirming that at least one
independent variable had a significant effect on the dependent variable. Furthermore, a
multicollinearity test on Model 2 confirmed that all independent variables have a variance
inflation factor (VIF) of less than 10, indicating there is no multicollinearity. Among the
independent variables included in the regression model, temperature (p < 0.001), wind
speed (p < 0.001), solar radiation (p < 0.01), and PAR (p < 0.001) had a significant effect on
the dependent variable, TNVOC emissions, in the 1000/ha region. In addition, regression
analysis shows that higher temperature (B = 0.033), solar radiation (B = 0.015), and PAR
(B = 0.005) result in higher TNVOC emissions at the surveyed site, and higher wind speed
(B = −0.466) results in lower TNVOC emissions. Among the independent variables of Model
2, temperature, wind speed, solar radiation, and PAR, temperature (β = 0.803) was shown to
have a greater effect on TNVOC emissions in the 1000/ha site. The regression equation of
Model 2 for prediction of TNVOC emissions in the 1000/ha study site is shown below.
TNVOC = −0.902 + 0.033 × (Temperature) − 0.466 × (Wind Speed) + 0.015 × (Solar Radiation) + 0.005 × (PAR) (5)
Table 8. Results of regression analysis of experimental site (1000 trees/ha).
Multiple Linear Regression and F-Test of Model 1 and Model 2
Indicators
B
SE
β
t
p2
Adjusted R 2
F
p3
(Constant)
−0.870
0.131
0.000
−6.656
0.000 ***
Temp.
0.035
0.004
0.837
8.961
0.000 ***
Model 1
Humidity
Wind Speed
−0.001
−0.568
0.002
0.168
−0.170
−0.754
−0.703
−3.381
0.502
0.009 **
0.943
43.77 0.000 ***
Solar Rad.
0.016
0.003
0.589
4.465
0.002 **
PAR
0.005
0.001
0.347
5.036
0.001 **
(Constant)
−0.902
0.119
0.000
−7.562
0.000 ***
Temp.
0.033
0.003
0.803
11.552
0.000 ***
Model 2
Wind Speed
−0.466
0.083
−0.547
−5.593
0.000 ***
0.946
57.84 0.000 ***
Solar Rad.
0.015
0.003
0.434
4.689
0.001 **
PAR
0.005
0.001
0.123
5.216
0.000 ***
Multicollinearity Test and Durbin–Watson Statistics
Variance Inflation Factor
Durbin–Watson Statistics
Temperature
Wind Speed Solar Rad.
PAR
Lag
Autocorrelation
D–W
p
3.08
6.90
7.60
2.42
1
−0.52
1.96
0.31
* p < 0.05, ** p < 0.01, *** p < 0.001. 2 Calculated probabilities of each independent variable. 3 Calculated probabilities of each model.
B: unstandardized coefficient; SE: standard error; β: standardized coefficient; Temp: temperature; Solar Rad: solar radiation; PAR:
photosynthetically active radiation.

Atmosphere 2021, 12, 1113
16 of 22
4. Discussion
This study was conducted with the aim of finding suitable forest density for maxi-
mizing the beneficial effects of forests on human health in the new afforestation of forests
or cultivated forests devastated by rapid urbanization and industrialization. As revealed
in previous papers, the cultivated forests are said to be of greater physiological and psy-
chological help to humans, compared to wild forests [16,17], and they also show different
therapeutic effects depending on the extent of their cultivation [23–32]. At a time when
the number of people visiting forests to experience their therapeutic function is increasing,
due to the COVID-19 pandemic, it is essential to optimize the therapeutic function through
forest therapy programs in properly cultivated forests [64–67]. However, despite this
situation, forest density control methods have rarely been studied with a focus on forests’
therapeutic functions, and only few studies have investigated healing factors for various
forest densities, researched relationships with forest microclimate factors, and suggested
suitable forest densities. Therefore, to compensate for the research gaps and limitations
of these prior studies, we collected and analyzed NVOCs and microclimate factor data
for forestry environments with six different ranges of forest density and present the most
optimal forest density for forest therapy.
This study was conducted based on a total of 17 NVOCs and five microclimate factor
data collected from September 2015 to December 2017. The TNVOC analysis, which com-
bined 17 types of NVOC emissions, showed that it was the highest in the summer, especially
in July. Additionally, α-Pinene, Camphene, and β-pinene were detected at higher rates in
every study site. These three compounds were also emitted at higher rates in other prior
studies which researched volatile organic compounds under the forest canopy [33,57,68,69].
Additionally, the annual TNVOC emissions were the highest in 700/ha regions, which
leads one to infer that the therapeutic effect through phytoncide would be the highest
in 700/ha regions. However, since the deviation of phytoncide emissions in the above
survey site was the largest, further investigation into phytoncide emissions in the 700/ha
area is needed. Observing the changes in the annual microclimate factor, solar radiation
was high in the forests with low forest density. This may be due to the low density of
the forest, resulting in a greater amount of solar radiation reaching the ground. Wind
speeds were also high in areas with low forest density, which is expected due to the low
density allowing winds to pass quickly through the forests without lingering. According to
the results of the Pearson correlation coefficient analysis, there were correlations between
microclimate factors and TNVOC emissions by forest density, and several significant results
could be obtained. Temperatures were shown to have significant correlations between
500/ha, 900/ha, and 1000/ha regions. The control site without trees (0/ha) had no sig-
nificant correlation with any microclimate factor. This result is also consistent with prior
studies which demonstrated relationships between temperature and terpenes emissions
under forest canopy [33,56,57,70–72]. Meanwhile, in the Pearson correlation coefficient
analysis, wind speed showed slight negative tendencies with phytoncide emissions in
all study sites, and in July, wind speed in all study sites decreased dramatically. Thus,
as shown in Figure 4, it can be inferred that the increase in phytoncide emissions in July
may have been affected by wind speed. This study establishes that there is a relationship
between forest density control and the extent of therapeutic effects, based on one-way
ANOVA and post hoc analyses conducted to determine changes in TNVOC emissions
due to forest density control. Analyses found that when conducting a forest cultivation
project on bare land without any trees (0/ha), it was most desirable to cultivate up to a
density of 700/ha. Furthermore, considering the therapeutic effects of forests, cultivating
forests down to levels of 500/ha to 700/ha is desirable when it comes to denser forests
(900/ha, 1000/ha). In some previous studies, changes of physiological and psychological
health conditions of visitors to forests of different ranges of forest density were measured
to reveal the therapeutic effects of forests according to forest stand densities. However, in
most cases, surveyed forests with different forest stand density in these studies did not
comprise the same species and trees of the same age, and there was a limitation in that

Atmosphere 2021, 12, 1113
17 of 22
the measurement was only one-off [73–75]. Therefore, this result is expected to be used
as an important basis for presenting the appropriate directions of forest density control in
the planning stage of future forest cultivation projects that aim to maximize the forest’s
therapeutic functions. Finally, this study analyzed microclimate factors that significantly
affect TNVOC emissions by forest density and performed regression analyses to predict
TNVOC emissions by forest density. As a result, the study failed to derive significant re-
gression equations for the control site, the 0/ha region. However, for the five experimental
sites of 500/ha, 600/ha, 700/ha, 900/ha, 900/ha, and 1000/ha, regression equations with
explanatory power of 58.2%, 56.6%, 76.4%, 70.3%, and 94.6%, respectively, were derived. In
all five surveyed sites, temperature had a significant positive impact on TNVOC emission
forecasts, and in all four sites except 700/ha, temperature had the largest impact compared
to other microclimate factors. The 600/ha and 700/ha regions had significant positive
effects on humidity, which is consistent with prior research that focused on different forest
densities of 500/ha, 600/ha, and 700/ha [60]. One interesting result was that wind speeds
in the 900/ha and 1000/ha regions had a significant negative effect on TNVOC emission
forecasts, the second largest after temperature. This can be found in the report regarding
guidelines for the management and creation of fine dust-reducing urban forests distributed
by the Korea Forest Service [76]. According to the report, forests with densities of 800/ha
to 1000/ha are said to maximize the length of time that wind circulates in the forest by
properly inducing the airflow in forests. In addition, there are several prior studies that
proved that dense forests significantly reduce wind speed and increase turbulence in the
air [77,78]. Therefore, the 900/ha and 1000/ha surveyed sites in this study are expected to
be affected by the prolonged wind retention and turbulence, making it difficult to capture
phytoncide and dispersing the released phytoncide. In conclusion, these derived predictive
equations are expected to enable forest visitors to easily calculate phytoncide emissions by
measuring several microclimate factors without directly measuring phytoncide in complex
and challenging ways. In particular, the equation for predicting the amount of phytoncide
in the 700/ha survey site, which was found to have excellent forest healing effects, is
expected to be of great assistance for follow-up studies.
It is important to note that this study has several limitations. First, this regression
is derived from data that measured P. koraiensis forests in Pocheon, South Korea, and the
threshold remains that predictive accuracy can be reduced in areas with different climates
and different physical or geographical elements. Second, as many other factors besides
microclimate elements can affect NVOC emissions of P. koraiensis forests, outside factors
also need to be considered, including NVOCs transportation through wind flow within
forests, soil nutrient availability, herbivore damage to plants, and microbial interactions.
Third, it is limiting that the NVOCs and microclimate data of P. koraiensis forests were
not measured continuously, but rather from March to December and March to September,
respectively. In addition, since only few studies have recognized changes in NVOC emis-
sions and their relationship with microclimate factors by forest density, there was a limit to
comparing the results of this study with prior research. In addition, 900/ha and 1000/ha
regions are relatively far from other study sites; therefore, there can be a limitation that
the microclimate environment in these areas may have been notably different from other
study sites. Lastly, there is also a limitation that as NVOCs and microclimate factors data
were not measured directly by controlling the forest density of each site surveyed, but by
setting up areas with different forest densities in the same forest as experimental groups,
the results may differ from the data measured immediately after direct forest cultivation;
thus, in subsequent studies, data collection on different forest types in varied regions after
direct forest cultivation, with continuous observations throughout every month, will allow
for a more expansive study. Additionally, measuring the difference in NVOC emissions by
further segmenting the forest density will enable to provide deeper insights. Furthermore,
since this study identified different microclimate factors which significantly affect NVOC
emissions at each forest density range, it is expected that further studies will be able to
consider these specific microclimate factors at each forest density in their research (instead

Atmosphere 2021, 12, 1113
18 of 22
of all microclimate factors). Considering forest density control methodology for maximiz-
ing forest healing functions, it is suggested that 700/ha is the optimal density for forest
therapy compared to other ranges of forest density.
The modern world, which has serious problems with massive forests being devas-
tated and disappearing every year, is focusing its efforts on forest restoration and forest
cultivation. In addition, as the recent COVID-19 pandemic has led to a significant increase
in the number of forest visitors to experience forests’ therapeutic functions, research on
how to restore and cultivate damaged and disappeared forests to maximize forest heal-
ing functions is urgent; yet very few studies have been conducted to link these forest
therapeutic functions with forest cultivation methods. Therefore, based on NVOCs and
microclimate data for the different ranges of forest densities, this study, which derived
prediction equations of phytoncide emissions for each forest density and suggested suitable
forest density based on statistical analyses, is significant in that it provides directions and
guidelines for maximizing forest therapy functions in future forest cultivation trials. It
is also expected to be used as a basis for designing adequate locations for future forest
therapy programs.
5. Conclusions
This study aimed to analyze NVOC emissions and microclimate factors according
to forest density and determine the forest density that is most suitable for forest therapy
when considering phytoncide emissions among various other forest therapy components.
This study was conducted in the P. koraiensis forest in Pocheon, South Korea, where the
area with 0 tree count per hectare was set up as a control group, and five study sites
of 500, 600, 700, 900, and 1000 tree counts per hectare were set as experimental groups.
Between September 2015 and December 2017, 2351 NVOCs data and 47,810 microclimate
data were collected, based on a total of 17 NVOCs data and five microclimate indicators.
Based on the collected data, the analysis of TNVOCs resulted in the release of the highest
concentration of phytoncide in the summer from all the target sites, and the highest
annual phytoncide emissions was observed at 700/ha out of the six study sites (including
both control and experimental groups). The Pearson correlation analysis indicated that
temperatures were positively correlated in study sites of 500/ha, 900/ha, and 1000/ha. The
results of a one-way ANOVA of the collected data showed the most significant difference
in average NVOC emissions, which was found when a treeless area (0/ha) was cultivated
at a density of 700/ha, and when managing dense forests (900/ha, 1000 ha), it has been
shown that it is most desirable in terms of therapeutic function to control densities of
500/ha to 700/ha. As a result of regression analysis for building regression equations that
can predict TNVOC emissions and finding out microclimate indicators that significantly
affect TNVOC emissions by forest density, for the five experimental sites of 500/ha, 600/ha,
700/ha, 900/ha, and 1000/ha, regression equations with explanatory power of 58.2%,
56.6%, 76.4%, 70.3%, and 94.6%, respectively, were derived. Based on these analysis results,
considering the therapeutic function of forests focused on phytoncide, 700/ha of forest
density is expected to maximize the therapeutic effects of forests, compared to other forest
densities. In addition, this study is expected to be used as an important basis and guideline
for controlling forest density when restoring devastated forests or creating forest therapy
spaces in the future.
Author Contributions: Conceptualization, Y.C., G.K., and S.P.; methodology, Y.C.; software, Y.C.;
validation, E.K. and S.K.; formal analysis, Y.C.; investigation, E.K. and S.K.; resources, G.K. and S.P.;
data curation, G.K.; writing—original draft preparation, Y.C. and E.K.; writing—review and editing,
G.K. and S.P.; visualization, Y.C.; supervision, G.K. and S.L.; project administration, S.L. All authors
have read and agreed to the published version of the manuscript.
Funding: This research received no external funding.
Institutional Review Board Statement: Not applicable.
Informed Consent Statement: Not applicable.

Atmosphere 2021, 12, 1113
19 of 22
Data Availability Statement: The data presented in this study are available on request from the
corresponding author. The data are not publicly available since they are collected for internal re-
search purposes of the National Institute of Forest Science, Republic of Korea.
Acknowledgments: We thank the anonymous reviewers for their constructive comments on the manuscript.
Conflicts of Interest: The authors declare no conflict of interest.
References
1. Food and Agriculture Organization of the United Nations. Global Forest Resources Assessment 2020; FAO: Rome, Italy, 2020.
[CrossRef]
2. Yao, N.; van den Bosch, C.C.K.; Yang, J.; Devisscher, T.; Wirtz, Z.; Jia, L.; Duan, J.; Ma, L. Beijing’s 50 Million New Urban Trees:
Strategic Governance for Large-Scale Urban Afforestation. Urban For. Urban Green. 2019, 44, 126392. [CrossRef]
3. Takahashi, Y.; Ryota, Y.; Aiba, S.; Sugawara, K.; Suzuki, S.; Ito, T.; Kato, S.; Suganuma, H.; Kojima, T. Numerical Analysis of Water
Movement in Arid Land for Afforestation. J. Arid Land Stud. 2018, 28, 185–188.
4. Doelman, J.C.; Stehfest, E.; van Vuuren, D.P.; Tabeau, A.; Hof, A.F.; Braakhekke, M.C.; Gernaat, D.E.; van den Berg, M.;
van Zeist, W.-J.; Daioglou, V. Afforestation for Climate Change Mitigation: Potentials, Risks and Trade-offs. Glob. Chang. Biol.
2020, 26, 1576–1591. [CrossRef] [PubMed]
5. Brown, I. Challenges in Delivering Climate Change Policy through Land Use Targets for Afforestation and Peatland Restoration.
Environ. Sci. Policy 2020, 107, 36–45. [CrossRef]
6. Park, H.; Lee, J.Y.; Song, M. Scientific Activities Responsible for Successful Forest Greening in Korea. For. Sci. Technol. 2017, 13,
1–8. [CrossRef]
7. Kim, G.S.; Lim, C.-H.; Kim, S.J.; Lee, J.; Son, Y.; Lee, W.-K. Effect of National-Scale Afforestation on Forest Water Supply and Soil
Loss in South Korea, 1971–2010. Sustainability 2017, 9, 1017. [CrossRef]
8. Bovio, G.; Marchetti, M.; Tonarelli, L.; Salis, M.; Vacchiano, G.; Lovreglio, R.; Elia, M.; Fiorucci, P.; Ascoli, D. Forest Fires Are
Changing: Let’s Change the Fire Management Strategy. J. Silvic. For. Ecol. 2017, 14, 202–205. [CrossRef]
9. Zhang, X.; Guan, D.; Li, W.; Sun, D.; Jin, C.; Yuan, F.; Wang, A.; Wu, J. The Effects of Forest Thinning on Soil Carbon Stocks and
Dynamics: A Meta-Analysis. For. Ecol. Manag. 2018, 429, 36–43. [CrossRef]
10. Lindroth, A.; Holst, J.; Heliasz, M.; Vestin, P.; Lagergren, F.; Biermann, T.; Cai, Z.; Mölder, M. Effects of Low Thinning on Carbon
Dioxide Fluxes in a Mixed Hemiboreal Forest. Agric. For. Meteorol. 2018, 262, 59–70. [CrossRef]
11. Eriksson, E.; Gillespie, A.R.; Gustavsson, L.; Langvall, O.; Olsson, M.; Sathre, R.; Stendahl, J. Integrated Carbon Analysis of Forest
Management Practices and Wood Substitution. Can. J. For. Res. 2007, 37, 671–681. [CrossRef]
12. Deal, R.L.; Cochran, B.; LaRocco, G. Bundling of Ecosystem Services to Increase Forestland Value and Enhance Sustainable Forest
Management. For. Policy Econ. 2012, 17, 69–76. [CrossRef]
13. Mattsson, L.; Li, C.-Z. How Do Different Forest Management Practices Affect the Non-Timber Value of Forests?—An Economic
Analysis. J. Environ. Manag. 1994, 41, 79–88. [CrossRef]
14. Anderson, H.W.; Hoover, M.D.; Reinhart, K.G. Forests and Water: Effects of Forest Management on Floods, Sedimentation, and Water
Supply; Pacific Southwest Forest and Range Experiment Station, Forest Service: Albany, CA, USA, 1976; Volume 18.
15. Bawa, K.S.; Seidler, R. Natural Forest Management and Conservation of Biodiversity in Tropical Forests. Conserv. Biol. 1998, 12,
46–55. [CrossRef]
16. Martens, D.; Gutscher, H.; Bauer, N. Walking in “Wild” and “Tended” Urban Forests: The Impact on Psychological Well-Being. J.
Environ. Psychol. 2011, 31, 36–44. [CrossRef]
17. Lee, K.J.; Hur, J.; Yang, K.-S.; Lee, M.-K.; Lee, S.-J. Acute Biophysical Responses and Psychological Effects of Different Types of
Forests in Patients with Metabolic Syndrome. Environ. Behav. 2018, 50, 298–323. [CrossRef]
18. Horner, G.J.; Baker, P.J.; Mac Nally, R.; Cunningham, S.C.; Thomson, J.R.; Hamilton, F. Forest Structure, Habitat and Carbon
Benefits from Thinning Floodplain Forests: Managing Early Stand Density Makes a Difference. For. Ecol. Manag. 2010, 259,
286–293. [CrossRef]
19. Finkral, A.J.; Evans, A.M. The Effects of a Thinning Treatment on Carbon Stocks in a Northern Arizona Ponderosa Pine Forest.
For. Ecol. Manag. 2008, 255, 2743–2750. [CrossRef]
20. Sohn, J.A.; Saha, S.; Bauhus, J. Potential of Forest Thinning to Mitigate Drought Stress: A Meta-Analysis. For. Ecol. Manag. 2016,
380, 261–273. [CrossRef]
21. Sun, G.; Caldwell, P.V.; McNulty, S.G. Modelling the Potential Role of Forest Thinning in Maintaining Water Supplies under a
Changing Climate across the Conterminous United States. Hydrol. Process. 2015, 29, 5016–5030. [CrossRef]
22. Fulé, P.Z.; McHugh, C.; Heinlein, T.A.; Covington, W.W. Potential Fire Behavior Is Reduced Following Forest Restoration
Treatments. In Ponderosa Pine Ecosystems Restoration and Conservation: Steps Toward Stewardship; Department of Agriculture, Forest
Service, Rocky Mountain Research Station: Ogden, UT, USA, 2001.
23. Tyrväinen, L.; Silvennoinen, H.; Kolehmainen, O. Ecological and Aesthetic Values in Urban Forest Management. Urban For. Urban
Green. 2003, 1, 135–149. [CrossRef]
24. Silvennoinen, H. Metsämaiseman Kauneus Ja Metsänhoidon Vaikutus Koettuun Maisemaan Metsikkötasolla. Helsinki: Suomen
Metsätieteellinen Seura. Diss. For. 2013, 242, 86. [CrossRef]

Atmosphere 2021, 12, 1113
20 of 22
25. Edwards, D.M.; Jay, M.; Jensen, F.S.; Lucas, B.; Marzano, M.; Montagné, C.; Peace, A.; Weiss, G. Public Preferences across Europe
for Different Forest Stand Types as Sites for Recreation. Ecol. Soc. 2012, 17, 27. [CrossRef]
26. An, K.W.; Kim, E.I.; Joen, K.S.; Setsu, T. Effects of Forest Stand Density on Human’s Physiopsychological Changes. J. Fac. Agric.
Kyushu Univ. 2004, 49, 283–291. [CrossRef]
27. Jiang, B.; Chang, C.-Y.; Sullivan, W.C. A Dose of Nature: Tree Cover, Stress Reduction, and Gender Differences. Landsc. Urban
Plan. 2014, 132, 26–36. [CrossRef]
28. Stoltz, J.; Lundell, Y.; Skärbäck, E.; van den Bosch, M.A.; Grahn, P.; Nordström, E.-M.; Dolling, A. Planning for Restorative Forests:
Describing Stress-Reducing Qualities of Forest Stands Using Available Forest Stand Data. Eur. J. For. Res. 2016, 135, 803–813.
[CrossRef]
29. Edwards, D.; Jay, M.; Jensen, F.S.; Lucas, B.; Marzano, M.; Montagné, C.; Peace, A.; Weiss, G. Public Preferences for Structural
Attributes of Forests: Towards a Pan-European Perspective. For. Policy Econ. 2012, 19, 12–19. [CrossRef]
30. Hussain, R.I.; Walcher, R.; Eder, R.; Allex, B.; Wallner, P.; Hutter, H.-P.; Bauer, N.; Arnberger, A.; Zaller, J.G.; Frank, T. Management
of Mountainous Meadows Associated with Biodiversity Attributes, Perceived Health Benefits and Cultural Ecosystem Services.
Sci. Rep. 2019, 9, 1–9. [CrossRef] [PubMed]
31. Saito, H.; Horiuchi, M.; Takayama, N.; Fujiwara, A. Effects of Managed Forest versus Unmanaged Forest on Physiological
Restoration from a Stress Stimulus, and the Relationship with Individual Traits. J. For. Res. 2019, 24, 77–85. [CrossRef]
32. Takayama, N.; Fujiwara, A.; Saito, H.; Horiuchi, M. Management Effectiveness of a Secondary Coniferous Forest for Landscape
Appreciation and Psychological Restoration. Int. J. Environ. Res. Public Health 2017, 14, 800. [CrossRef] [PubMed]
33. Bach, A.; Yáñez-Serrano, A.M.; Llusià, J.; Filella, I.; Maneja, R.; Penuelas, J. Human Breathable Air in a Mediterranean Forest:
Characterization of Monoterpene Concentrations under the Canopy. Int. J. Environ. Res. Public Health 2020, 17, 4391. [CrossRef]
34. Meneguzzo, F.; Albanese, L.; Bartolini, G.; Zabini, F. Temporal and Spatial Variability of Volatile Organic Compounds in the
Forest Atmosphere. Int. J. Environ. Res. Public Health 2019, 16, 4915. [CrossRef] [PubMed]
35. Gershenzon, J.; Dudareva, N. The Function of Terpene Natural Products in the Natural World. Nat. Chem. Biol. 2007, 3, 408–414.
[CrossRef] [PubMed]
36. Mewalal, R.; Rai, D.K.; Kainer, D.; Chen, F.; Külheim, C.; Peter, G.F.; Tuskan, G.A. Plant-Derived Terpenes: A Feedstock for
Specialty Biofuels. Trends Biotechnol. 2017, 35, 227–240. [CrossRef]
37. Martin, D.M.; Gershenzon, J.; Bohlmann, J. Induction of Volatile Terpene Biosynthesis and Diurnal Emission by Methyl Jasmonate
in Foliage of Norway Spruce. Plant Physiol. 2003, 132, 1586–1599. [CrossRef]
38. Li, Q.; Kobayashi, M.; Wakayama, Y.; Inagaki, H.; Katsumata, M.; Hirata, Y.; Hirata, K.; Shimizu, T.; Kawada, T.; Park, B.J. Effect
of Phytoncide from Trees on Human Natural Killer Cell Function. Int. J. Immunopathol. Pharmacol. 2009, 22, 951–959. [CrossRef]
[PubMed]
39. Abe, T.; Hisama, M.; Tanimoto, S.; Shibayama, H.; Mihara, Y.; Nomura, M. Antioxidant Effects and Antimicrobial Activites of
Phytoncide. Biocontrol Sci. 2008, 13, 23–27. [CrossRef] [PubMed]
40. Nam, E.-S.; Uhm, D.-C. Effects of Phytoncides Inhalation on Serum Cortisol Level and Life Stress of College Students. Korean J.
Adult Nurs. 2008, 20, 697–706.
41. Kawakami, K.; Kawamoto, M.; Nomura, M.; Otani, H.; Nabika, T.; Gonda, T. Effects of Phytoncides on Blood Pressure under
Restraint Stress in SHRSP. Clin. Exp. Pharmacol. Physiol. 2004, 31, S27–S28. [CrossRef] [PubMed]
42. Lee, J.; Park, B.-J.; Tsunetsugu, Y.; Ohira, T.; Kagawa, T.; Miyazaki, Y. Effect of Forest Bathing on Physiological and Psychological
Responses in Young Japanese Male Subjects. Public Health 2011, 125, 93–100. [CrossRef]
43. Kim, C.-G.; Cho, M.-K.; Kim, J.-I. Effects of Phytoncide Aromatherapy on Stress, Symptoms of Stress and Heart Rate Variability
among Nursing Students. J. Korean Biol. Nurs. Sci. 2012, 14, 249–257. [CrossRef]
44. Cheng, W.-W.; Lin, C.-T.; Chu, F.-H.; Chang, S.-T.; Wang, S.-Y. Neuropharmacological Activities of Phytoncide Released from
Cryptomeria Japonica. J. Wood Sci. 2009, 55, 27–31. [CrossRef]
45. Antonelli, M.; Donelli, D.; Barbieri, G.; Valussi, M.; Maggini, V.; Firenzuoli, F. Forest Volatile Organic Compounds and Their
Effects on Human Health: A State-of-the-Art Review. Int. J. Environ. Res. Public Health 2020, 17, 6506. [CrossRef] [PubMed]
46. Woo, J.; Lee, C.J. Sleep-Enhancing Effects of Phytoncide Via Behavioral, Electrophysiological, and Molecular Modeling Approaches.
Exp. Neurobiol. 2020, 29, 120. [CrossRef] [PubMed]
47. Matsuo, A.L.; Figueiredo, C.R.; Arruda, D.C.; Pereira, F.V.; Scutti, J.A.B.; Massaoka, M.H.; Travassos, L.R.; Sartorelli, P.; Lago, J.H.
α-Pinene Isolated from Schinus Terebinthifolius Raddi (Anacardiaceae) Induces Apoptosis and Confers Antimetastatic Protection
in a Melanoma Model. Biochem. Biophys. Res. Commun. 2011, 411, 449–454. [CrossRef] [PubMed]
48. Kim, T.; Song, B.; Cho, K.S.; Lee, I.-S. Therapeutic Potential of Volatile Terpenes and Terpenoids from Forests for Inflammatory
Diseases. Int. J. Mol. Sci. 2020, 21, 2187. [CrossRef] [PubMed]
49. Rufino, A.T.; Ribeiro, M.; Sousa, C.; Judas, F.; Salgueiro, L.; Cavaleiro, C.; Mendes, A.F. Evaluation of the Anti-Inflammatory,
Anti-Catabolic and pro-Anabolic Effects of E-Caryophyllene, Myrcene and Limonene in a Cell Model of Osteoarthritis. Eur. J.
Pharmacol. 2015, 750, 141–150. [CrossRef]
50. Souto-Maior, F.N.; de Carvalho, F.L.; de Morais, L.C.S.L.; Netto, S.M.; de Sousa, D.P.; de Almeida, R.N. Anxiolytic-like Effects
of Inhaled Linalool Oxide in Experimental Mouse Anxiety Models. Pharmacol. Biochem. Behav. 2011, 100, 259–263. [CrossRef]
[PubMed]

Atmosphere 2021, 12, 1113
21 of 22
51. Hirota, R.; Nakamura, H.; Bhatti, S.A.; Ngatu, N.R.; Muzembo, B.A.; Dumavibhat, N.; Eitoku, M.; Sawamura, M.; Suganuma, N.
Limonene Inhalation Reduces Allergic Airway Inflammation in Dermatophagoides Farinae-Treated Mice. Inhal. Toxicol. 2012, 24,
373–381. [CrossRef] [PubMed]
52. Yun, J. Limonene Inhibits Methamphetamine-Induced Locomotor Activity via Regulation of 5-HT Neuronal Function and
Dopamine Release. Phytomedicine 2014, 21, 883–887. [CrossRef]
53. Yoshida, N.; Takada, T.; Yamamura, Y.; Adachi, I.; Suzuki, H.; Kawakami, J. Inhibitory Effects of Terpenoids on Multidrug
Resistance-Associated Protein 2-and Breast Cancer Resistance Protein-Mediated Transport. Drug Metab. Dispos. 2008, 36,
1206–1211. [CrossRef]
54. Chen, W.; Liu, Y.; Li, M.; Mao, J.; Zhang, L.; Huang, R.; Jin, X.; Ye, L. Anti-Tumor Effect of α-Pinene on Human Hepatoma Cell
Lines through Inducing G2/M Cell Cycle Arrest. J. Pharmacol. Sci. 2015, 127, 332–338. [CrossRef]
55. Yáñez-Serrano, A.M.; Bach, A.; Bartolomé-Català, D.; Matthaios, V.; Seco, R.; Llusià, J.; Filella, I.; Peñuelas, J. Dynamics of Volatile
Organic Compounds in a Western Mediterranean Oak Forest. Atmos. Environ. 2021, 257, 118447. [CrossRef]
56. Kim, G.; Park, S.; Kwak, D. Is It Possible to Predict the Concentration of Natural Volatile Organic Compounds in Forest
Atmosphere? Int. J. Environ. Res. Public Health 2020, 17, 7875. [CrossRef]
57. Choi, Y.; Kim, G.; Park, S.; Kim, E.; Kim, S. Prediction of Natural Volatile Organic Compounds Emitted by Bamboo Groves in
Urban Forests. Forests 2021, 12, 543. [CrossRef]
58. Goldstein, A.H.; McKay, M.; Kurpius, M.R.; Schade, G.W.; Lee, A.; Holzinger, R.; Rasmussen, R.A. Forest Thinning Experiment
Confirms Ozone Deposition to Forest Canopy Is Dominated by Reaction with Biogenic VOCs. Geophys. Res. Lett. 2004, 31.
[CrossRef]
59. Schade, G.W.; Goldstein, A.H. Increase of Monoterpene Emissions from a Pine Plantation as a Result of Mechanical Disturbances.
Geophys. Res. Lett. 2003, 30. [CrossRef]
60. Jo, Y.; Park, S.; Jeong, M.; Lee, J.; Yoo, R.; Kim, C.; Lee, S. Analysis of Phytoncide Concentration and Micrometeorology Factors by
Pinus Koraiensis Stand Density. J. Environ. Health Sci. 2018, 44, 205–216.
61. Kim, C.S.; Nam, J.W.; Jo, J.W.; Kim, S.-Y.; Han, J.-G.; Hyun, M.W.; Sung, G.-H.; Han, S.-K. Studies on Seasonal Dynamics of
Soil-Higher Fungal Communities in Mongolian Oak-Dominant Gwangneung Forest in Korea. J. Microbiol. 2016, 54, 14–22.
[CrossRef]
62. Kim, C.S.; Han, S.-K.; Nam, J.W.; Jo, J.W.; Kwag, Y.-N.; Han, J.-G.; Sung, G.-H.; Lim, Y.W.; Oh, S. Fungal Communities in a Korean
Red Pine Stand, Gwangneung Forest, Korea. J. Asia-Pac. Biodivers. 2017, 10, 559–572. [CrossRef]
63. Geonwoo, K.I.M.; Park, B.-J.; Joung, D.; Yeom, D.-G.; Shinya, K. Primary Concentration Measurements of Natural Volatile Organic
Compounds in Atmosphere Using the Headspace Solid–Phase Microextraction Method within the Forest. J. Fac. Agric. Kyushu
Univ. 2015, 60, 471–476.
64. Geng, D.C.; Innes, J.; Wu, W.; Wang, G. Impacts of COVID-19 Pandemic on Urban Park Visitation: A Global Analysis. J. For. Res.
2021, 32, 553–567. [CrossRef] [PubMed]
65. Derks, J.; Giessen, L.; Winkel, G. COVID-19-Induced Visitor Boom Reveals the Importance of Forests as Critical Infrastructure.
For. Policy Econ. 2020, 118, 102253. [CrossRef] [PubMed]
66. Kim, G.; Park, B.-J.; Koga, S. Development of a Prediction Model for NVOC Concentration with Changing Microclimate in
Camellia Japonica Temple Forest. Kyushu Univ. 2021, 66, 105–113.
67. Ha, K.; Shin, W. Changes of the Forest Therapy Paradigm in the Post-Corona Era: Focusing on Analysis of News Search Words
Related to Forest Therapy and COVID-19. J. Tour. Manag. Res. 2021, 25, 611–637.
68. Chang, K.-H.; Yu, J.-Y.; Chen, T.-F.; Lin, Y.-P. Estimating Taiwan Biogenic VOC Emission: Leaf Energy Balance Consideration.
Atmos. Environ. 2009, 43, 5092–5100. [CrossRef]
69. Zhu, S.; Hu, F.; He, S.; Qiu, Q.; Su, Y.; He, Q.; Li, J. Comprehensive Evaluation of Healthcare Benefits of Different Forest Types: A
Case Study in Shimen National Forest Park, China. Forests 2021, 12, 207. [CrossRef]
70. Llusia, J.; Peñuelas, J.; Seco, R.; Filella, I. Seasonal Changes in the Daily Emission Rates of Terpenes by Quercus Ilex and the
Atmospheric Concentrations of Terpenes in the Natural Park of Montseny, NE Spain. J. Atmos. Chem. 2012, 69, 215–230. [CrossRef]
71. Yatagai, M.; Ohira, M.; Ohira, T.; Nagai, S. Seasonal Variations of Terpene Emission from Trees and Influence of Temperature,
Light and Contact Stimulation on Terpene Emission. Chemosphere 1995, 30, 1137–1149. [CrossRef]
72. Llusià, J.; Peñuelas, J. Pinus Halepensis and Quercus Ilex Terpene Emission as Affected by Temperature and Humidity. Biol. Plant.
1999, 42, 317–320. [CrossRef]
73. Oishi, Y.; Kanehama, S.; Hiyane, A.; Taguchi, H. Comparison of Forest Image and Mood Psychological Examination in a Forest
Environment Using Profile of Mood States and Semantic Differential Method. J. Jpn. For. Soc. 2003, 85, 70–77.
74. Simkin, J.; Ojala, A.; Tyrväinen, L. Restorative Effects of Mature and Young Commercial Forests, Pristine Old-Growth Forest and
Urban Recreation Forest-A Field Experiment. Urban For. Urban Green. 2020, 48, 126567. [CrossRef]
75. Khan, D.; Muneer, M.A.; Nisa, Z.-U.; Shah, S.; Amir, M.; Saeed, S.; Uddin, S.; Munir, M.Z.; Lushuang, G.; Huang, H. Effect of
Climatic Factors on Stem Biomass and Carbon Stock of Larix Gmelinii and Betula Platyphylla in Daxing’anling Mountain of
Inner Mongolia, China. Adv. Meteorol. 2019, 2019. [CrossRef]
76. Bak, C.; Choe, S.; Gim, T.; Yu, S.; Gim, P. Monitoring Guideline at the Forests against Attenuation of Particulate Matters; National
Institute of Forest Science: Seoul, Korea, 2019; Volume 836.

Atmosphere 2021, 12, 1113
22 of 22
77. Bernatzky, A. The Effects of Trees on the Urban Climate. In Trees in the 21st Century; Academic Publishers: Berkhamster, UK, 1983;
pp. 59–76.
78. Dalpé, B.; Masson, C. Numerical Study of Fully Developed Turbulent Flow within and above a Dense Forest. Wind Energy Int. J.
Prog. Appl. Wind Power Convers. Technol. 2008, 11, 503–515. [CrossRef]